. 2016 Nov 25:5:e20357.
doi: 10.7554/eLife.20357.

Accelerated cell divisions drive the outgrowth of the regenerating spinal cord in axolotls

Affiliations

Accelerated cell divisions drive the outgrowth of the regenerating spinal cord in axolotls

Fabian Rost et al. Elife. .

Abstract

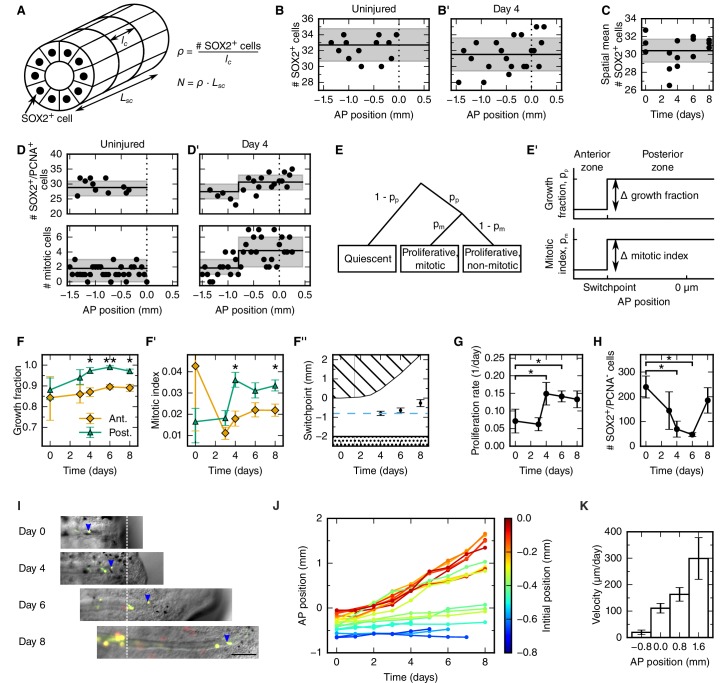
Axolotls are unique in their ability to regenerate the spinal cord. However, the mechanisms that underlie this phenomenon remain poorly understood. Previously, we showed that regenerating stem cells in the axolotl spinal cord revert to a molecular state resembling embryonic neuroepithelial cells and functionally acquire rapid proliferative divisions (Rodrigo Albors et al., 2015). Here, we refine the analysis of cell proliferation in space and time and identify a high-proliferation zone in the regenerating spinal cord that shifts posteriorly over time. By tracking sparsely-labeled cells, we also quantify cell influx into the regenerate. Taking a mathematical modeling approach, we integrate these quantitative datasets of cell proliferation, neural stem cell activation and cell influx, to predict regenerative tissue outgrowth. Our model shows that while cell influx and neural stem cell activation play a minor role, the acceleration of the cell cycle is the major driver of regenerative spinal cord outgrowth in axolotls.

Keywords: axolotl; cell proliferation; computational biology; developmental biology; modeling; regeneration; stem cells; systems biology.


Conflict of interest statement

The authors declare that no competing interests exist.

Figures

Figure 1.
Figure 1.. Spinal cord outgrowth time-course during regeneration.
(A) Representative images of a regenerating spinal cord after tail amputation (individual time-lapse images are in Figure 1—figure supplement 1). The white dashed line marks the amputation plane. The arrowheads mark the tip of the regenerating spinal cord. Scale bar, 1 mm. (B) Spinal cord outgrowth time-course during the first eight days after amputation (n = 8 axolotls). DOI: http://dx.doi.org/10.7554/eLife.20357.002
Figure 1—figure supplement 1.
Figure 1—figure supplement 1.. Images used for spinal cord outgrowth measurements in Figure 1B.
Each row shows images from an axolotl; each column shows animals from one time point analyzed. Vertical and horizontal green lines mark the amputation plane and the spinal cord outgrowth, respectively. High-resolution images are in Rost et al., 2016b. Animal t3 is shown in the representative images of Figure 1A. DOI: http://dx.doi.org/10.7554/eLife.20357.003
Figure 2.
Figure 2.. Cellular mechanisms underlying spinal cord outgrowth.
(A) Sketch of measurements taken to estimate the density and total number of neural stem cells (nuclei, black dots) in the axolotl spinal cord. The density of SOX2+ cells, ρ, is the ratio of the number of SOX2+ cells per cross section (# stem cells) and the mean AP cell length, lc. The density of SOX2+ cells is the proportionality constant between the total number of stem cells in a zone along the spinal cord with zone length, LSC. (B,B’) Number of SOX2+ cells per cross section along the AP axis of a selected uninjured (B) and a selected day 4-regenerating spinal cord (B’). Black line and gray region indicate the mean number of SOX2+ cells and the standard deviation, respectively. Plots for all individual axolotls in Figure 2—figure supplement 1. (C) Spatial mean of the number of SOX2+ cells per cross section of individual axolotls against time (black dots). Black line and gray region indicate the mean number of SOX2+ cells and the standard deviation of all animals, respectively. (D,D’) Number of SOX2+/PCNA+ cells per cross section (upper panel) and mitotic cells per section (lower panel) along the AP axis in a selected uninjured (D) and a selected day 4-regenerating spinal cord (D’). Black line and the gray region show the expected number and the 68% confidence belt for the best fit of the model with two spatial proliferation zones, respectively. Plots for all animals in Figure 2—figure supplement 3. (E) Possible cell states in the two spatial proliferation zones model used to analyze the spatial cell proliferation dataset (D,D’). pp, probability that a cell is proliferative, otherwise quiescent. pm, probability that a proliferative cell undergoes mitosis at the time of analysis. (E’) The model assumes two proliferation zones. The location of the border between zones is called switchpoint. (FF’) Results of model fitting for growth fraction (F) and mitotic index time-course (F’) in the anterior (orange diamonds) and posterior (green triangles) zone. Error bars indicate the 68% credibility interval. (F’’) Black dots mark the switchpoint. Blue dashed line marks 800 μm anterior to the amputation plane. The dashed region marks the space outside of the embryo, the dotted region marks the unaffected part of the embryo. (G) Proliferation rate time-course in the high-proliferation zone. (H) Total number of SOX2+/PCNA- cells in the high-proliferation zone (mean ± linearly propagated 1-σ error). (I) Selected time-lapse images of clone (blue arrowhead) tracking during spinal cord regeneration. Dashed line marks the amputation plane. Scale bar, 200 μm (J) Tracking of 19 clones along the AP axis during regeneration. Clone trajectories are color coded by their initial position. (K) Clone velocities at different positions along the AP axis. DOI: http://dx.doi.org/10.7554/eLife.20357.004
Figure 2—figure supplement 1.
Figure 2—figure supplement 1.. Number of SOX2+ cells per cross section along the AP axis for all 15 animals.
Each row shows data from three animals at a given time point. Data from animals 0D_1 and 4D_3 are shown as representative data in Figure 2B and B’, respectively. DOI: http://dx.doi.org/10.7554/eLife.20357.005
Figure 2—figure supplement 2.
Figure 2—figure supplement 2.. Simulation of the spatial model of cell counts to analyze the spatiotemporal pattern of cell proliferation.
(A) Simulations of a spatially homogeneous zone of proliferation for three animals. Population mean number of stem cells per cross section, NSpop = 7, inter-animal standard deviation for number of stem cells per cross section, σpop = 1, intra-animal standard deviation for number of stem cells per cross section, σ = 0.5, probability of a cell to be proliferative (expected growth fraction), pp = 0.5, inter-animal standard deviation of pp, σp = 0.04, probability of a proliferative cell to be mitotic (expected mitotic index), pm = 0.015, inter-animal standard deviation of pm, σm = 0.003. (B) Simulations of two adjacent spatially homogeneous zones of proliferation for three animals. Parameters for the anterior zone are the same as in (A). The probability of a cell to be proliferative and probability of a proliferative cell to be mitotic in the posterior zone are elevated to pp = 0.8 and pm = 0.1, respectively. The mean switchpoint location is 300 μm anterior to the amputation plane and the corresponding inter-animal standard deviation is 100 μm. As expected, there are more proliferative and mitotic cells in the posterior zone. Simulation results can statistically be compared with the cell counts we obtained from experimentally observed animals to infer growth fraction, mitotic index and switchpoint (Figure 2F–F’’). DOI: http://dx.doi.org/10.7554/eLife.20357.006
Figure 2—figure supplement 3.
Figure 2—figure supplement 3.. Number of SOX2+/PCNA+ cells per cross section (upper panel) and mitotic cells per section (lower panel) along the AP axis for all 15 animals.
Data from animals 0D_1 and 4D_3 are shown in Figure 2D and D’, respectively. Each row shows data from three animals at a given time point. DOI: http://dx.doi.org/10.7554/eLife.20357.007
Figure 2—figure supplement 4.
Figure 2—figure supplement 4.. Posterior marginal distributions for the parameters of the spatial model of cell counts to analyze the spatiotemporal pattern of proliferation.
Each row shows a different model parameter. Each column shows a different time point. Three animals per time point were used in the analysis. Vertical dashed lines show the limits of the 95% credibility interval. The distribution means and the 68% credibility intervals for the growth fraction, mitotic index and the switchpoint are shown in Figure 2F–F’’. DOI: http://dx.doi.org/10.7554/eLife.20357.008
Figure 2—figure supplement 5.
Figure 2—figure supplement 5.. Cell cycle length time-course calculated from the proliferation rate time-course shown in Figure 2G.
DOI: http://dx.doi.org/10.7554/eLife.20357.009
Figure 3.
Figure 3.. Mechanistic model of spinal cord outgrowth.
(A) Sketch of cellular mechanisms included in the model: cell proliferation, quiescent cell activation, and cell influx into the 800 μm high-proliferation zone. (B) Growth fraction time-course of the SOX2+ cell population in the high-proliferation zone as observed (black dots) and fitted by the model (gray shaded areas, from darker to lighter, 68%, 95% and 99.7% confidence intervals of the model prediction). (C) Spinal cord outgrowth during the first eight days of regeneration as observed (black dots, n = 8 axolotls) and predicted by the model (Equations 1 and 2) (green shaded areas, from darker to lighter, 68%, 95% and 99.7% confidence intervals). The model prediction is in agreement with the experimental data. (DG) Prediction of spinal cord outgrowth for four model scenarios based on Equations 1 and 2 with selected mechanisms switched off (green shaded areas). Black dots show the same experimental data as in panel (C). (D) The acceleration of the cell cycle is switched off. Hence, the proliferation rate is fixed to the basal proliferation rate of uninjured animals. (E) Cell influx is switched off (v = 0). (F) Quiescent cell activation is switched off (k = 0). (G) Cell influx and quiescent cell activation are switched off (k = 0, v = 0). Corresponding predictions for growth fraction in Figure 3—figure supplement 1. DOI: http://dx.doi.org/10.7554/eLife.20357.010
Figure 3—figure supplement 1.
Figure 3—figure supplement 1.. Prediction of the growth fraction in the high-proliferation zone for four model scenarios with selected mechanisms switched off (green shaded areas).
Black dots show the same experimental data as in Figure 3B. Scenarios in panels A-D correspond to the scenarios in Figure 3D–G, respectively. Switching off the acceleration of the cell cycle length and switching off the cell influx hardly have an effect on the growth fraction time course (A,B). As expected, switching off the activation of quiescent stem cells has a strong impact on growth fraction time-course (C,D). This is consistent with the fit of a non-zero activation rate k to these data. DOI: http://dx.doi.org/10.7554/eLife.20357.011
Figure 3—figure supplement 2.
Figure 3—figure supplement 2.. Comparison of the spinal cord outgrowth prediction by our model with the measured outgrowth reported by Fei et al. (2014).
(A) Outgrowth prediction of the full model (green, same as in Figure 3C) and rescaled outgrowth in the control condition from Fei et al., 2014 (black dot, n = 12 axolotls). (B) Outgrowth prediction of the model for the case that cell cycle acceleration is switched off (green, same as in Figure 3D) and rescaled, density-corrected outgrowth in a Sox2-knockout condition from Fei et al., 2014 (black dot, n = 24 axolotls). DOI: http://dx.doi.org/10.7554/eLife.20357.012
Figure 4.
Figure 4.. Conceptual model of spinal cord growth during regeneration.
Only one row of stem cells is shown as circles and three cell clones are marked with different patterns (striped, black and dotted). In the uninjured spinal cord (Day 0), cells divide at a slow, basal proliferation rate (white background). From day 4 after amputation, cells speed up their cell cycle and the growth fraction increases, within a high-proliferation zone that initially extends 800 μm anterior to the amputation plane (green background). The density of neural stem cells along the spinal cord stays constant and spinal cord outgrowth is achieved by an increase in the total number of neural stem cells. Acceleration of the cell cycle in the high-proliferation zone is the major driver of this increase in cell numbers. Dividing cells might push cells posteriorly. The more posterior a cell is the more cells anterior to that cell divide and push the cell making it move faster: While an anterior clone (striped) hardly moves, clones in the center of the high proliferation zone (black) move faster. Clones that start at the amputation plane (dotted) stay at the tip of the regenerating spinal cord and move fastest. DOI: http://dx.doi.org/10.7554/eLife.20357.013

References

    1. Becker CG, Becker T. Neuronal regeneration from ependymo-radial glial cells: cook, little pot, cook! Developmental Cell. 2015;32:516–527. doi: 10.1016/j.devcel.2015.01.001. - DOI - PubMed
    1. Chara O, Tanaka EM, Brusch L. Mathematical modeling of regenerative processes. Current Topics in Developmental Biology. 2014;108:283–317. doi: 10.1016/B978-0-12-391498-9.00011-5. - DOI - PubMed
    1. D'Agostino RB. An omnibus test of normality for moderate and large size samples. Biometrika. 1971;58:341–348. doi: 10.1093/biomet/58.2.341. - DOI
    1. Durant F, Lobo D, Hammelman J, Levin M. Physiological controls of large-scale patterning in planarian regeneration: a molecular and computational perspective on growth and form. Regeneration. 2016;3:78–102. doi: 10.1002/reg2.54. - DOI - PMC - PubMed
    1. D’Agostino R, Pearson ES. Tests for departure from normality. Empirical results for the distributions of b2 and √b1. Biometrika. 1973;60:613–622. doi: 10.1093/biomet/60.3.613. - DOI

Publication types