. 2016 Nov 23;16(11):1978.
doi: 10.3390/s16111978.

Representation Method for Spectrally Overlapping Signals in Flow Cytometry Based on Fluorescence Pulse Time-Delay Estimation

Affiliations

Representation Method for Spectrally Overlapping Signals in Flow Cytometry Based on Fluorescence Pulse Time-Delay Estimation

Wenchang Zhang et al. Sensors (Basel). .

Abstract

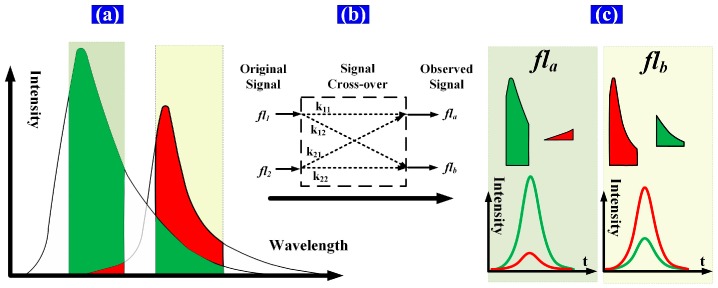
Flow cytometry is being applied more extensively because of the outstanding advantages of multicolor fluorescence analysis. However, the intensity measurement is susceptible to the nonlinearity of the detection method. Moreover, in multicolor analysis, it is impossible to discriminate between fluorophores that spectrally overlap; this influences the accuracy of the fluorescence pulse signal representation. Here, we focus on spectral overlap in two-color analysis, and assume that the fluorescence follows the single exponential decay model. We overcome these problems by analyzing the influence of the spectral overlap quantitatively, which enables us to propose a method of fluorescence pulse signal representation based on time-delay estimation (between fluorescence and scattered pulse signals). First, the time delays are estimated using a modified chirp Z-transform (MCZT) algorithm and a fine interpolation of the correlation peak (FICP) algorithm. Second, the influence of hardware is removed via calibration, in order to acquire the original fluorescence lifetimes. Finally, modulated signals containing phase shifts associated with these lifetimes are created artificially, using a digital signal processing method, and reference signals are introduced in order to eliminate the influence of spectral overlap. Time-delay estimation simulation and fluorescence signal representation experiments are conducted on fluorescently labeled cells. With taking the potentially overlap of autofluorescence as part of the observed fluorescence spectrum, rather than distinguishing the individual influence, the results show that the calculated lifetimes with spectral overlap can be rectified from 8.28 and 4.86 ns to 8.51 and 4.63 ns, respectively, using the comprehensive approach presented in this work. These values agree well with the lifetimes (8.48 and 4.67 ns) acquired for cells stained with single-color fluorochrome. Further, these results indicate that the influence of spectral overlap can be eliminated effectively. Moreover, modulation, mixing with reference signals, and low-pass filtering are performed with a digital signal processing method, thereby obviating the need for a high-speed analog device and complex circuit system. Finally, the flexibility of the comprehensive method presented in this work is significantly higher than that of existing methods.

Keywords: digital signal processing; flow cytometry; fluorescence lifetime; spectrally overlapping signals; time-delay estimation.


Conflict of interest statement

The authors declare no conflict of interest.

Figures

Figure 1
Figure 1
Generation of forward-scattered and fluorescence pulses while microsphere flows through excitation area (fs: forward-scattered pulse, fl1 and fl2: fluorescence pulses of fluorochromes 1 and 2, respectively; L0 and L1: upper and lower limbs of excitation area, respectively).
Figure 2
Figure 2
Schematic of spectral overlap of two fluorescence signals. (a) The green and red areas represent the spectra of the fluorescence light emitted from fluorochromes 1 and 2, respectively. The spectrum of each fluorochrome is detected by a different detector channel having a fixed bandwidth, and the spectra within the bandwidth of each detector channel are detected as one sample point of the time-intensity cytometric pulse; (b) fl1 and fl2 represent the original fluorescence signals (time-intensity pulses); fla and flb represent the observed fluorescence signals after signal crossover; k11 and k12 are components of signal fl1, which contribute to fla and flb; k21 and k22 are components of signal fl2, which contribute to fla and flb; (c) The green and red pulse (time-intensity cytometric pulse) curves are the respective fl1 and fl2 contributions to each detector channel ((k11 × fl1, k12 × fl1) and (k21 × fl2, k22 × fl2), respectively).
Figure 3
Figure 3
Peak-value errors and pulse time delays introduced by three-signal crossover. ΔV1 and ΔV2 represent the differences in the peak values between fla and fl1, and between flb and fl2, respectively. The pulse time-delay details are provided in the yellow region. Δta and Δtb are the pulse time delays of fla and flb (time delays of peak locations between fs and fla, flb) respectively; Δt1 and Δt2 are the pulse time delays of fl1 and fl2 (time delays of peak locations between fs and fl1, fl2), respectively.
Figure 4
Figure 4
Time-delay calibration. (a) Light-pulse generation. The LED1 and LED2 emission lights are blue and red, respectively, and L_fs and L_fl1 are the respective forward-scattered light pulses; (b) L_fs is detected by a photodiode and processed with electric system 0. H0(ω) is the transfer function of electric system 0 in the frequency domain. L_fl1 is detected by a photomultiplier tube (PMT) and processed with electric system 1. H1(ω) is the transfer function of electric system 1 in the frequency domain. Some light intensity attenuation modules are omitted in the detection of L_fl1 with a PMT; (c) Data acquisition. The analog electrical signals (V_fs, V_fl1) are simultaneously converted to digital signals by ADC0 and ADC1, respectively.
Figure 5
Figure 5
Conceptual diagram of signal detection and processing for PTDE-based fluorescence signal representation. The stages against the dark background are processed using the digital signal processing method. The cell stream is excited by the laser beam in the flow chamber, and the forward-scattered (blue arrows) and fluorescence (green and red arrows) signals from the two fluorochromes are separated with a dichroscope and filter in series. fs (blue line) is the forward scattered pulse signal; fla and flb are the observed summation signals from the first and second channels, respectively; Δta and Δtb are the pulse time delays of fla and flb, respectively; τ1 and τ2 are the individual lifetime components of fluorochromes 1 and 2, respectively; ϕ1 and ϕ2 are the phase shifts introduced by τ1 and τ2, respectively; τa and τb are the calculated lifetimes of fla and flb, respectively; and ϕa and ϕb are the respective phase shifts introduced by τa and τb.
Figure 6
Figure 6
Simulation results at each stage during PTDE. (a) Waveforms of fluorescence and forward-scattered pulse signals. The colorized solid and dashed lines are the observed fluorescence signals after crossover and the original fluorescence signals, respectively; (b) The frequency spectra are zoom-analyzed 10 times (N1/N = 10 in Equation (6)) using MCZT; (c) Time domain cross-correlation functions calculated using FICP (N2/N1 = 10 in Equations (8) and (9)).
Figure 7
Figure 7
Gauss fitting results for pulse signals (fs, fla, and flb). (a) The blue and black curves are the pulse signal fs and the Gauss fitting result, respectively; (b) The green and black curves are the observed fluorescence pulse signal fla and the Gauss fitting result, respectively; (c) The red and black curves are the observed fluorescence pulse signal flb and the Gauss fitting result, respectively.
Figure 8
Figure 8
Results of PTDE-based fluorescence signal representation at each stage (see also Figure 3 for each stage of the digital signal processing). (a) Waveforms of forward-scattered pulse signal (fs) and observed fluorescence pulse signals (fla, flb) from a mixture of two spectrally overlapping signals; (b) fla and flb are modulated by a cosine function with different phase shifts (ϕa, ϕb); (c) The modulated fluorescence pulse signal is mixed with a reference signal having the same angular frequency as the modulating signal, after which low-pass filtering of the signals in (c) results in (d).
Figure 9
Figure 9
Lifetime histograms of fluorescence pulse signals at 10-MHz modulating frequency. (a) Histograms of (a) fl1 and (b) fl2 lifetimes (SD: Standard deviation).

Similar articles

Cited by

References

    1. Lakowicz J.R. Principles of Fluorescence Spectroscopy. Springer; Berlin, Germany: 2009.
    1. Ye C., Periasamy A. Characterization of two-photon excitation fluorescence lifetime imaging microscopy for protein location. Microsc. Res. Tech. 2004;63:72–80. - PubMed
    1. Ruofan C., Naivar M.A., Wilder M., Houston J.P. Expanding the potential of standard flow cytometry by extracting fluorescence lifetime form cytometric pulse shifts. Cytom. Part A. 2014;85A:999–1010. - PMC - PubMed
    1. Gohar A.V., Ruofan C., Jenkins P., Li W., Houson K.D. Subcellular location-dependent changes in EGFP fluorescence lifetime measured by time resolved flow cytometry. Biomed. Opt. Express. 2013;4:1930–1940. doi: 10.1364/BOE.4.001390. - DOI - PMC - PubMed
    1. Steinkamp J.A., Crissman H.A. Resolution of fluorescence signals from cells labeled with fluorochromes having different lifetimes by phase-sensitive flow cytometry. Cytometry. 1993;14:210–216. doi: 10.1002/cyto.990140214. - DOI - PubMed