. 2016 Nov 25:6:37772.
doi: 10.1038/srep37772.

Histone deacetylase 1 plays a predominant pro-oncogenic role in Eμ-myc driven B cell lymphoma

Affiliations

Histone deacetylase 1 plays a predominant pro-oncogenic role in Eμ-myc driven B cell lymphoma

Vincent Pillonel et al. Sci Rep. .

Abstract

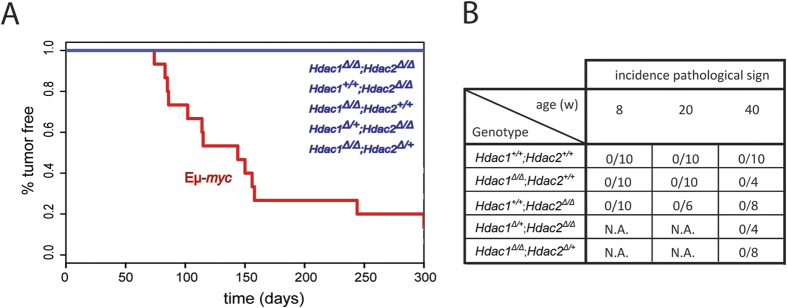
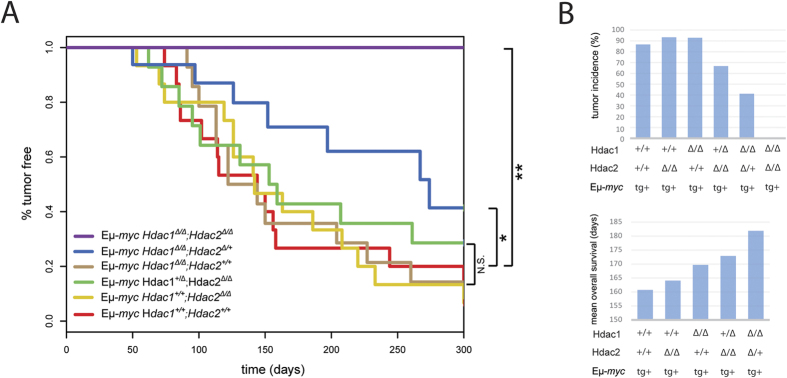
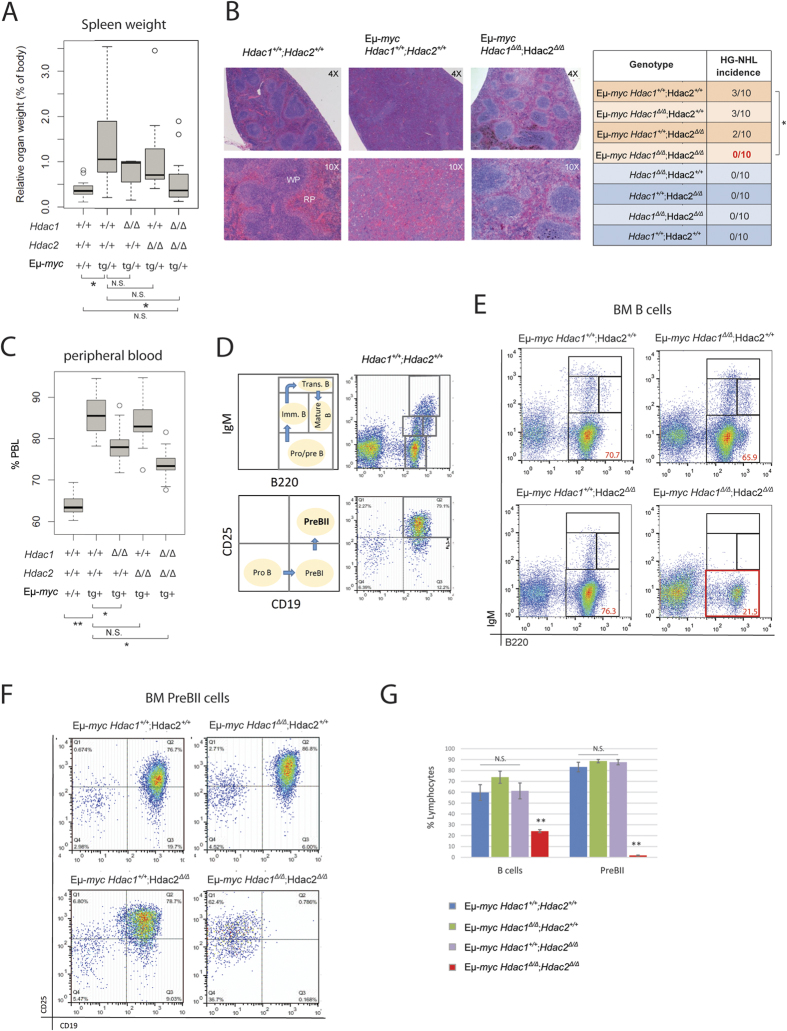
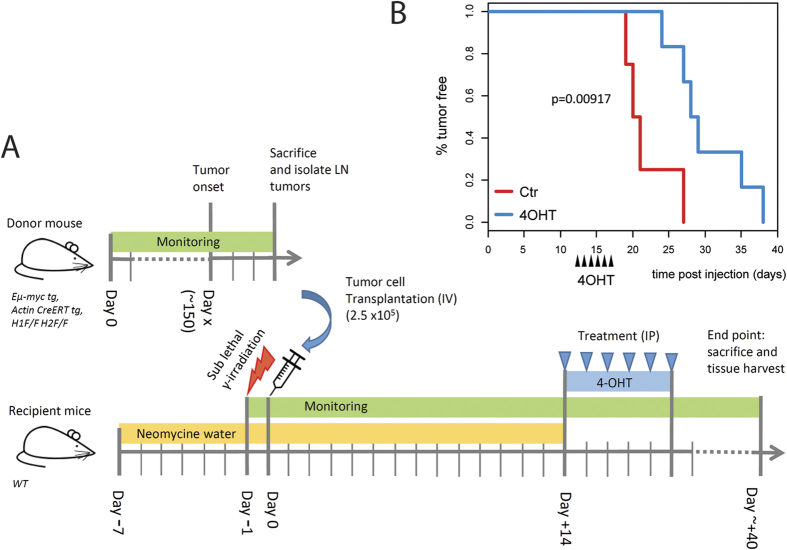
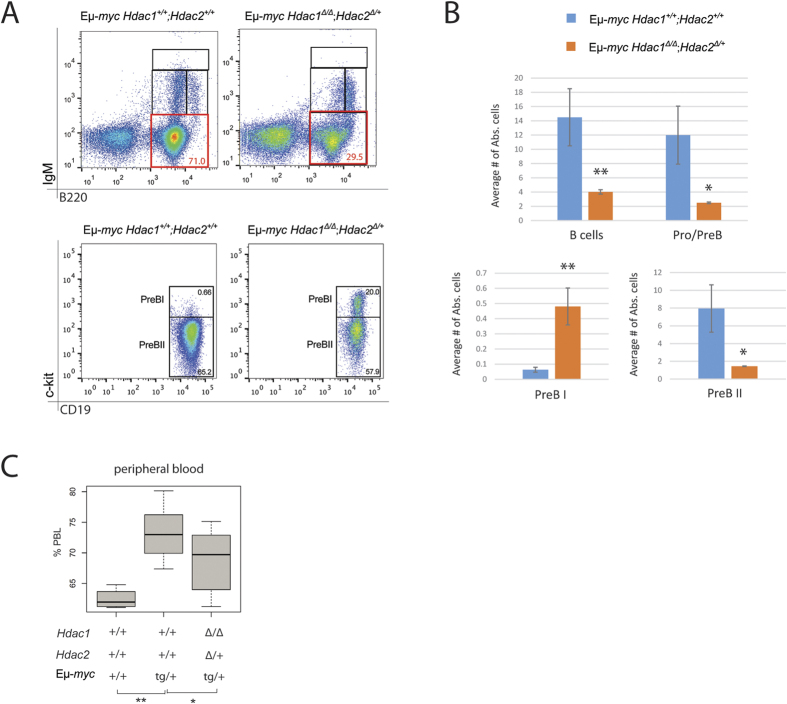
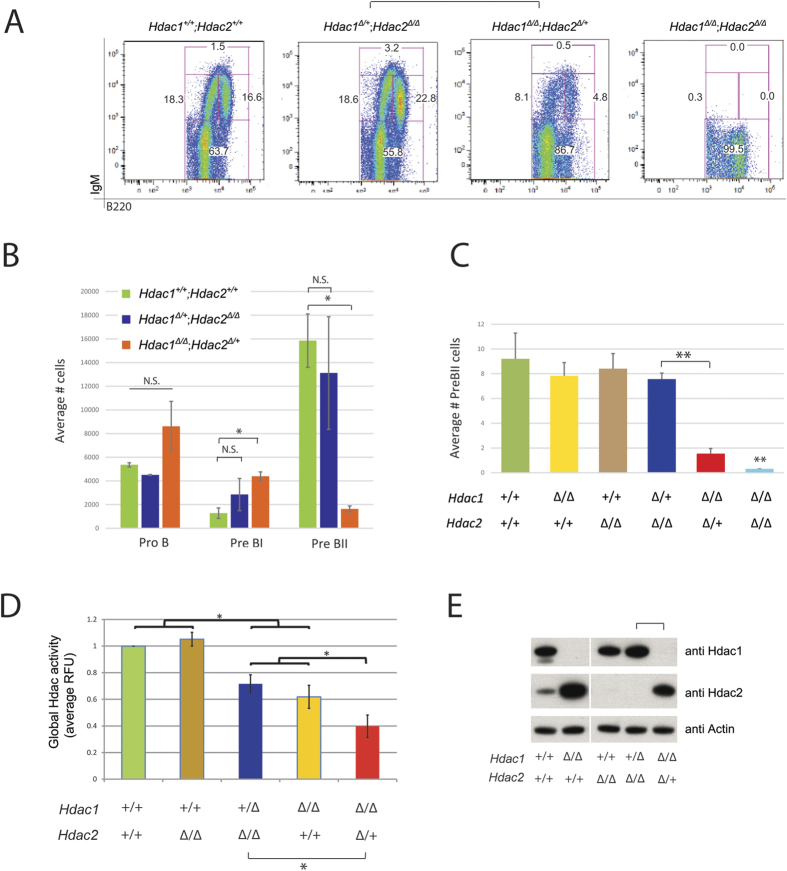
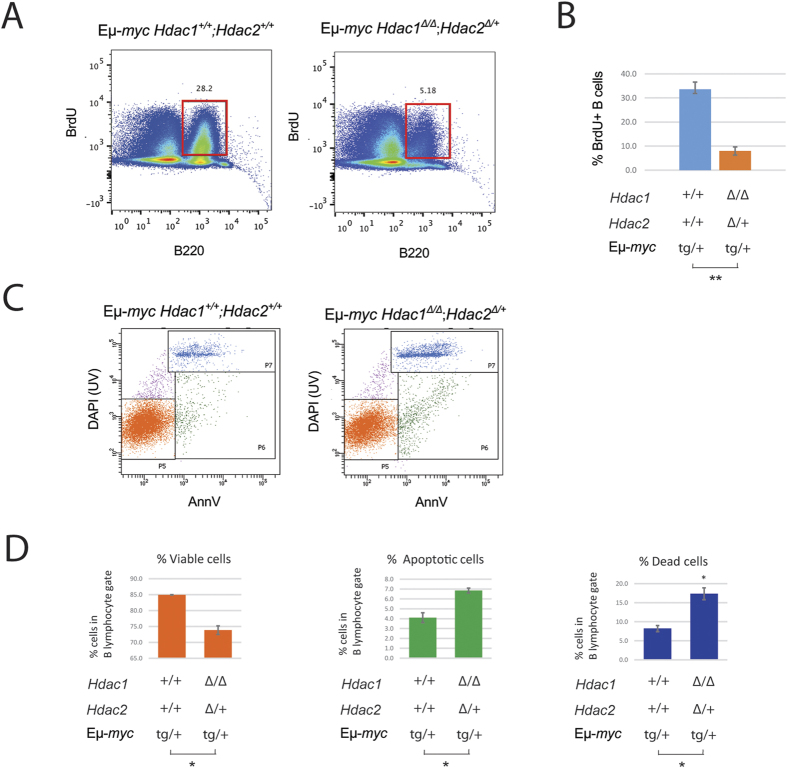
The two histone deacetylases (Hdacs), Hdac1 and Hdac2, are erasers of acetylation marks on histone tails, and are important regulators of gene expression that were shown to play important roles in hematological malignancies. However, several recent studies reported opposing tumor-suppressive or tumor-promoting roles for Hdac1 and Hdac2. Here, we investigated the functional role of Hdac1 and Hdac2 using the Eμ-myc mouse model of B cell lymphoma. We demonstrate that Hdac1 and Hdac2 have a pro-oncogenic role in both Eμ-myc tumorigenesis and tumor maintenance. Hdac1 and Hdac2 promote tumorigenesis in a gene dose-dependent manner, with a predominant function of Hdac1. Our data show that Hdac1 and Hdac2 impact on Eμ-myc B cell proliferation and apoptosis and suggest that a critical level of Hdac activity may be required for Eμ-myc tumorigenesis and proper B cell development. This provides the rationale for utilization of selective Hdac1 and Hdac2 inhibitors in the treatment of hematological malignancies.


Figures

Figure 1
Figure 1. Hdac1 and Hdac2 have no tumor suppressor function in B cells.
(A) KPLM tumor-free survival curves for 15 age-matched mice are shown with indicated genotypes. Eμ-myc tg mice are shown as control. Mice were monitored over a period of 300 days for tumor onset and sacrificed when they reached termination criteria (see Material and Methods). (B) Table summarizing histopathological analysis from spleen and lymph nodes of Hdac1 and/or Hdac2 KO mice with indicated genotypes at 8, 20, and 40 weeks. n = 4–10 as indicated, N.A. for not analyzed.
Figure 2
Figure 2. Eμ-myc tumorigenesis is Hdac1 and Hdac2 gene dose-dependent.
(A) Kaplan-Meier tumor-free survival curves are shown for 15 age-matched mice with indicated genotypes. The log-rank test was used to determine the level of significance between curves in the KPLM plots. Significant differences between genotypes are indicated, *p < 0.05; **p < 0.01. N.S., not statistically significant. (B) Tumor incidence (%; upper panel), and mean overall survival (days; lower panel), according to indicated Hdac1 and Hdac2 genotypes. Bar plots show values extracted from panel A.
Figure 3
Figure 3. Complete Hdac1 and Hdac2 ablation prevents Eμ-myc tumorigenesis.
All experiments were performed in 8-week-old mice. (A) Boxplot shows relative spleen weight (% of body weight) of mice with indicated genotypes. p-values were generated using Wilcoxon Signed-Rank Test (n = 11). (B) Representative pictures from histopathological analysis of hematoxylin and eosin stained spleen sections of Eμ-myc mice with indicated genotypes and healthy Hdac1+/+; Hdac2+/+ control. Original magnification of 4X and 10X as indicated (left panel). Pathological findings of HG-NHL were scored in spleen and lymph nodes and summarized (table, right panel, n = 10). p-value was calculated using Student unpaired 2-tailed t test. (C) Blood analysis with automated blood analyzer. Percentage (%) of PBL of indicated genotypes (n ≥ 10). p-value calculated with Wilcoxon Signed-Rank Test. (D–F) Eμ-myc BM cells from mice with indicated genotypes were stained with B cell surface marker-specific antibodies, including B220, IgM, CD19 and CD25, and analyzed by flow cytometry. (D) Schematic representation of wild-type BM profile: B220/IgM to distinguish between Pro/preB (B220+; IgM), immatureB (B220low; IgM+), transitional B (B220+; IgM+) and mature B (B220high; IgM+) cells (upper panels). CD19/CD25 to identify PreBII cell subset (B220+;CD19+; CD25+; lover panels). (E) Representative flow cytometry dot plots of B220/IgM staining gated on total BM lymphocytes. Gated regions indicate B cell subsets of interest with frequency in percent. (F) Representative flow cytometry dot plots showing PreBII lymphocytes subsets. (G) Quantification of flow cytometry analysis from (E,F; n = 4–6 biological replicates). Average percentage of B cells (B220+) and PreBII cells represented with s.e.m. Statistical analysis was performed with Student unpaired 2-tailed t test. Significant differences in means between genotypes are indicated, *p < 0.05; **p < 0.01. N.S., not statistically significant.
Figure 4
Figure 4. Conditional ablation of Hdac1 and Hdac2 in Eμ-myc tumor cells delays tumor appearance in vivo.
(A) Experimental workflow scheme for transplantation experiments. Wild-type syngeneic recipient mice were sub-lethally irradiated (350 cGy of whole-body γ-irradiation) and transplanted intra-venously with lymph node-derived tumor cells from Hdac1F/F; Hdac2F/F; Actin-creER tg; Eμ-myc tg mice after development of overt malignancy. Recipient mice were treated with neomycin-supplemented drinking water 1 week before transplantation and up to 2 weeks post transplantation. At two weeks post transplantation, conditional KO was induced in one group of mice by intraperitoneal injection of 4-hydroxytamoxifen (4-OHT, 5 × 2 mg). Control mice were injected with vehicle. Mice were monitored for tumor onset and sacrificed when they reached termination criteria (see Material and Methods). (B) KPLM tumor-free survival curves of mice transplanted with tumor cells and treated with 4-OHT (n = 6) or vehicle (Ctr, n = 4) are shown. Survival is plotted as days post transplantation. The log-rank test was used to determine the level of significance between curves in the two groups.
Figure 5
Figure 5. Hdac1Δ/Δ; Hdac2Δ/+ Eμ-myc mice have delayed tumorigenesis.
All experiments were performed in 8-week-old lymphoma-free mice. (A,B) BM cells obtained from 8-week old Eμ-myc mice with indicated genotypes were stained with B cell surface marker-specific antibodies, including B220, IgM, CD19 and c-kit, and analyzed by flow cytometry (representative dot plots are shown). (A) Representative flow cytometry dot plots gated on total BM lymphocytes. Gated regions indicate B cell subsets of interest with frequency in percent. Pro/preB cell subset (B220+; IgM) is indicated (red gate, upper panels). Gated PreBI (B220+; c-kit+; CD19+) and PreBII (B220+; CD19+; c-kit) cell populations are indicated (lower panels). (B) Quantification of flow cytometry analysis with s.e.m. (n = 3 biological replicates). Average percentage of B cells (B220+) and Pro/PreB cells (upper plots), and PreBI and PreBII (lower plots). Statistical analysis was performed with Student unpaired 2-tailed t test. (C) Blood was analyzed with automated blood analyzer. Shown are box plots with frequency (%) of PBL from indicated genotypes (n = 10). p-value calculated with the Wilcoxon Signed-Rank Test. Significant differences are indicated, *p < 0.05; **p < 0.01. N.S., not statistically significant.
Figure 6
Figure 6. Hdac1 has a predominant role in non-malignant B cells.
All experiments were performed in 8-week-old animals. (A) Representative flow cytometry dot plots of B220/IgM staining, gated on B220+ lymphocytes derived from BM of mice with indicated genotypes. Gated regions in dot plots indicate B cell subsets of interest with frequency in percent: Pro/preB (B220+; IgM), ImmatureB (B220low; IgM+), Transitional B (B220+; IgM+) and mature B (B220high; IgM+) cells. (B) Quantification of flow cytometry analysis shown in (A). Bar plots represent average numbers of cells (gated 50,000 lymphocytes) from the different B lymphocyte subsets in the BM. (C) Quantification of flow cytometry analysis shown in (A). Average numbers of absolute PreBII cells. (D) Global Hdac-activity assay performed in CD19+ MACS sorted B cells from BM of mice with indicated genotypes. Values are shown in Relative Fluorescence Units (RFU) relative to control Hdac1+/+; Hdac2+/+ cells. (E) Immunoblot analysis of Hdac1 and Hdac2 expression, and actin as loading control from CD19+ MACS sorted splenic B cells derived from mice with indicated genotypes. The cropped blots originate from a single blot for each protein. The full-length blots are presented in Supplementary Figure 7. All graphs represent mean ± s.e.m. from 3 mice of each genotype. Statistical analysis with Student unpaired 2-tailed t test, *p < 0.05; **p < 0.01. N.S., not statistically significant.
Figure 7
Figure 7. Hdac1Δ/Δ; Hdac2Δ/+ impact on proliferation and apoptosis.
Experiments were performed in 8-week-old lymphoma-free mice. (A,B) Proliferation analysis by flow cytometry from BM B cells of mice with indicated genotypes injected with BrdU. (A) Representative flow cytometry dot plots from indicated genotypes. Gated regions indicate B220+; BrdU+ cycling B cells with frequency in percent. (B) Quantification from flow cytometry analysis with mean and s.e.m. of BrdU-positive B cells is shown. (C,D) BM cells isolated from Hdac1+/+; Hdac2+/+ and Hdac1Δ/Δ; Hdac2Δ/+ Eμ-myc mice and stained with Annexin V, DAPI and B cell surface markers for flow cytometry analysis. (C) Representative flow cytometry dot plots from apoptosis assay: viable B cells (P5; annexinV DAPI), apoptotic B cells (P6; annexinV+ DAPI) cells, and dead cells (P7; annexinV+ DAPI+). (D) Quantification of figure (C). Mean percentages and standard deviations are shown. All statistical analysis were performed with the Student unpaired 2-tailed t test. Significant differences in means between genotypes are indicated, *p < 0.05.

References

    1. Reichert N., Choukrallah M. A. & Matthias P. Multiple roles of class I HDACs in proliferation, differentiation, and development. Cellular and molecular life sciences: CMLS 69, 2173–2187, doi: 10.1007/s00018-012-0921-9 (2012). - DOI - PMC - PubMed
    1. Dawson M. A. & Kouzarides T. Cancer epigenetics: from mechanism to therapy. Cell 150, 12–27, doi: 10.1016/j.cell.2012.06.013 (2012). - DOI - PubMed
    1. Jenuwein T. & Allis C. D. Translating the histone code. Science (New York, N.Y.) 293, 1074–1080, doi: 10.1126/science.1063127 (2001). - DOI - PubMed
    1. Choudhary C. et al. Lysine acetylation targets protein complexes and co-regulates major cellular functions. Science (New York, N.Y.) 325, 834–840, doi: 10.1126/science.1175371 (2009). - DOI - PubMed
    1. Glozak M. A., Sengupta N., Zhang X. & Seto E. Acetylation and deacetylation of non-histone proteins. Gene 363, 15–23, doi: 10.1016/j.gene.2005.09.010 (2005). - DOI - PubMed

Publication types