. 2016 Nov 25:6:37792.
doi: 10.1038/srep37792.

An evolutionary conserved interaction between the Gcm transcription factor and the SF1 nuclear receptor in the female reproductive system

Affiliations

An evolutionary conserved interaction between the Gcm transcription factor and the SF1 nuclear receptor in the female reproductive system

Pierre B Cattenoz et al. Sci Rep. .

Abstract

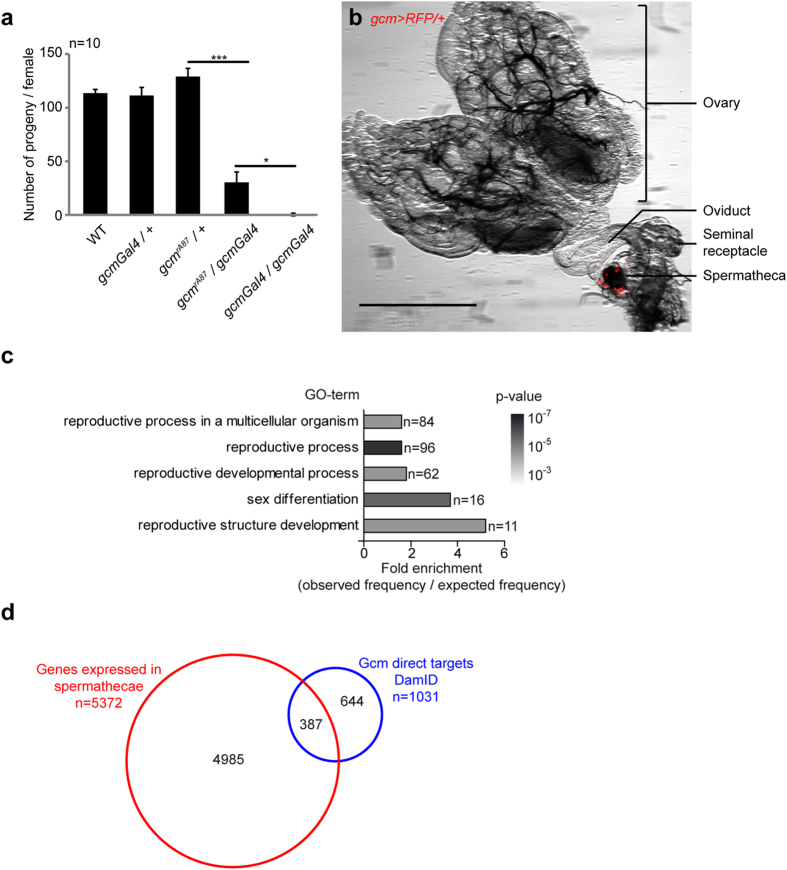
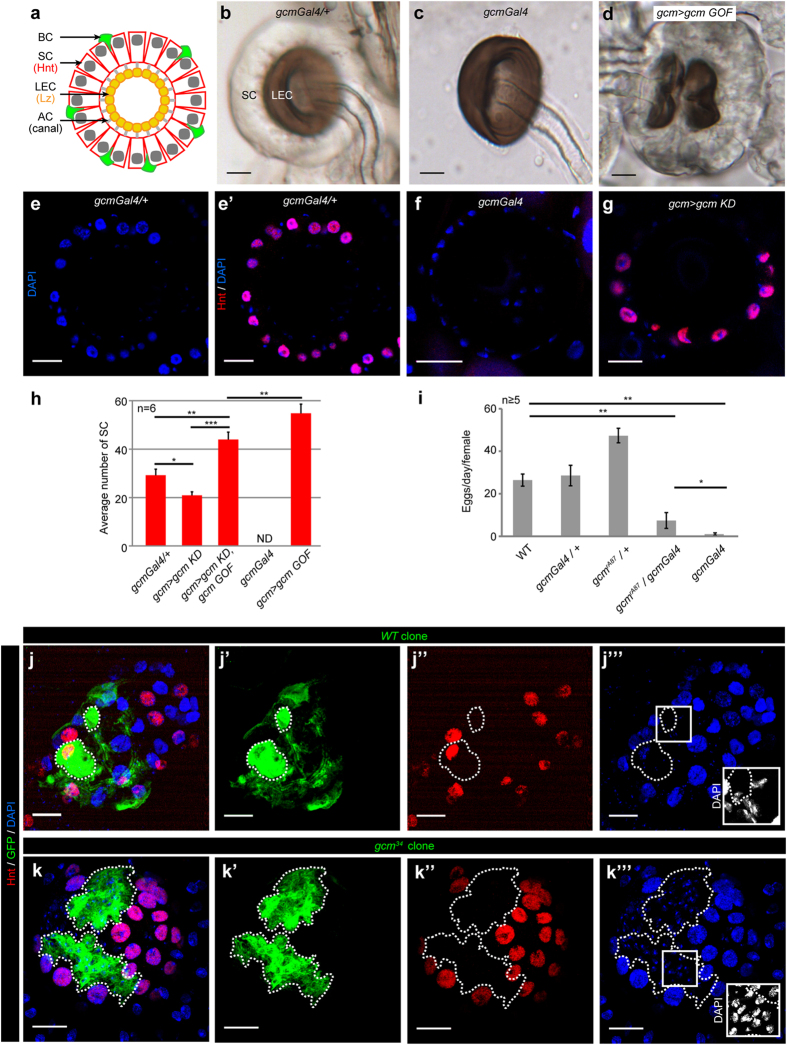
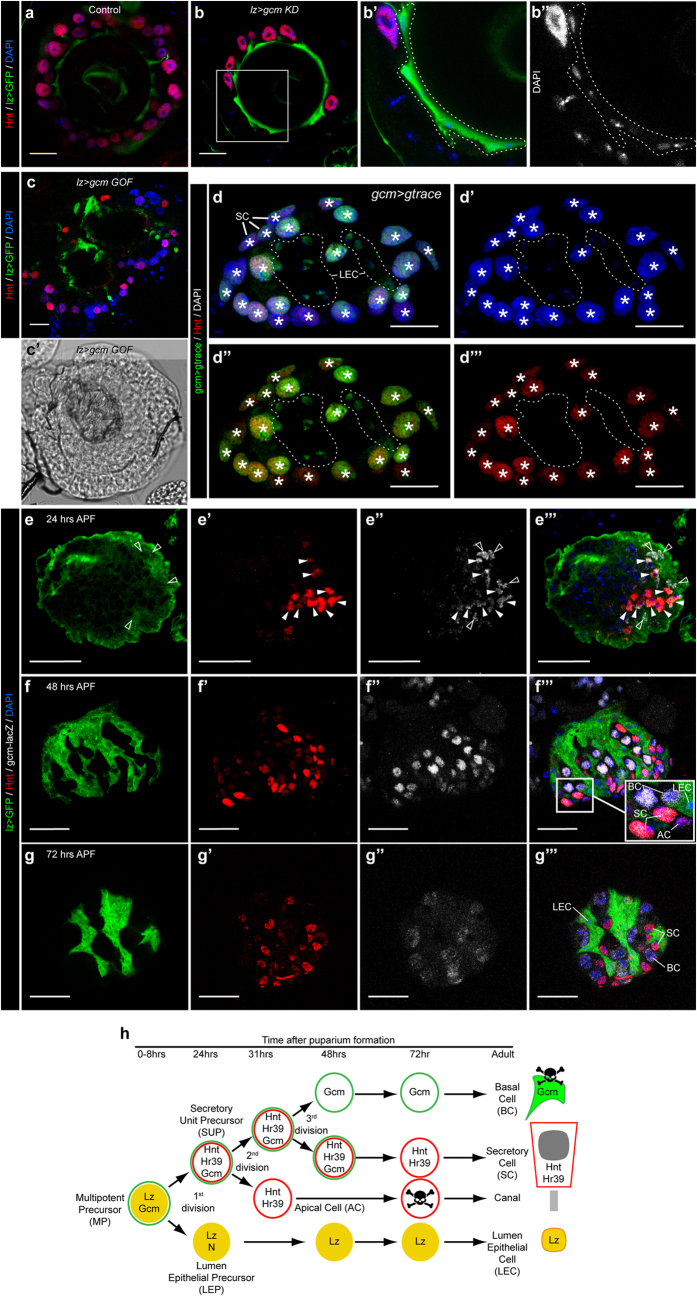
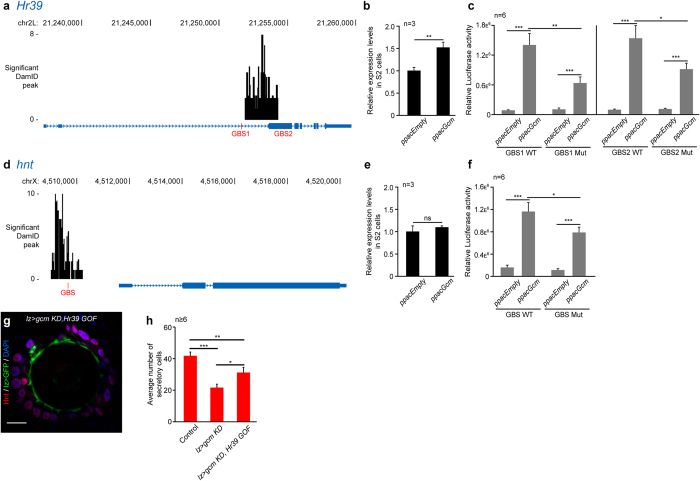
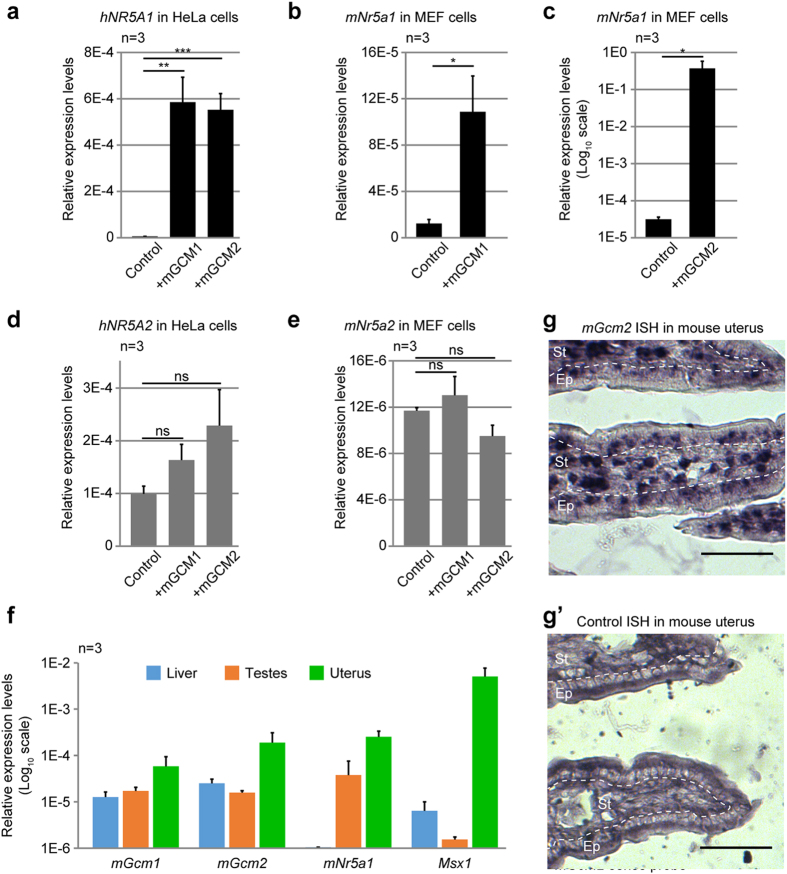
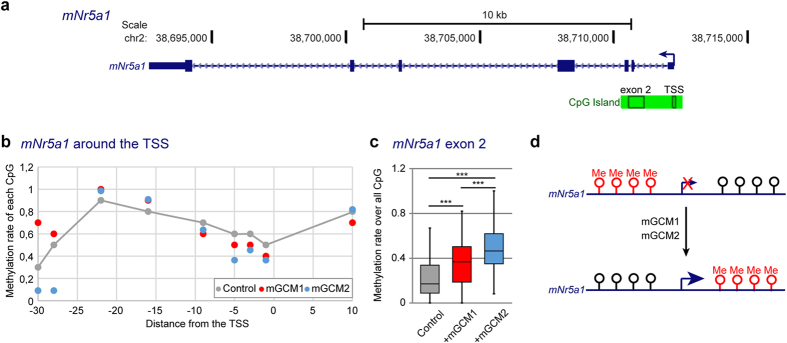
NR5A1 is essential for the development and for the function of steroid producing glands of the reproductive system. Moreover, its misregulation is associated with endometriosis, which is the first cause of infertility in women. Hr39, the Drosophila ortholog of NR5A1, is expressed and required in the secretory cells of the spermatheca, the female exocrine gland that ensures fertility by secreting substances that attract and capacitate the spermatozoids. We here identify a direct regulator of Hr39 in the spermatheca: the Gcm transcription factor. Furthermore, lack of Gcm prevents the production of the secretory cells and leads to female sterility in Drosophila. Hr39 regulation by Gcm seems conserved in mammals and involves the modification of the DNA methylation profile of mNr5a1. This study identifies a new molecular pathway in female reproductive system development and suggests a role for hGCM in the progression of reproductive tract diseases in humans.


Figures

Figure 1
Figure 1. Gcm is expressed in the spermatheca and controls fertility.
(a) Fertility assays carried out on gcm hypomorphs. The histogram shows the average number of progenies per female of the following genotypes: wild type (WT), gcmGal4/+ and gcmrA87/+, which represent the control strains, as well as gcmGal4/gcmrA87 and gcmGal4/gcmGal4, which represent gcm hypomorphic conditions. Ten crosses were made per genotype (n = 10). The error bars represent standard errors of the mean (s.e.m.). Student test was used to calculate the p-values: >0.05 = ns; <0.05–0.01 <= *; <0.01–0.001 <= **; <0.001 = ***. (b) Reproductive system of an adult control female (gcmGal4/+;UAS-RFP). Overlay of the images taken with white light and by epifluorescence (561nm). The scale bar represents 500 μm. (c) GO-term enrichment analysis of the genes directly targeted by Gcm according to a DamID screen. The histogram represents the fold enrichments obtained for GO-terms linked to reproduction (enrichment >1.5, FDR <2%, p-value < 10−3), n = number of genes. (d) Overlap between the direct targets of Gcm according to a DamID screen (blue) and the genes expressed in spermatheca according to a spermatheca transcriptome.
Figure 2
Figure 2. Gcm is involved in the development of the secretory cells of the spermatheca.
(a) Schematic representation of an adult spermatheca cross-section. The SC express Hindsight (Hnt) and the LEC Lozenge (Lz). (b–d) Spermathecae analysed by bright-field microscopy. The spermathecae were dissected from adult females (1 to 3-day-old) gcmGal4/+ (control) (b), gcmGal4 (c), and gcmGal4/+;UAS-gcm/+ (gcm > gcm GOF) (d). Unless otherwise specified, all scale bars here and in the following figures represent 20 μm. (e–g) Single optical sections of spermathecae analysed by confocal microscopy from adult females of the following genotypes: gcmGal4/+ (e,e’), gcmGal4 (f) and gcmGal4/+;UAS-gcmRNAi/+ (gcm > gcm KD) (g) labelled with anti-Hnt (Hnt, in red) and DAPI (blue). (e) and (e’) represent the DAPI and the overlap of DAPI and anti-Hnt labelling of the gcmGal4/+ spermatheca, respectively. (h) Average number of secretory cells counted in cross-sections of adult spermathecae of the indicated genotypes (see materials and methods). At least 6 spermathecae were analysed per genotype, the error bars and p-values are as described for Fig. 1a. (i) Number of eggs laid per female and per day for the indicated genotypes. At least five replicates were made per genotype. (j–k”’) MARCM clonal analysis in a gcm mutant background. The images represent full projections of spermathecae analysed by confocal microscopy from adult females showing WT (j–j”’) or gcm34 mutant (k–k”’) clones. The spermathecae were labelled with anti-GFP (the clones express GFP, in green), anti-Hnt (Hnt, in red) and DAPI (blue) (j,k), the clones are indicated by dashed lines. Each marker is shown individually in (j’ and k’) for anti-GFP, (j” and k”) for anti-Hnt and (j”’ and k”’) for DAPI. The insets in (j”’ and k”’) show a higher magnification of the nuclei with the DAPI in grey. See also Supplemental Figures S2 and S4.
Figure 3
Figure 3. Gcm is expressed early in the secretory cell precursor to initiate the differentiation of the secretory cell.
(a–c) Single confocal sections of spermathecae from adult females (1 to 3-day-old) lzGal4,UAS-mCD8GFP/+ (control) (a), lzGal4,UAS-mCD8GFP/+;UAS-gcmRNAi (lz > gcm KD) (b) and lzGal4,UAS-mCD8GFP/+;UAS-gcm (lz > gcm GOF) (c) labelled with anti-GFP (lz > GFP, in green), anti-Hnt (Hnt, in red) and DAPI (blue). The region indicated by the white square in (b) is magnified in (b’) and (b”), in which the LEC are indicated by a dashed line. DAPI is in grey in (b”). (c’) Bright-field image of a lz > gcm GOF spermatheca. (d–d”’) Confocal projection of a gcmGal4/+;g-trace/+ (gcm > g-trace) adult spermatheca labelled with anti-Hnt (Hnt, in red), anti-GFP (gcm > g-trace, in green) and DAPI (blue). (d) represents the overlay of anti-Hnt, anti-GFP and DAPI, (d’) shows the DAPI labelling, (d”) Gcm lineage and Hnt and (d”’) anti-Hnt. The white asterisks indicate the SC and the LEC are indicated by a dashed line. (e–g”’) Confocal projections of lzGal4,UAS-mCD8GFP/+;gcmrA87/+ pupal spermathecae labelled with anti-βgal (gcm-lacZ, in grey), anti-Hnt (Hnt, in red), anti-GFP (lz > GFP, in green) and DAPI (blue). The images were taken at 28 hrs after puparium formation (APF) (e–e”’), 48 hrs APF (f–f”’) and 72 hrs APF (g–g”’). Each marker is shown individually in (eg) for anti-GFP, (e’,f’,g’) for anti-Hnt, (e”,f”,g”) for anti-βgal and the overlay of the three channels and DAPI is shown in (e”’,f”’,g”’). The white arrowheads indicate cells expressing Gcm and Hnt, which correspond to the SUP, the empty arrowheads indicate cells expressing Lz and Gcm, which correspond to the MP (e–e”’). The inset (in f”’) shows SC expressing Hnt and low levels of Gcm, BC expressing high levels of Gcm, an AC expressing Hnt only and an LEC expressing Lz. (h) Schematic representation of spermatheca development (modified from ref. 15). The time scale is indicated above the schematic in hours APF. The yellow circles indicate Lz expression, the red circles Hnt and the green circles Gcm expression. The skull pictograms indicate the cells undergoing apoptosis. See also Figure S3.
Figure 4
Figure 4. Gcm induces the expression of Hr39 and Hnt.
(a,d) Hr39 (a) and hnt (d) loci in the Drosophila genome (blue rectangles for exons, blue lines for the introns, the arrowheads indicate the orientation). The canonical Gcm binding sites (GBS) are indicated in red and the black histograms indicate the regions targeted by Gcm. (b,e) Expression levels of Hr39 (b) and hnt (e) measured by qPCR assays in S2 cells transfected with an empty vector (ppacEmpty) or with a vector expressing Gcm (ppacGcm). The levels are relative to those observed upon transfecting the ppacEmpty vector. (c,f) Luciferase assays carried out in S2 cells transfected with ppacEmpty or with ppacGcm and with luciferase vectors carrying the regions covering WT (GBS1 WT and GBS2 WT) or mutated GBS (GBS1 Mut and GBS2 Mut) at the Hr39 locus (c) and the WT or mutated GBS present at the hnt locus (f). (g) Single confocal section of lzGal4,UAS-mCD8GFP/+;UAS-gcmRNAi,UAS-Hr39 (lz > gcm KD,Hr39 GOF) spermatheca from adult female labelled with anti-GFP (lz > GFP, green), anti-Hnt (Hnt, in red) and DAPI (blue). (h) Average number of SC counted in cross-sections of spermathecae of the indicated genotypes. The gcm KD and the gcm KD,Hr39 GOF were driven by lzGal4. The error bars and p-values (b,c,e,f and h) are as described for Fig. 1a. n indicates the number of assays.
Figure 5
Figure 5. The mGCM proteins induce the expression of the Hr39 ortholog in mammals.
(a,d) Expression levels of hNR5A1 (in black (a)) and hNR5A2 (in grey (d)) in HeLa cells transfected with an empty vector (Control), an expression vector for mGCM1 (+mGCM1) or an expression vector for mGCM2 (+mGCM2), measured by qPCR. (b,c,e) Expression levels of mNr5a1 (in black, (b,c) and mNr5a2 (in grey, (e)) in MEF cells transfected with an empty vector (Control) or with an expression vectors for mGCM1 or mGCM2, measured by qPCR. The y-axis is in log10 scale in (c) and the error bars and p-values are as described for Fig. 1a. n indicates the number of assays. (f) Expression levels of mGcm1, mGcm2, mNr5a1 and that of the transcription factor Msx1 in mouse liver, testes and uterus measured by qPCR. The levels are relative to the house-keeping genes Actb and Gapdh. Each experiment was carried out on three mice. The error bars represent s.e.m. and the y-axis is in log10 scale. (g,g’) In situ hybridisation on adult mouse uterus section targeting mGcm2 using anti-sense mGcm2 probe (g) and negative control using the sense mGcm2 probe (g’). Scale bar represents 50 μm, the stroma (St) of the endometrium corresponds to the area indicated by a dashed line and Ep indicates the columnar epithelium.
Figure 6
Figure 6. mGCM1 and mGCM2 regulate the methylation profile of mNr5a1.
(a) Schematic representation of the mNr5a1 locus in the mouse genome. The gene is represented as in Fig. 4a. The genomic coordinates of the locus (genome version mm10) are indicated above the gene. The CpG island is highlighted in green, the rectangles within the CpG island indicate the analysed regions in exon 2 and at TSS. (b) Methylation rate for each CpG 30 nucleotides before the TSS and 10 nucleotides after the TSS. The methylation rate in MEF transfected with an empty vector (Control) is indicated in grey, the methylation rate in MEF transfected with an expression vector for mGCM1 is in red and for mGCM2 in blue. Dots above the grey line indicate CpG hypermethylation and dots below indicate CpG hypo-methylation compared to the control cells. (c) Box plot representing the distribution of the methylation rate in the CpG island of mNr5a1 in MEF cells transfected with an empty vector (Control), an expression vector for mGCM1 (+mGCM1) or for mGCM2 (+mGCM2)). The methylation rates were measured for the 51 CpG contained in the exon 2 area highlighted in (a) using bisulfite sequencing. The p-values were estimated using paired student test (see materials and methods) and are represented as described in Fig. 1a. (d) Schematic representation of the impact of the mGCM protein family on the DNA methylation profile of mNr5a1.

Similar articles

Cited by

References

    1. Suarez S. S. & Pacey A. A. Sperm transport in the female reproductive tract. Hum Reprod Update 12, 23–37, doi: 10.1093/humupd/dmi047 (2006). - DOI - PubMed
    1. Scott M. A. A glimpse at sperm function in vivo: sperm transport and epithelial interaction in the female reproductive tract. Anim Reprod Sci 60, 337–348, doi: 10.1016/S0378-4320(00)00130-5 (2000). - DOI - PubMed
    1. Varner D. D. Odyssey of the spermatozoon. Asian J Androl 17, 522–528, doi: 10.4103/1008-682x.153544 (2015). - DOI - PMC - PubMed
    1. Suarez S. S. Mammalian sperm interactions with the female reproductive tract. Cell Tissue Res 363, 185–194, doi: 10.1007/s00441-015-2244-2 (2016). - DOI - PMC - PubMed
    1. Wilcox A. J., Weinberg C. R. & Baird D. D. Timing of sexual intercourse in relation to ovulation. Effects on the probability of conception, survival of the pregnancy, and sex of the baby. N Engl J Med 333, 1517–1521, doi: 10.1056/NEJM199512073332301 (1995). - DOI - PubMed

Publication types

LinkOut - more resources