

Immune modulation of CD4+CD25+ regulatory T cells by zoledronic acid
- PMID: 27887569
- PMCID: PMC5124310
- DOI: 10.1186/s12865-016-0183-7
Immune modulation of CD4+CD25+ regulatory T cells by zoledronic acid
Abstract
Background: CD4+CD25+ regulatory T (Treg) cells suppress tumor immunity by inhibiting immune cells. Manipulation of Treg cells represents a new strategy for cancer treatment. Zoledronic acid (ZA), a nitrogen-containing bisphosphonate, inhibits the expression of receptor activator of nuclear factor kappa-B ligand (RANKL) on osteoblasts to inhibit osteoclastogenesis. In a mouse model of bisphosphonate-related osteonecrosis of the jaw, administration of ZA suppressed Treg-cell activity and activated inflammatory Th17 cells. However, the interaction between ZA and Treg cells remained unclear. This study investigated the immune modulation of Treg cells by ZA.
Methods: Flow cytometry was used to analyze the phenotypic and immunosuppressive characteristics of Treg cells treated with ZA. Chemotactic migration was evaluated using transwell assays. Quantitative real-time PCR (qRT-PCR) was used to investigate the effect of ZA on the expression of suppressive molecules by Treg cells.
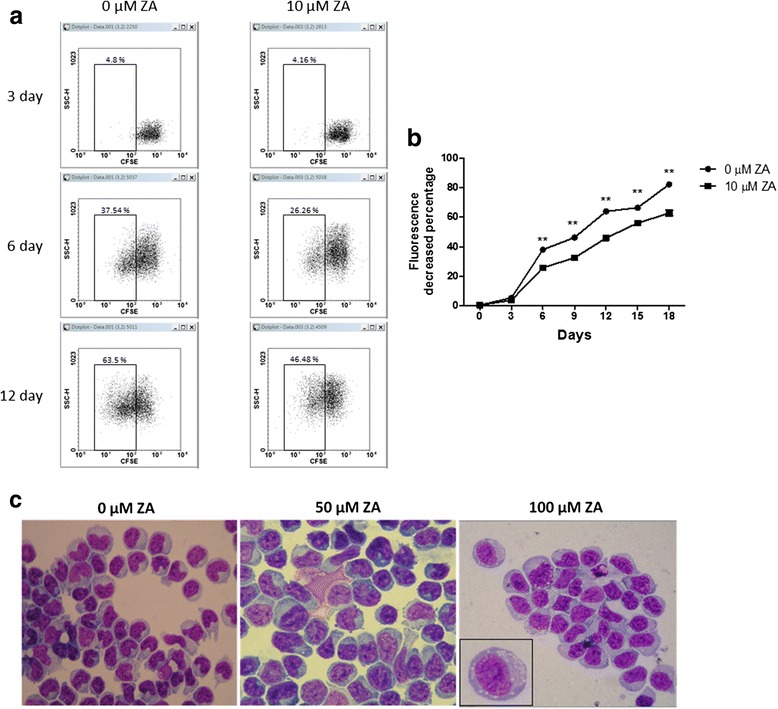
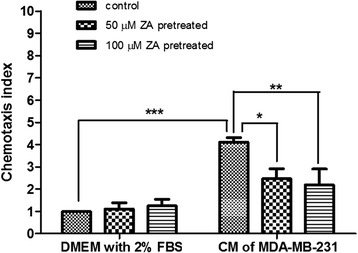
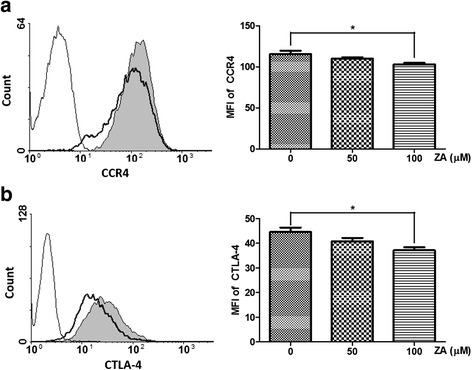
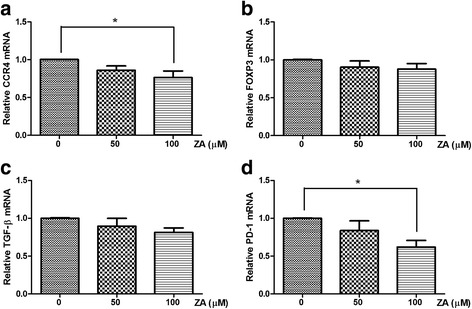
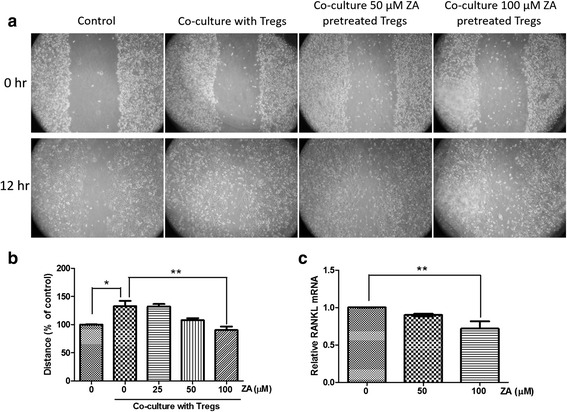
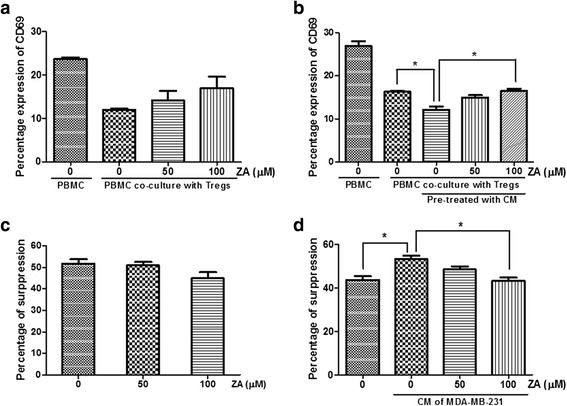
Results: Proliferation of isolated Treg cells in culture was inhibited by ZA, although ZA did not induce apoptosis. qRT-PCR and flow cytometry showed that ZA significantly downregulated the expression of CCR4, CTLA4, PD-1 and RANKL on Treg cells. Chemotactic migration and immunosuppressive functions were also significantly attenuated in Treg cells pretreated with ZA, and these effects were dose-dependent. Co-culture with Treg cells significantly increased the migration rate of breast cancer cells, while pretreatment of Treg cells with ZA attenuated this effect.
Conclusions: Our findings demonstrated that ZA acted as an immune modulator by significantly inhibiting the expansion, migration, immunosuppressive function and pro-metastatic ability of Treg cells. Immunomodulation of Treg cells by ZA represents a new strategy for cancer therapy.
Keywords: Breast cancer; Immunomodulation; Regulatory T cells; Zoledronic acid.
Figures
Similar articles
-
Zoledronic acid blocks the interaction between breast cancer cells and regulatory T-cells.BMC Cancer. 2019 Feb 26;19(1):176. doi: 10.1186/s12885-019-5379-9. BMC Cancer. 2019. PMID: 30808421 Free PMC article.
-
Synergistic suppression of human breast cancer cells by combination of plumbagin and zoledronic acid In vitro.Acta Pharmacol Sin. 2015 Sep;36(9):1085-98. doi: 10.1038/aps.2015.42. Epub 2015 Aug 3. Acta Pharmacol Sin. 2015. PMID: 26235741 Free PMC article.
-
Pretreatment with Bisphosphonate Enhances Osteogenesis of Bone Marrow Mesenchymal Stem Cells.Stem Cells Dev. 2017 Jan 15;26(2):123-132. doi: 10.1089/scd.2016.0173. Epub 2016 Oct 12. Stem Cells Dev. 2017. PMID: 27736364
-
Clinical use of anti-CD25 antibody daclizumab to enhance immune responses to tumor antigen vaccination by targeting regulatory T cells.Ann N Y Acad Sci. 2009 Sep;1174:99-106. doi: 10.1111/j.1749-6632.2009.04939.x. Ann N Y Acad Sci. 2009. PMID: 19769742 Review.
-
Regulatory T (Treg) cells in cancer: Can Treg cells be a new therapeutic target?Cancer Sci. 2019 Jul;110(7):2080-2089. doi: 10.1111/cas.14069. Epub 2019 Jun 18. Cancer Sci. 2019. PMID: 31102428 Free PMC article. Review.
Cited by
-
Zoledronic acid inhibits NFAT and IL-2 signaling pathways in regulatory T cells and diminishes their suppressive function in patients with metastatic cancer.Oncoimmunology. 2017 Jun 14;6(8):e1338238. doi: 10.1080/2162402X.2017.1338238. eCollection 2017. Oncoimmunology. 2017. PMID: 28920001 Free PMC article.
-
Oestrogen and zoledronic acid driven changes to the bone and immune environments: Potential mechanisms underlying the differential anti-tumour effects of zoledronic acid in pre- and post-menopausal conditions.J Bone Oncol. 2020 Sep 15;25:100317. doi: 10.1016/j.jbo.2020.100317. eCollection 2020 Dec. J Bone Oncol. 2020. PMID: 32995253 Free PMC article. Review.
-
Structural insights into the binding of zoledronic acid with RANKL via computational simulations.Front Mol Biosci. 2022 Sep 19;9:992473. doi: 10.3389/fmolb.2022.992473. eCollection 2022. Front Mol Biosci. 2022. PMID: 36200071 Free PMC article.
-
Mechanism exploration of Zoledronic acid combined with PD-1 in the treatment of hepatocellular carcinoma.Cancer Immunol Immunother. 2024 Mar 2;73(4):62. doi: 10.1007/s00262-024-03652-2. Cancer Immunol Immunother. 2024. PMID: 38430249 Free PMC article.
-
Association between bisphosphonate use and COVID-19 related outcomes.Elife. 2023 Aug 3;12:e79548. doi: 10.7554/eLife.79548. Elife. 2023. PMID: 37534876 Free PMC article.
References
-
- Wilke CM, Wu K, Zhao E, Wang G, Zou W. Prognostic significance of regulatory T cells in tumor. Int J Cancer. 2010;127(4):748–758. - PubMed
-
- Liu F, Li Y, Ren M, Zhang X, Guo X, Lang R, Gu F, Fu L. Peritumoral FOXP3(+) regulatory T cell is sensitive to chemotherapy while intratumoral FOXP3(+) regulatory T cell is prognostic predictor of breast cancer patients. Breast Cancer Res Treat. 2012;135(2):459–467. doi: 10.1007/s10549-012-2132-3. - DOI - PubMed
MeSH terms
Substances
LinkOut - more resources
Full Text Sources
Other Literature Sources
Medical
Research Materials
