

MetaMIS: a metagenomic microbial interaction simulator based on microbial community profiles
- PMID: 27887570
- PMCID: PMC5124289
- DOI: 10.1186/s12859-016-1359-0
MetaMIS: a metagenomic microbial interaction simulator based on microbial community profiles
Abstract
Background: The complexity and dynamics of microbial communities are major factors in the ecology of a system. With the NGS technique, metagenomics data provides a new way to explore microbial interactions. Lotka-Volterra models, which have been widely used to infer animal interactions in dynamic systems, have recently been applied to the analysis of metagenomic data.
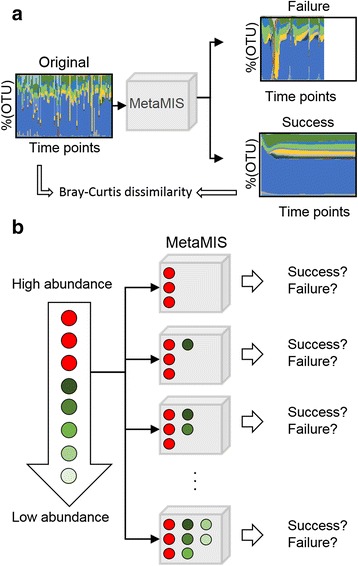
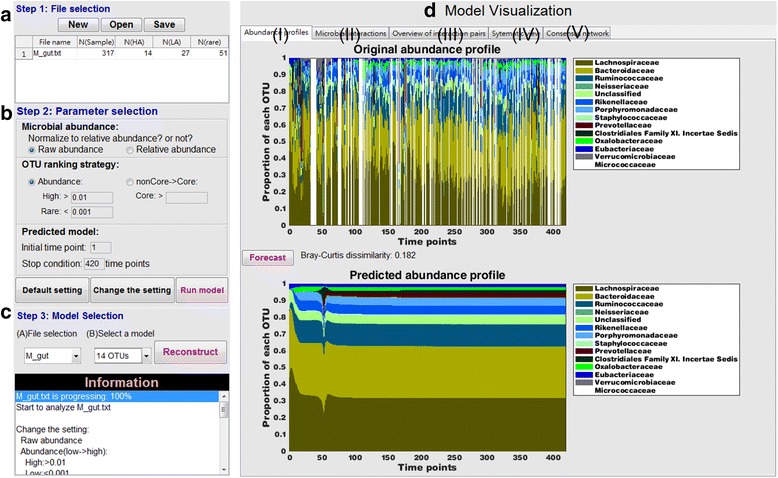
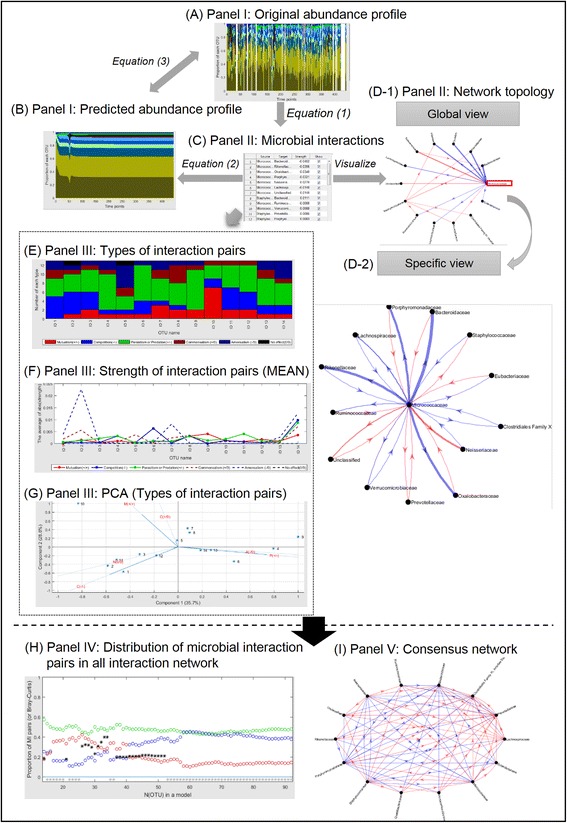
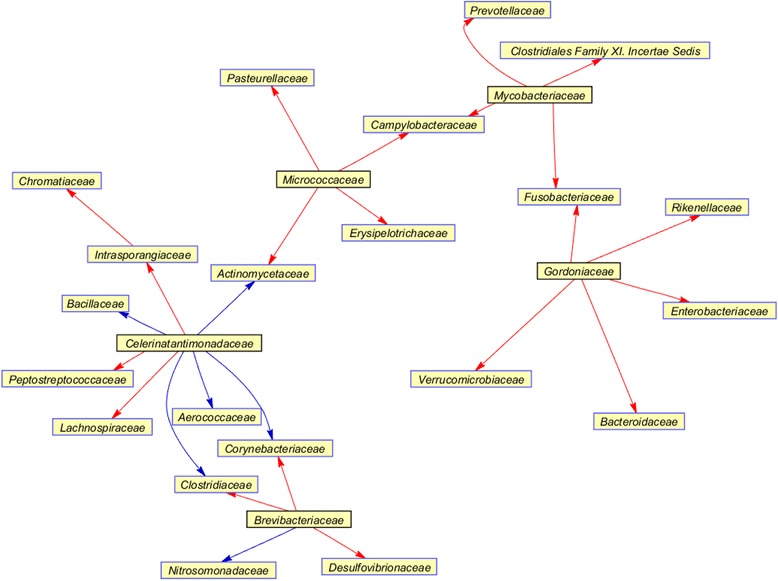
Results: In this paper, we present the Lotka-Volterra model based tool, the Metagenomic Microbial Interacticon Simulator (MetaMIS), which is designed to analyze the time series data of microbial community profiles. MetaMIS first infers underlying microbial interactions from abundance tables for operational taxonomic units (OTUs) and then interprets interaction networks using the Lotka-Volterra model. We also embed a Bray-Curtis dissimilarity method in MetaMIS in order to evaluate the similarity to biological reality. MetaMIS is designed to tolerate a high level of missing data, and can estimate interaction information without the influence of rare microbes. For each interaction network, MetaMIS systematically examines interaction patterns (such as mutualism or competition) and refines the biotic role within microbes. As a case study, we collect a human male fecal microbiome and show that Micrococcaceae, a relatively low abundance OTU, is highly connected with 13 dominant OTUs and seems to play a critical role. MetaMIS is able to organize multiple interaction networks into a consensus network for comparative studies; thus we as a case study have also identified a consensus interaction network between female and male fecal microbiomes.
Conclusions: MetaMIS provides an efficient and user-friendly platform that may reveal new insights into metagenomics data. MetaMIS is freely available at: https://sourceforge.net/projects/metamis/ .
Keywords: Lotka-Volterra; Metagenomics; Network dynamics.
Figures
Similar articles
-
Explore mediated co-varying dynamics in microbial community using integrated local similarity and liquid association analysis.BMC Genomics. 2019 Apr 4;20(Suppl 2):185. doi: 10.1186/s12864-019-5469-8. BMC Genomics. 2019. PMID: 30967122 Free PMC article.
-
PanFP: pangenome-based functional profiles for microbial communities.BMC Res Notes. 2015 Sep 26;8:479. doi: 10.1186/s13104-015-1462-8. BMC Res Notes. 2015. PMID: 26409790 Free PMC article.
-
Community-analyzer: a platform for visualizing and comparing microbial community structure across microbiomes.Genomics. 2013 Oct;102(4):409-18. doi: 10.1016/j.ygeno.2013.08.004. Epub 2013 Aug 24. Genomics. 2013. PMID: 23978768
-
Application of computational approaches to analyze metagenomic data.J Microbiol. 2021 Mar;59(3):233-241. doi: 10.1007/s12275-021-0632-8. Epub 2021 Feb 10. J Microbiol. 2021. PMID: 33565054 Review.
-
Use of whole genome shotgun metagenomics: a practical guide for the microbiome-minded physician scientist.Semin Reprod Med. 2014 Jan;32(1):5-13. doi: 10.1055/s-0033-1361817. Epub 2014 Jan 3. Semin Reprod Med. 2014. PMID: 24390915 Review.
Cited by
-
A survey of computational approaches for characterizing microbial interactions in microbial mats.Genome Biol. 2025 Jun 16;26(1):168. doi: 10.1186/s13059-025-03634-2. Genome Biol. 2025. PMID: 40524188 Free PMC article. Review.
-
IMPARO: inferring microbial interactions through parameter optimisation.BMC Mol Cell Biol. 2020 Aug 19;21(Suppl 1):34. doi: 10.1186/s12860-020-00269-y. BMC Mol Cell Biol. 2020. PMID: 32814564 Free PMC article.
-
Type 2 diabetes, gut microbiome, and systems biology: A novel perspective for a new era.Gut Microbes. 2022 Jan-Dec;14(1):2111952. doi: 10.1080/19490976.2022.2111952. Gut Microbes. 2022. PMID: 36004400 Free PMC article. Review.
-
Mapping the microbial interactome: Statistical and experimental approaches for microbiome network inference.Exp Biol Med (Maywood). 2019 Apr;244(6):445-458. doi: 10.1177/1535370219836771. Epub 2019 Mar 16. Exp Biol Med (Maywood). 2019. PMID: 30880449 Free PMC article. Review.
-
Exploring the Microbiome Analysis and Visualization Landscape.Front Bioinform. 2021 Dec 2;1:774631. doi: 10.3389/fbinf.2021.774631. eCollection 2021. Front Bioinform. 2021. PMID: 36303773 Free PMC article. Review.
References
-
- Gilbert JA, Meyer F, Jansson J, Gordon J, Pace N, Tiedje J, Ley R, Fierer N, Field D, Kyrpides N, et al. The earth microbiome project: meeting report of the “1 EMP meeting on sample selection and acquisition” at Argonne National Laboratory October 6 2010. Stand Genomic Sci. 2010;3(3):249–253. doi: 10.4056/aigs.1443528. - DOI - PMC - PubMed
MeSH terms
LinkOut - more resources
Full Text Sources
Other Literature Sources
Medical
Research Materials
