Meta-Analysis
. 2016 Nov 25;16(1):708.
doi: 10.1186/s12879-016-2045-6.

How severe and prevalent are Ebola and Marburg viruses? A systematic review and meta-analysis of the case fatality rates and seroprevalence

Affiliations
Meta-Analysis

How severe and prevalent are Ebola and Marburg viruses? A systematic review and meta-analysis of the case fatality rates and seroprevalence

Luke Nyakarahuka et al. BMC Infect Dis. .

Abstract

Background: Ebola and Marburg virus diseases are said to occur at a low prevalence, but are very severe diseases with high lethalities. The fatality rates reported in different outbreaks ranged from 24-100%. In addition, sero-surveys conducted have shown different seropositivity for both Ebola and Marburg viruses. We aimed to use a meta-analysis approach to estimate the case fatality and seroprevalence rates of these filoviruses, providing vital information for epidemic response and preparedness in countries affected by these diseases.

Methods: Published literature was retrieved through a search of databases. Articles were included if they reported number of deaths, cases, and seropositivity. We further cross-referenced with ministries of health, WHO and CDC databases. The effect size was proportion represented by case fatality rate (CFR) and seroprevalence. Analysis was done using the metaprop command in STATA.

Results: The weighted average CFR of Ebola virus disease was estimated to be 65.0% [95% CI (54.0-76.0%), I2 = 97.98%] whereas that of Marburg virus disease was 53.8% (26.5-80.0%, I2 = 88.6%). The overall seroprevalence of Ebola virus was 8.0% (5.0%-11.0%, I2 = 98.7%), whereas that for Marburg virus was 1.2% (0.5-2.0%, I2 = 94.8%). The most severe species of ebolavirus was Zaire ebolavirus while Bundibugyo Ebolavirus was the least severe.

Conclusions: The pooled CFR and seroprevalence for Ebola and Marburg viruses were found to be lower than usually reported, with species differences despite high heterogeneity between studies. Countries with an improved health surveillance and epidemic response have lower CFR, thereby indicating need for improving early detection and epidemic response in filovirus outbreaks.

Keywords: Case fatality rate; Ebola virus disease; Marburg virus disease; Meta-analysis; Seroprevalence; Systematic review.


Figures
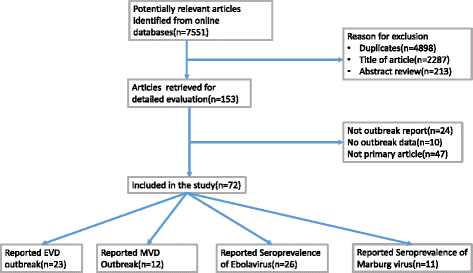
Fig. 1
Fig. 1
Flow diagram for search strategy and article selection process from the literature databases
Fig. 2
Fig. 2
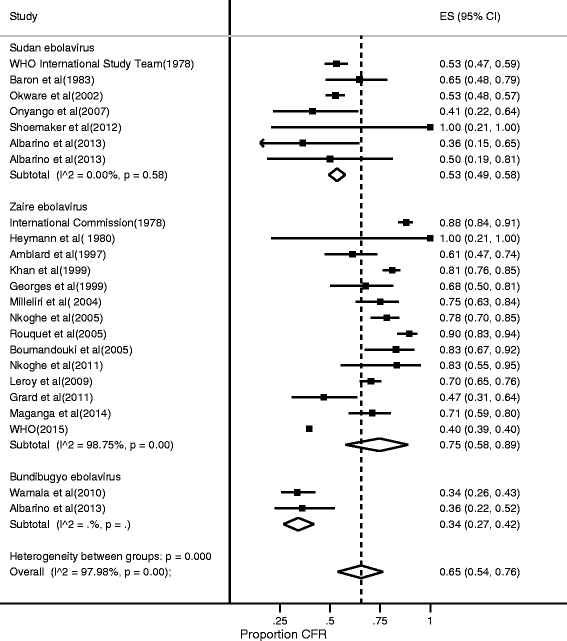
Forest plot showing stratified meta-analysis of CFR of Ebola Virus Disease by virus species estimated by the random effects model (I2 = Higgins statistic, ES = Effect size, CI = Confidence Interval)
Fig. 3
Fig. 3
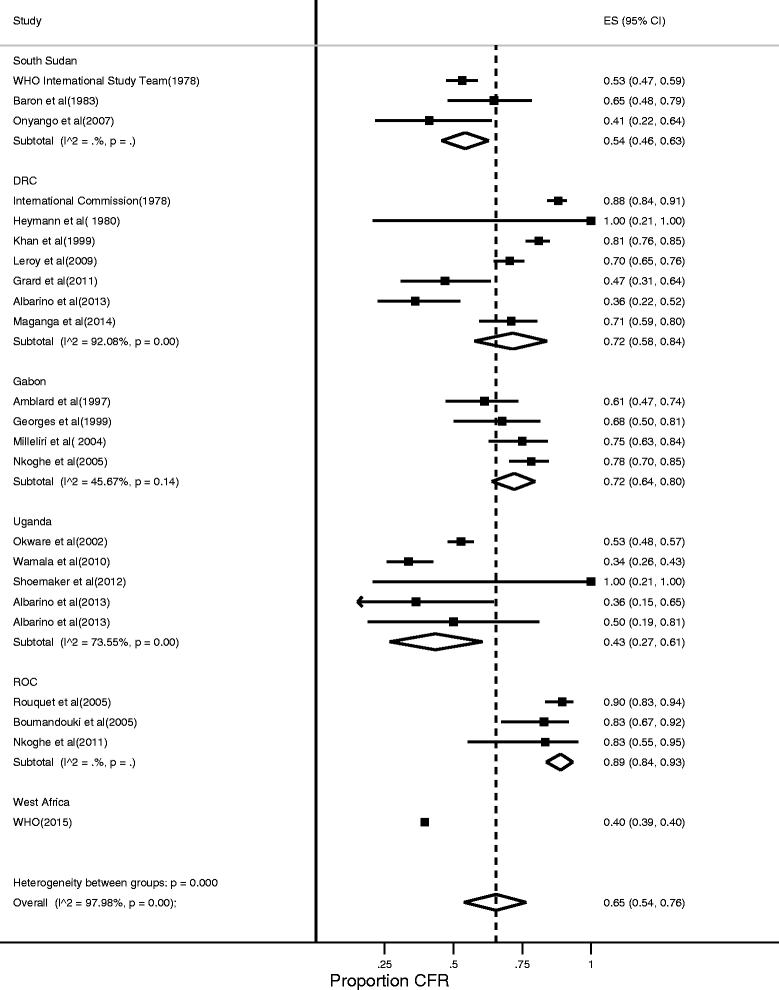
Forest plot showing stratified meta-analysis of CFR of Ebola virus disease by country estimated by the random effects model (I2 = Higgins statistic, ES = Effect size, CI = Confidence Interval, DRC = Democratic Republic of Congo, ROC = Republic of Congo)
Fig. 4
Fig. 4
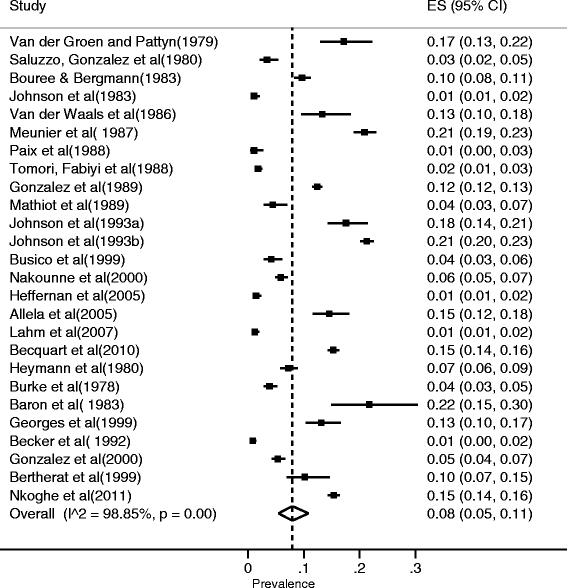
Forest plot for the meta-analysis of sero-prevalence studies of Ebola virus (I2 = Higgins statistic, ES = Effect size, CI = Confidence Interval)
Fig. 5
Fig. 5
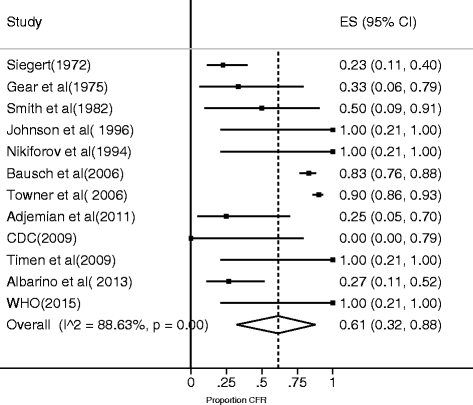
Forest plot for a meta-analysis of CFR of Marburg virus disease estimated using a random effects model (I2 = Higgins statistic, ES = Effect size, CI = Confidence Interval)
Fig. 6
Fig. 6
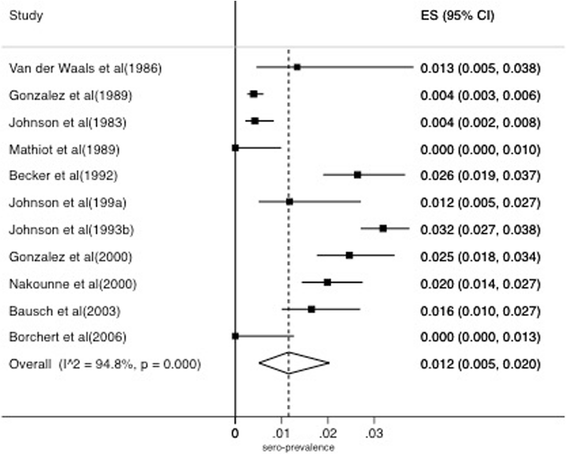
Meta-analysis of seroprevalence of Marburg virus estimated using a random effects model (I2 = Higgins statistic, ES = Effect size, CI = Confidence Interval)
Fig. 7
Fig. 7
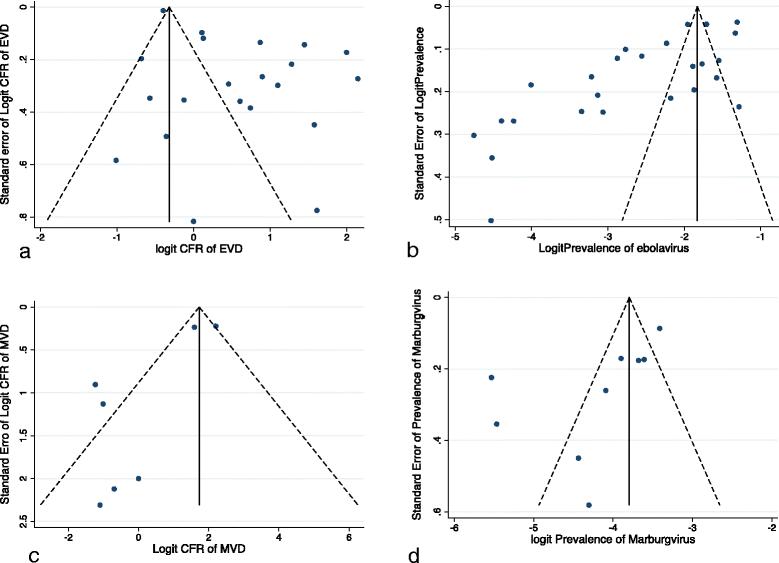
Funnel plots assessing publication bias in studies reporting case fatality rate and seroprevalence of Ebola virus disease and Marburg virus disease. a Funnel plot of the point estimates of the logit CFR of EVD, b Funnel plot of the point estimates of the logit prevalence of EVD, c Funnel plot of the point estimates of the logit CFR of MVD, d Funnel plot of the point estimates of the logit prevalence of MVD

Similar articles

Cited by

References

    1. Ebola virus disease, Fact sheet. http://www.who.int/mediacentre/factsheets/fs103/en/. Accessed 20 June 2016.
    1. Team WHOER Ebola virus disease in West Africa--the first 9 months of the epidemic and forward projections. N Engl J Med. 2014;371(16):1481–1495. doi: 10.1056/NEJMoa1411100. - DOI - PMC - PubMed
    1. Wamala JF, Lukwago L, Malimbo M, Nguku P, Yoti Z, Musenero M, Amone J, Mbabazi W, Nanyunja M, Zaramba S, et al. Ebola hemorrhagic fever associated with novel virus strain, Uganda, 2007–2008. Emerg Infect Dis. 2010;16(7):1087–1092. doi: 10.3201/eid1607.091525. - DOI - PMC - PubMed
    1. Lefebvre A, Fiet C, Belpois-Duchamp C, Tiv M, Astruc K, Aho Glele LS. Case fatality rates of ebola virus diseases: a meta-analysis of World Health Organization data. Med Mal Infect. 2014;44(9):412–416. doi: 10.1016/j.medmal.2014.08.005. - DOI - PubMed
    1. Van Kerkhove MD, Bento AI, Mills HL, Ferguson NM, Donnelly CA. A review of epidemiological parameters from ebola outbreaks to inform early public health decision-making. Sci Data. 2015;2:150019. doi: 10.1038/sdata.2015.19. - DOI - PMC - PubMed