. 2016 Nov 25;17(1):238.
doi: 10.1186/s13059-016-1108-8.

Rapid scoring of genes in microbial pan-genome-wide association studies with Scoary

Affiliations

Rapid scoring of genes in microbial pan-genome-wide association studies with Scoary

Ola Brynildsrud et al. Genome Biol. .

Erratum in

Abstract

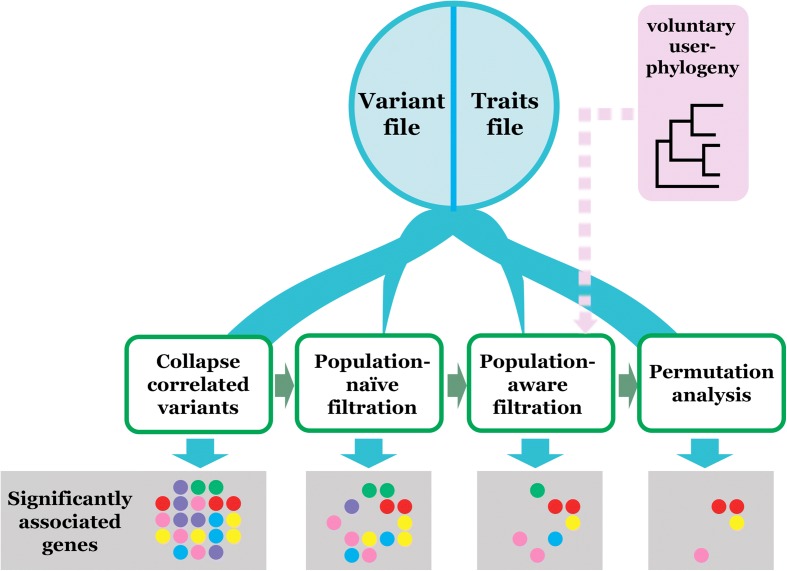
Genome-wide association studies (GWAS) have become indispensable in human medicine and genomics, but very few have been carried out on bacteria. Here we introduce Scoary, an ultra-fast, easy-to-use, and widely applicable software tool that scores the components of the pan-genome for associations to observed phenotypic traits while accounting for population stratification, with minimal assumptions about evolutionary processes. We call our approach pan-GWAS to distinguish it from traditional, single nucleotide polymorphism (SNP)-based GWAS. Scoary is implemented in Python and is available under an open source GPLv3 license at https://github.com/AdmiralenOla/Scoary .

Keywords: Accessory genome; Annotation; Association; Bacteria; Genome-wide association studies (GWAS); Genomics; Next-generation sequencing (NGS); Pan-genome; Prokaryote; Python; Whole-genome sequencing (WGS).


Figures

Fig. 1
Fig. 1
Overview of Scoary workflow. The main input files are one genotype and one phenotype matrix and optionally a phylogenetic tree that will define sample genealogy. If the latter is not provided it is calculated internally through the isolate Hamming distances of the input genotype file. Each candidate variant goes through a set of filtration steps, the thresholds for each set by the user. Fewer and fewer candidate variants will be left to analyze as the computational complexity of operations increase. Variants that pass all filters are returned as results
Fig. 2
Fig. 2
Pairwise comparisons introduction. a Star tree, all isolates equidistantly related. In this scenario, each isolate has a random and independently distributed probability of exhibiting each state and Fisher’s exact test is appropriate. b In non-star trees, the probability of exhibiting each state is confounded by the population structure, in this case meaning the evolutionary history of the sample. An appropriate way of handling this is shifting focus towards evolutionary transitions, as in the pairwise comparisons algorithm. This figure shows the basic idea of a contrasting pair. This tree has a maximum number of 1 non-intersecting, contrasting pairs, a 1–1|0–0 pair. c An illegit pairing. While the two middle isolates and the top and the bottom isolates are both able to form a contrasting pair, a single picking cannot pick both pairs as they would intersect (shared branch shown stapled in purple). Thus, the maximum number of contrasting pairs in this tree is 1. The “best” picking is the red pair (1–1|0–0), which supports gene = 1 - > trait = 1 and the “worst” picking is the blue pair (1–0|0–1), which supports gene = 0 - > trait = 1. The associated p value is equal to 1.0 in either case
Fig. 3
Fig. 3
Pairwise comparisons examples. a Fisher’s exact test for this sample would be highly significant (p = 2.8E-6); however, upon inspection of the tree it becomes clear that there are lineage-specific interdependencies which is a violation of the randomness model implicit in Fisher’s test. The top samples, which display 1–1 are more closely related to each other than the bottom samples, which display 0–0, and vice versa. The most parsimonious scenario is a single introduction (or loss) of the gene and the trait on the root branch. This is illustrated by the pairwise comparisons algorithm, which can find a maximum of 1 contrasting pair (0–0|1–1). b Contrast this to (a). This tree has a maximum of ten contrasting pairs, all 0–0|1–1, which indicates a minimum of ten transitions between 0–0 and 1–1 in the evolutionary history of the sample. In this situation, we should be more convinced that there is a true association between this gene and the trait. The associated p value of the binomial test (the statistical test in the pairwise comparisons algorithm) would be 0.0019. Note that the gene-trait matrix is identical to the one in (a), only shuffled to correspond to tree leaves. c Tree with a maximum number of 7 non-intersecting, contrasting pairs. In this picking, all pairs are 1–1|0–0, indicating a binomial test p value of 0.015, a “best” picking of pairs. d Another picking of 7 contrasting pairs from of the tree in (c), but this set of pairs includes a 1–0|0–1 pair, corresponding to a p value of 0.125. This represents a “worst” picking of pairs from the tree. Thus, the full range of pairwise comparison p values for the gene-trait-phylogeny combination in (c) and (d) would be 0.015–0.125
Fig. 4
Fig. 4
Comparison between Scoary and PLINK. The graphs show precision, recall, and average F1 scores by sample size and causal gene penetrance

References

    1. Chewapreecha C, Harris SR, Croucher NJ, Turner C, Marttinen P, Cheng L, et al. Dense genomic sampling identifies highways of pneumococcal recombination. Nat Genet. 2014;46(3):305–309. doi: 10.1038/ng.2895. - DOI - PMC - PubMed
    1. Laabei M, Recker M, Rudkin JK, Aldeljawi M, Gulay Z, Sloan TJ, et al. Predicting the virulence of MRSA from its genome sequence. Genome Res. 2014;24(5):839–849. doi: 10.1101/gr.165415.113. - DOI - PMC - PubMed
    1. Sheppard SK, Didelot X, Meric G, Torralbo A, Jolley KA, Kelly DJ, et al. Genome-wide association study identifies vitamin B5 biosynthesis as a host specificity factor in Campylobacter. Proc Natl Acad Sci. 2013;110(29):11923–11927. doi: 10.1073/pnas.1305559110. - DOI - PMC - PubMed
    1. Desjardins CA, Cohen KA, Munsamy V, Abeel T, Maharaj K, Walker BJ, et al. Genomic and functional analyses of Mycobacterium tuberculosis strains implicate ald in D-cycloserine resistance. Nat Genet. 2016;48(5):544–551. doi: 10.1038/ng.3548. - DOI - PMC - PubMed
    1. Farhat MR, Shapiro BJ, Kieser KJ, Sultana R, Jacobson KR, Victor TC, et al. Genomic analysis identifies targets of convergent positive selection in drug-resistant Mycobacterium tuberculosis. Nat Genet. 2013;45(10):1183–1189. doi: 10.1038/ng.2747. - DOI - PMC - PubMed