. 2016 Dec 12;30(6):863-878.
doi: 10.1016/j.ccell.2016.10.019. Epub 2016 Nov 23.

NUP98 Fusion Proteins Interact with the NSL and MLL1 Complexes to Drive Leukemogenesis

Affiliations

NUP98 Fusion Proteins Interact with the NSL and MLL1 Complexes to Drive Leukemogenesis

Haiming Xu et al. Cancer Cell. .

Abstract

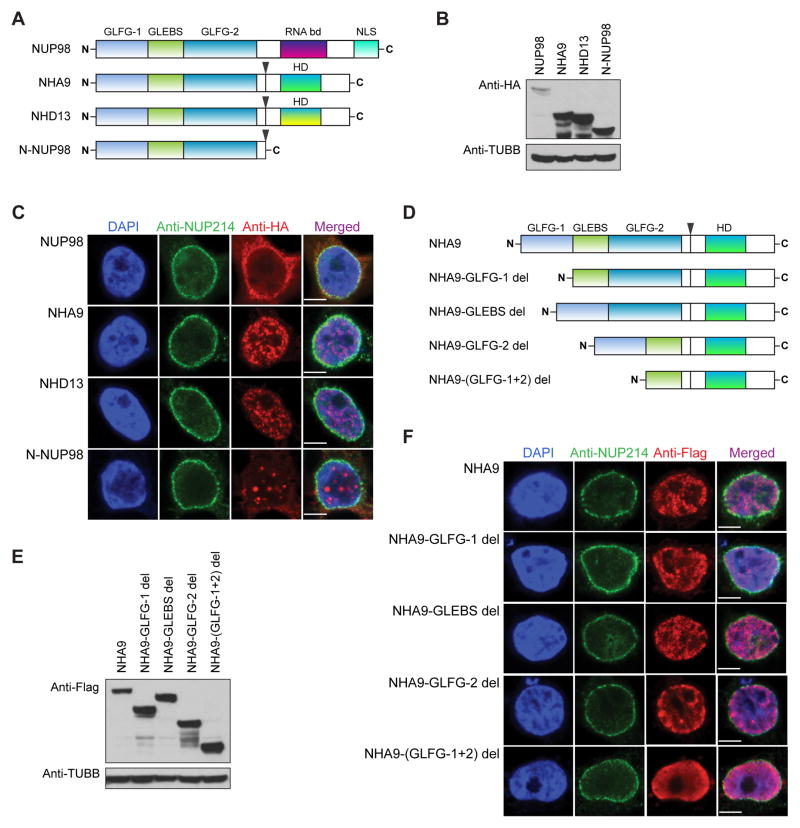
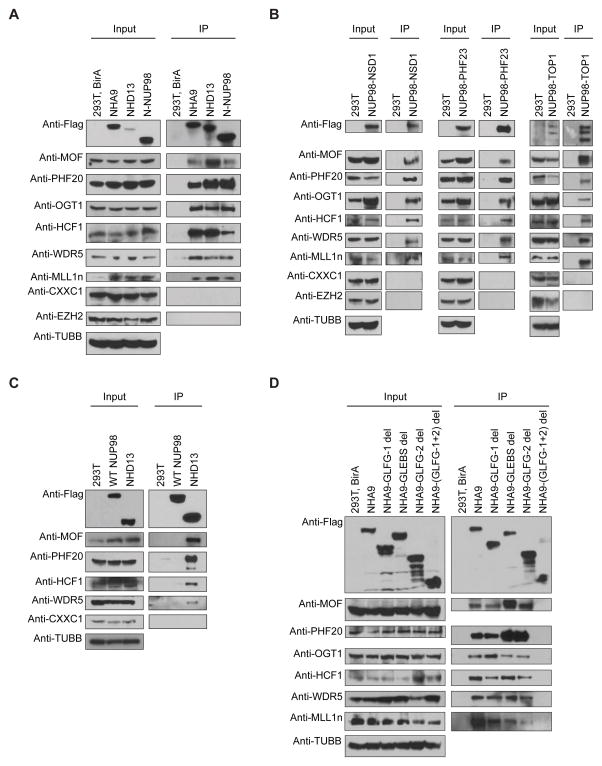
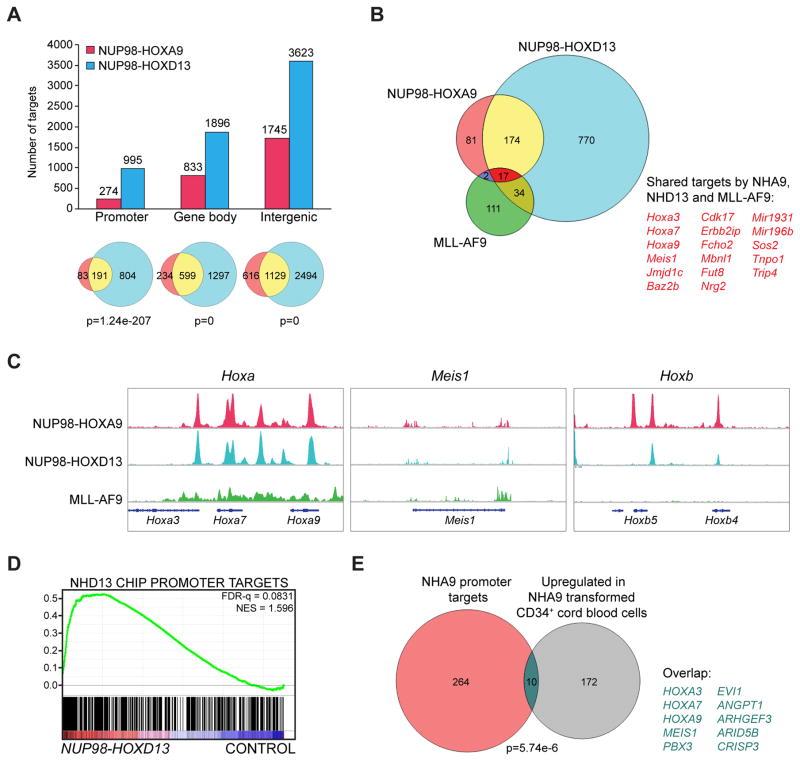
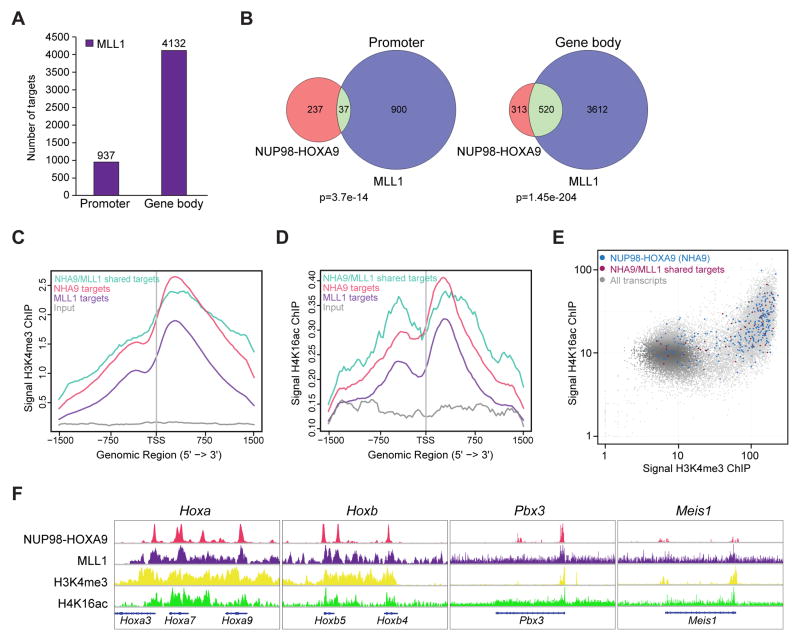
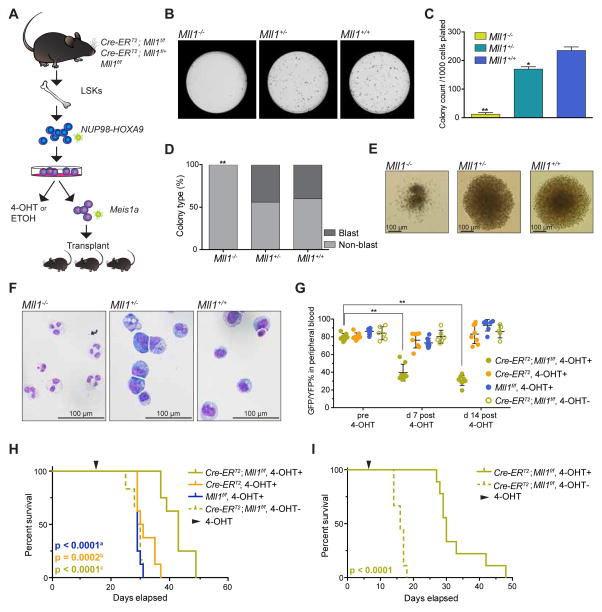
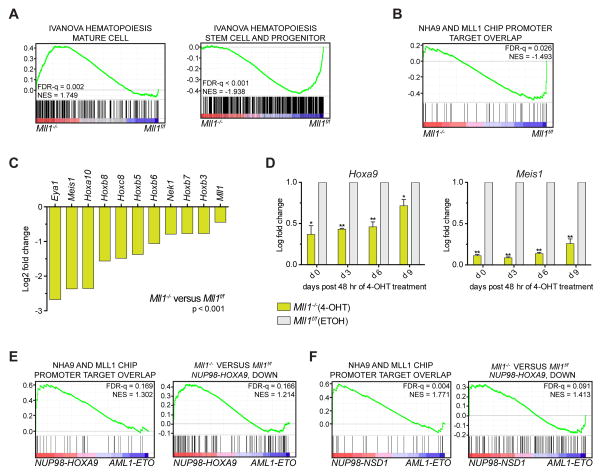
The nucleoporin 98 gene (NUP98) is fused to a variety of partner genes in multiple hematopoietic malignancies. Here, we demonstrate that NUP98 fusion proteins, including NUP98-HOXA9 (NHA9), NUP98-HOXD13 (NHD13), NUP98-NSD1, NUP98-PHF23, and NUP98-TOP1 physically interact with mixed lineage leukemia 1 (MLL1) and the non-specific lethal (NSL) histone-modifying complexes. Chromatin immunoprecipitation sequencing illustrates that NHA9 and MLL1 co-localize on chromatin and are found associated with Hox gene promoter regions. Furthermore, MLL1 is required for the proliferation of NHA9 cells in vitro and in vivo. Inactivation of MLL1 leads to decreased expression of genes bound by NHA9 and MLL1 and reverses a gene expression signature found in NUP98-rearranged human leukemias. Our data reveal a molecular dependency on MLL1 function in NUP98-fusion-driven leukemogenesis.

Keywords: Hox gene; NUP98 fusion; leukemia; mixed lineage leukemia 1; non-specific lethal histone-modifying complexes.


Figures

Figure 1
Figure 1. The subcellular localization and expression of NUP98 and NUP98 fusions
(A) Schematic representation of WT full-length NUP98, NUP98-HOXA9 (NHA9), NUP98-HOXD13 (NHD13) and N-NUP98. Fusion break points are indicated with arrows. (B) Western blot analysis of whole cell lysates from transfected 293T cells detected by anti-HA and anti-beta Tubulin (TUBB) antibodies. One representative experiment of three is shown. (C) Immunofluorescence staining of 293T cells transfected with the Human influenza hemagglutinin (HA)-tagged full-length NUP98, NHA9, NHD13 and N-NUP98 vectors. Cells were stained with an anti-HA and an anti-NUP214 antibody for double-immunofluorescence analysis by confocal microscopy. HA was labeled with Alexa Fluor 568-conjugated secondary antibody (red), and the NUP214 was labeled with Alexa Fluor 488-conjugated secondary antibody (green). Nuclei were counterstained with DAPI (blue). (D) Schematic of the various NHA9 mutant constructs used in this study. (E) Western blot analysis of whole cell lysates from transfected 293T cells detected by anti-Flag and anti-beta Tubulin (TUBB) antibodies. One representative experiment of three is shown. (F) Immunofluorescence staining of 293T cells transfected with Flag-Avi-tagged NHA9 and NHA9 mutant vectors. Cells were stained with an anti-Flag and an anti-NUP214 antibody for double-immunofluorescence analysis as described in 1C. Flag was labeled with Alexa Fluor 568-conjugated secondary antibody (red).
Figure 2
Figure 2. NUP98 fusions interact with MLL1 and the NSL histone-modifying complex
(A) The Flag-Avi-tagged NHA9, NHD13 and N-NUP98 proteins were stably expressed in 293T cells with co-expression of the BirA biotin ligase. Whole cell lysates were subjected to immunoprecipitation (IP) using streptavidin magnetic beads. Cell lysates (Input) and proteins eluted from the streptavidin beads (IP) were analyzed by Western blotting with anti-Flag, anti-MOF, anti-PHF20, anti-OGT1, anti-HCF1, anti-WDR5, anti-MLL1n, anti-CXXC1, anti-EZH2 and anti-beta Tubulin (TUBB) antibodies. (B) Co-IP was performed on lysates from Flag-tagged NUP98-NSD1 (left), NUP98-PHF23 (middle) and NUP98-TOP1 (right) transfected 293T cells with an anti-Flag antibody, and analyzed by Western blotting. (C) Immunoblots of Co-IP on lysates from Flag-tagged full-length NUP98 or NHD13 transfected 293T cells with an anti-Flag antibody. (D) Co-IP was performed on lysates from Flag-Avi-tagged NHA9 or NHA9-mutant vectors transfected 293T cells with co-expression of the BirA biotin ligase, and analyzed by Western blotting. Data are representative of three individual experiments. See also Figure S1.
Figure 3
Figure 3. Genome-wide binding of NUP98 fusions in immortalized mouse bone marrow cells and functional correlation of their target genes in mouse and human cells
(A) Mapping of NHA9 and NHD13 ChIP-seq data identified binding sites as shown in the bar graph. The Venn diagrams illustrate overlapped targets (yellow) between NHA9 (blue) and NHD13 (red) among different genomic regions with a p value calculated by hypergeometric test. (B) Venn diagram for overlap of NHA9 (red), NHD13 (blue) and previously published MLL-AF9 (green) binding sites at promoter regions. (C) Genome browser tracks representing the shared binding sites of NHA9, NHD13 and MLL-AF9 at the Hoxa cluster loci, the Meis1 locus, and the unique binding of NHA9 and NHD13 at the Hoxb cluster loci. (D) Gene set enrichment analysis (GSEA) illustrates enrichment of NHD13 promoter region binding targets in a published gene expression microarray dataset. NES, normalized enrichment score; FDR, false discovery rate. (E) Venn diagram showing the overlap between NHA9 promoter targets (red) and the upregulated genes in a published gene expression microarray dataset (grey) with a p value calculated by hypergeometric test. See also Figure S2/Table S1.
Figure 4
Figure 4. Colocalization of NHA9 and MLL1 at Hoxa and Hoxb cluster gene loci
(A) The bar graph indicates the number of MLL1-bound targets defined by MLL1 ChIP-seq at promoter and gene body regions in transformed murine NHA9 LSKs. (B) Venn diagram shows the overlap between NHA9 (red) and MLL1 (purple) binding targets at promoter and gene body regions with a p value calculated using the hypergeometric test. (C) Shown are the average binding profiles of H3K4me3 defined by H3K4me3 ChIP-seq at a region of ±1.5 kb around the annotated TSSs of NHA9-bound (red), MLL1-bound (purple) and NHA9/MLL1 co-bound targets (turquoise). Tag densities were normalized to the input (grey). (D) Average binding profiles of H4K16ac defined by H4K16ac ChIP-seq experiments are shown. (E) Genome-wide representation of the relation between H3K4me3 and H4K16ac in NHA9 cells at NHA9 promoter targets (blue) and NHA9/MLL1 co-bound promoter targets (dark red) compared to all ~34000 transcripts (gray). The x and y-axis represent binding read numbers per Kb. (F) Genome browser tracks of genomic regions showing colocalization of NHA9, MLL1, H3K4me3 and H4K16ac at four representative, well-known MLL1 targets; Hoxa cluster genes, Hoxb cluster genes, Pbx3 and Meis1. See also Figure S2/Table S2.
Figure 5
Figure 5. The effects of Mll1 loss in a murine NHA9 driven leukemia model
(A) Schematic for in vitro and in vivo Mll1 knockout experiments. (B) Representative 35 mm dishes are shown the CFU assay of NHA9 in vitro transformed mouse BM LSKs plated after 48 hr of 4-OHT treatments. (C) Bar graph indicates mean number of colonies per 35 mm dish after 7 days. Data are representative of four individual experiments. (D) Shown is the mean percentage of blast versus non-blast colonies relative to all colonies counted per dish, per genotype. (E) Representative images of colonies at day 7 of CFU assay. (F) Representative images of Wright-Giemsa–stained cytospin preparations of cells harvested at day 7 of CFU assay. (G) Mouse BM LSKs were retrovirally transduced with GFP-NHA9 and YFP-Meis1a, sorted for double positive cells and injected into lethally irradiated C57Bl/6 mice (n=8 per group). Plotted is the GFP+YFP+% of live cells in peripheral (PB) of mice before 4-OHT treatments and at two different time-points post treatments. A dot represents a single mouse in the experiment. (H) Survival curve of mice with primary leukemia. Data are representative of three individual experiments. (I) Primary Cre-ERT2;Mll1f/f NHA9-Meis1a mouse leukemia BM cells were injected into sub-lethally irradiated C57Bl/6 mice. Half of the mice (n=10) were treated with 4-OHT at day 7 after transplant to excise Mll1. See also Figure S3, S4 and S5. Abbreviations: Cre-ERT2;Mll1f/f + 4-OHT referred to as Mll1−/−, Cre-ERT2;Mll1f/+ + 4-OHT referred to as Mll1+/−, Mll1f/f referred to as Mll1+/+ * p < 0.05, ** p < 0.01. Error bars represent SD of mean. a.Log-rank test p value comparing survival for Cre-ERT2;Mll1f/f to Mll1f/f b.Log-rank test p value comparing survival for Cre-ERT2;Mll1f/f to Cre-ERT2 c.Log-rank test p value comparing survival for Cre-ERT2;Mll1f/f to Cre-ERT2;Mll1f/f without 4OHT treatment
Figure 6
Figure 6. MLL1-dependent gene expression signature in NHA9 transformed mouse LSKs resembles human NUP98-NSD1 leukemia
(A) GSEA with a differential expression analysis ranked list comparing RNA-seq data from Cre-ERT2;Mll1f/f NHA9 cells at day 3 post 4-OHT treatment (referred to as Mll1−/−) to the cells treated with vehicle control (referred to as Mll1f/f). Enrichment was assessed for genes that are upregulated in mature hematopoietic populations (left) and upregulated in progenitors and stem cells (right) from mouse BM and fetal liver cells. (B) A gene set was created using the list of NHA9/MLL1 co-bound promoter targets from the ChIP-seq analysis. GSEA was generated using the RNAseq differential expression analysis comparing Mll1−/− to Mll1f/f NHA9 cells. (C) Bar graphs indicate log2 fold changes in gene expression as measured by RNAseq when comparing Mll1−/− to Mll1f/f NHA9 cells. (D) NHA9 in vitro transformed Cre-ERT2;Mll1f/f LSKs were plated in liquid culture following 48 hr of 4-OHT or vehicle treatment. Bar graphs illustrate relative expression levels (RT-qPCR) as mean log fold change compared to vehicle control treated cells. The x-axis indicates cells harvested at various time-points post treatment. Error bars represent SD of mean. * p < 0.05, ** p < 0.01. Data are representative of three individual experiments. (E) A gene set was created using the NHA9/MLL1 co-bound promoter targets (left). Another MLL1-dependent gene set was created using the list of significantly downregulated genes revealed by RNA-seq when comparing Mll1−/− to Mll1f/f NHA9 cells with LFC < −1 and adjusted p < 0.05 (right). Enrichment of these MLL1-dependent gene sets in published human gene expression microarray data from NHA9 versus AML1-ETO transfected CD34+ cord blood cells (GSE57194) was assessed. (F) The MLL1-dependent gene sets defined in Figure 6E were used to assess enrichment in published gene expression microarray data from human pediatric de novo AML patients with a NUP98-NSD1 translocation versus patients with an AML1-ETO rearrangement (GSE17855). NES, normalized enrichment score; FDR, false discovery rate. See also Figure S6/Table S3.
Figure 7
Figure 7. Hoxa9 and Meis1 overexpression rescues murine NHA9 driven leukemia from MLL1 dependence
(A) Schematic for in vitro and in vivo Mll1 knockout rescue experiments. (B) CFU assay of NHA9 in vitro transformed mouse BM LSKs, plated after 48 hr of 4-OHT treatments. Samples stating “+rescue” were infected with virus containing Hoxa9 and Meis1 and selected by hygromycin treatment, prior to excision. Bar graphs display mean number of colonies per 35 mm dish. Day 7 of the 1st plating (left) and 2nd plating (right). Data are representative of three individual experiments. (C) Shown is the mean percentage of blast versus non-blast colonies relative to all colonies counted per dish, per sample after the 1st plating. (D) Representative images of colonies formed at day 7 of the 1st plating. (E) Representative images of Wright-Giemsa–stained cytospin preparations of cells harvested at day 7 of the 1st plating. (F) PCR analysis illustrates excision throughout the duration of a colony forming experiment. Representative gel images are shown. (G) Mouse BM LSKs were retrovirally transduced with NHA9 and Meis1a or both Meis1a and Hoxa9 (“+ rescue”). Sorted cells were injected into lethally irradiated C57Bl/6 mice. Plotted is the GFP+YFP+% of live cells in PB of mice before 4-OHT treatment and 14 days post treatment. A dot represents a single mouse in the experiment. (H) Survival curve. Mice were treated with 4-OHT at day 15 after transplant. (I) PCR analysis illustrates Mll1 excision in the murine BM of Cre-ERT2;Mll1f/f + Hoxa9/Meis1 recipient mice at time of death. Representative gel images are shown. See also Figure S7. Abbreviations: Cre-ERT2;Mll1f/f + 4-OHT referred to as Mll1−/−, Cre-ERT2;Mll1f/+ + 4-OHT referred to as Mll1+/−, Mll1f/f referred to as Mll1+/+ * p < 0.05, ** p < 0.01. Error bars represent SD of mean. a.Log-rank test p value comparing survival for Cre-ERT2;Mll1f/f to Mll1f/f b.Log-rank test p value comparing survival for Cre-ERT2;Mll1f/f to Cre-ERT2;Mll1f/f + Hoxa9/Meis1 c.Log-rank test p value comparing survival for Cre-ERT2;Mll1f/f to Cre-ERT2;Mll1f/f + Hoxa9/Meis1 without 4OHT treatment

References

    1. Abdul-Nabi AM, Yassin ER, Varghese N, Deshmukh H, Yaseen NR. In vitro transformation of primary human CD34+ cells by AML fusion oncogenes: early gene expression profiling reveals possible drug target in AML. PloS one. 2010;5:e12464. - PMC - PubMed
    1. Artinger EL, Mishra BP, Zaffuto KM, Li BE, Chung EK, Moore AW, Chen Y, Cheng C, Ernst P. An MLL-dependent network sustains hematopoiesis. Proc Natl Acad Sci U S A. 2013;110:12000–12005. - PMC - PubMed
    1. Ayton PM, Cleary ML. Transformation of myeloid progenitors by MLL oncoproteins is dependent on Hoxa7 and Hoxa9. Genes Dev. 2003;17:2298–2307. - PMC - PubMed
    1. Bernt KM, Zhu N, Sinha AU, Vempati S, Faber J, Krivtsov AV, Feng Z, Punt N, Daigle A, Bullinger L, et al. MLL-rearranged leukemia is dependent on aberrant H3K79 methylation by DOT1L. Cancer cell. 2011;20:66–78. - PMC - PubMed
    1. Bijl J, Thompson A, Ramirez-Solis R, Krosl J, Grier DG, Lawrence HJ, Sauvageau G. Analysis of HSC activity and compensatory Hox gene expression profile in Hoxb cluster mutant fetal liver cells. Blood. 2006;108:116–122. - PMC - PubMed

MeSH terms