. 2016 Dec 12;30(6):909-924.
doi: 10.1016/j.ccell.2016.10.007. Epub 2016 Nov 23.

Circadian Homeostasis of Liver Metabolism Suppresses Hepatocarcinogenesis

Affiliations

Circadian Homeostasis of Liver Metabolism Suppresses Hepatocarcinogenesis

Nicole M Kettner et al. Cancer Cell. .

Abstract

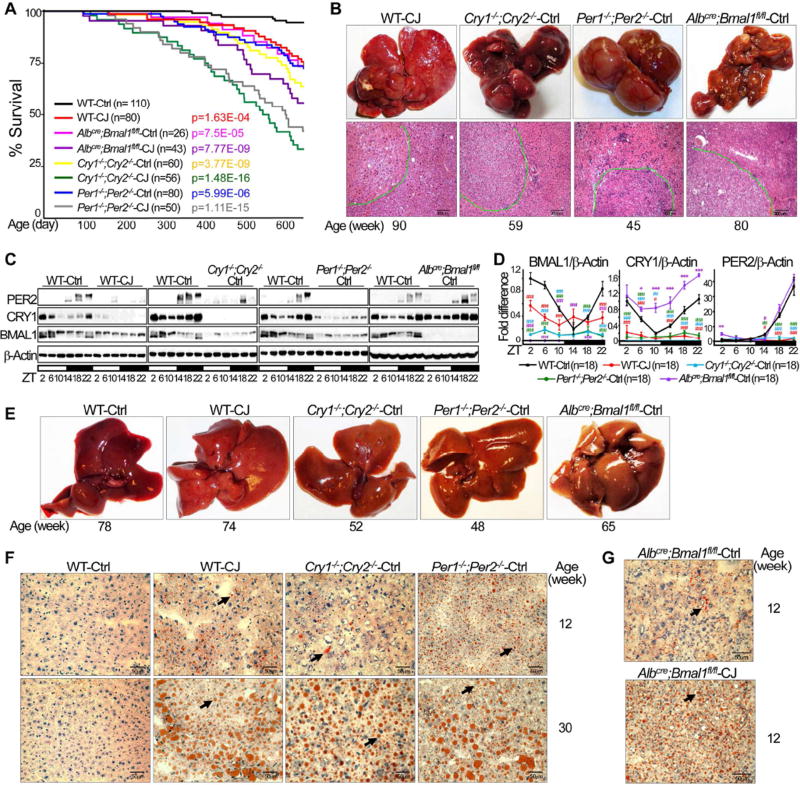
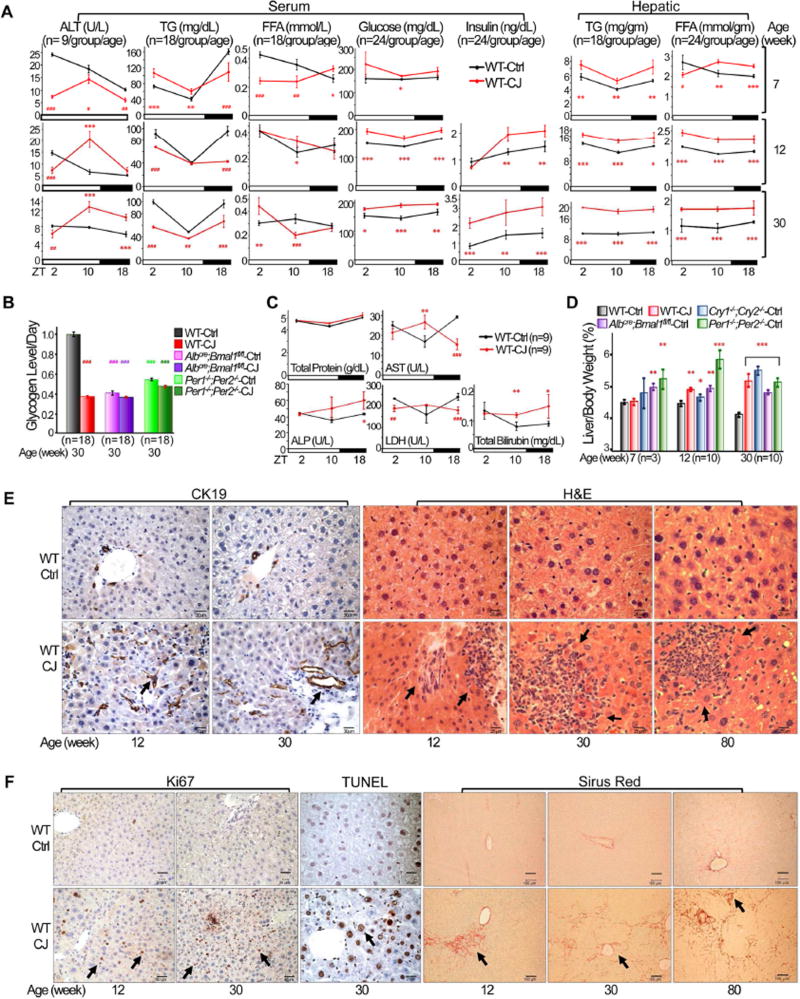
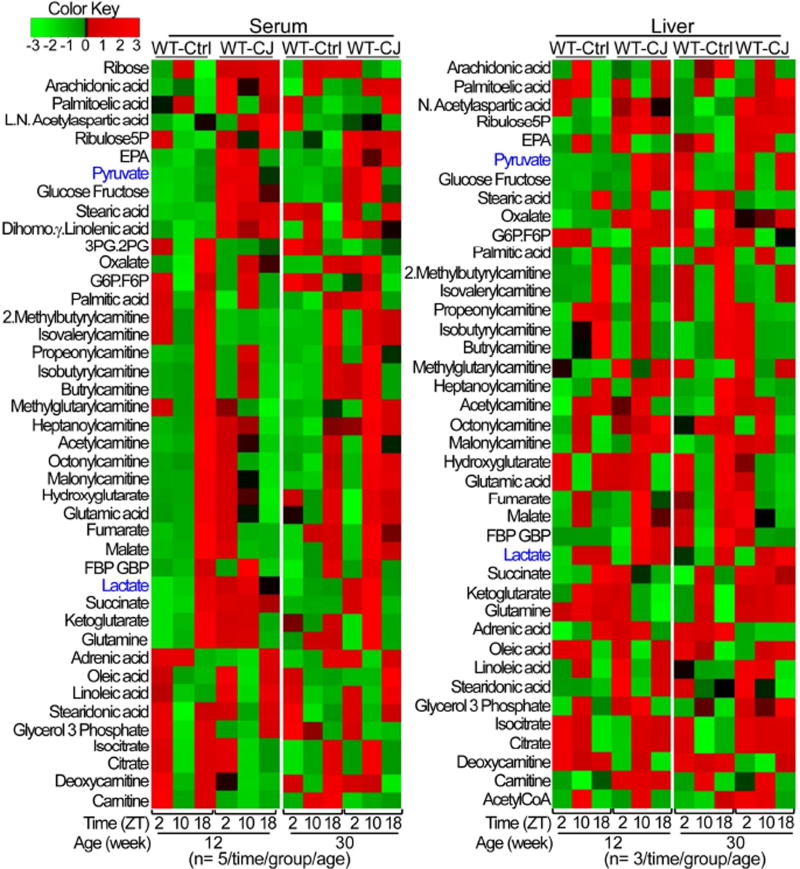
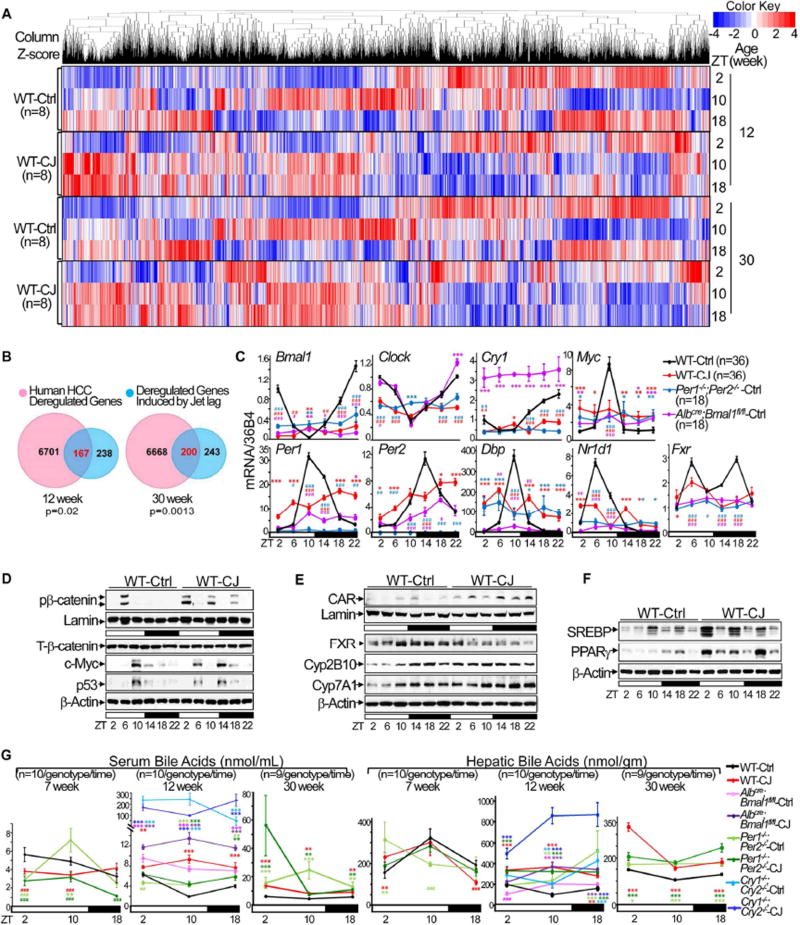
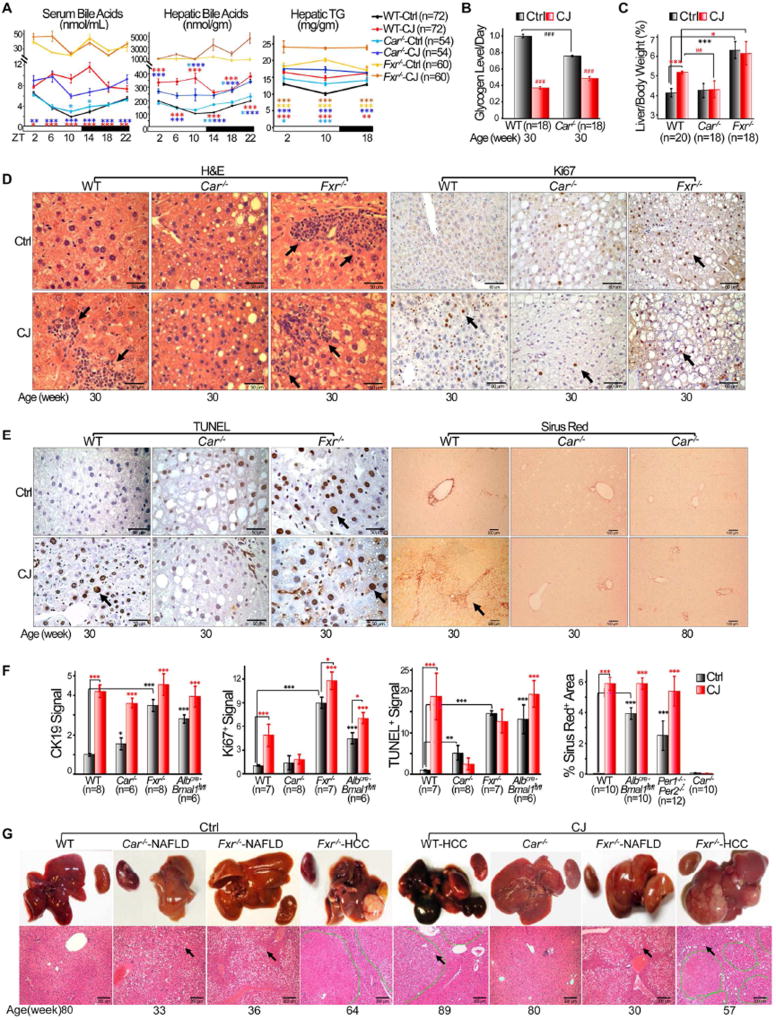
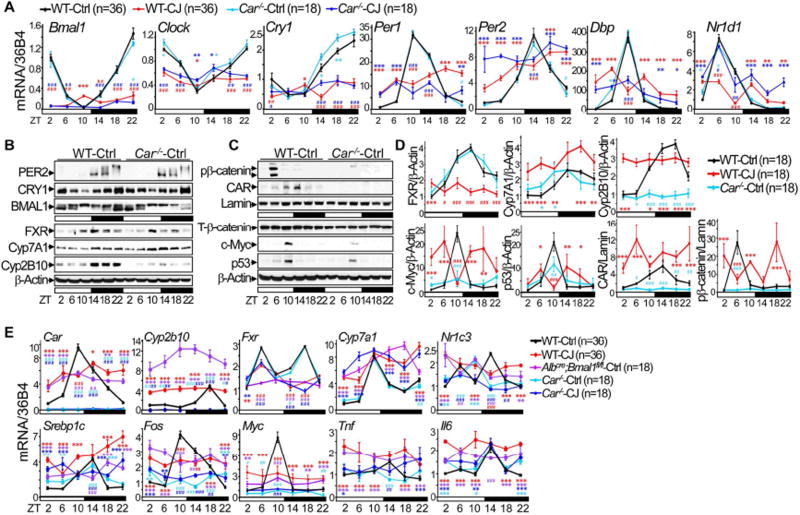
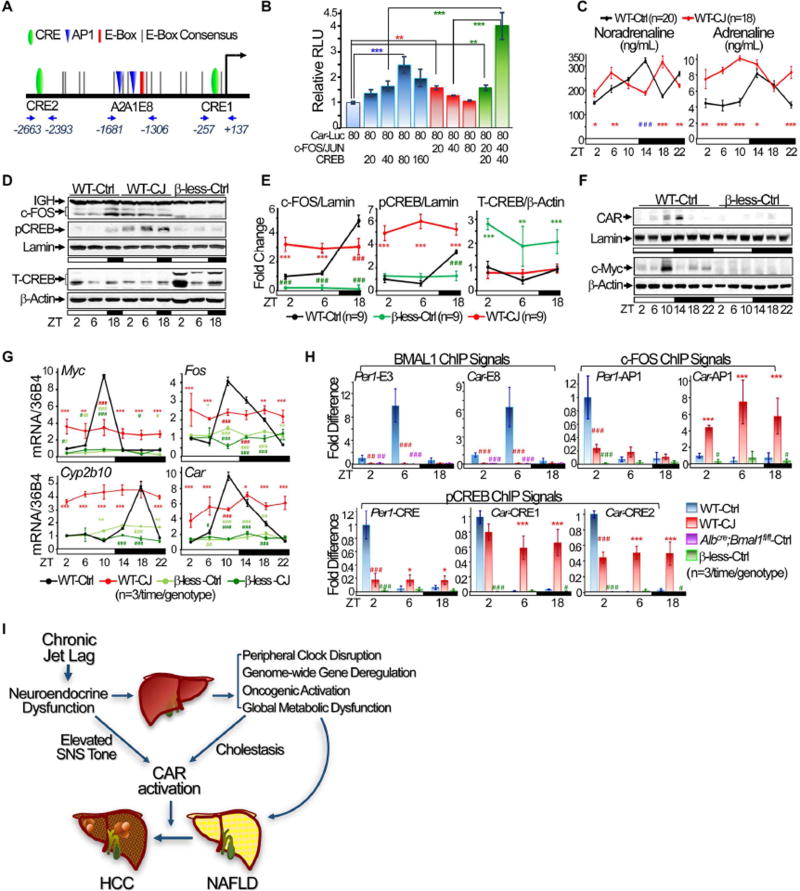
Chronic jet lag induces spontaneous hepatocellular carcinoma (HCC) in wild-type mice following a mechanism very similar to that observed in obese humans. The process initiates with non-alcoholic fatty liver disease (NAFLD) that progresses to steatohepatitis and fibrosis before HCC detection. This pathophysiological pathway is driven by jet-lag-induced genome-wide gene deregulation and global liver metabolic dysfunction, with nuclear receptor-controlled cholesterol/bile acid and xenobiotic metabolism among the top deregulated pathways. Ablation of farnesoid X receptor dramatically increases enterohepatic bile acid levels and jet-lag-induced HCC, while loss of constitutive androstane receptor (CAR), a well-known liver tumor promoter that mediates toxic bile acid signaling, inhibits NAFLD-induced hepatocarcinogenesis. Circadian disruption activates CAR by promoting cholestasis, peripheral clock disruption, and sympathetic dysfunction.

Keywords: cholestasis; chronic circadian disruption; constitutive androstane receptor (CAR); farnesoid X receptor (FXR); fibrosis; hepatocarcinogenesis; non-alcoholic fatty liver disease; non-alcoholic steatohepatitis; social jet lag; sympathetic dysfunction.


Conflict of interest statement

The authors have no conflicts of interest to declare.

Figures

Figure 1
Figure 1. Chronic jet lag induces NAFLD and spontaneous HCC
(A) Kaplan-Meier survival curves show life-spans of WT and circadian gene mutant mice. Ctrl: maintained in steady 24 hr LD cycles; CJ: chronically jet-lagged. p value: Ctrl vs. CJ for each mouse model, Kaplan Meier Statistics. (B) Spontaneous HCC from circadian gene mutant and jet-lagged WT mice. Top: gross image of HCC; bottom: Hematoxylin and eosin (H&E) stained tumor slides show histological diagnosis of HCC, circled by dashed green lines. Scale bars indicate 300 µm. (C) Western blots show BMAL1, CRY1 and PER2 expression in the livers of 12 week old jet-lagged WT and circadian gene mutant mice. ZT: Zeitgeber time, with light on at ZT0 and off at ZT12. (D) Summary of 3 independent Western blotting analyses on hepatic expression of BMAL1, CRY1 and PER2 (higher protein band only for PER2) with the expression level in control WT mice at ZT2 as the arbitrary unit 1 (student t test, ±SEM). *: Increase,#: decrease, comparing to WT controls at the same time, */#p<0.05, **/##p<0.01; ***/###p<0.001. (E, F) Gross liver image (E) and Oil Red O stained slides (F) showing NAFLD development in mutant and jet-lagged WT mice. (G) Representative Oil Red O stained slides show the level of fat accumulation in control (top) and jet-lagged (bottom) Albcre;Bmal1fl/fl mice at 12 weeks of age. Scale bars in all Oil Red O stained slides indicate 50 µm. Arrows indicate representative fat droplets. See also figure S1.
Figure 2
Figure 2. Chronic jet lag induces metabolic syndrome and the progression from NAFLD to NASH and fibrosis
(A) The levels of serum and hepatic biomarkers in control and jet-lagged WT mice. ALT: alanine aminotransferase; TG: triglycerides; FFA: free fatty acids (Student t test). (B) Daily hepatic glycogen storage detected by Periodic Acid Schiff (PAS) staining in control and jetlagged WT mice. Values indicate average levels of glycogen storage detected at ZT2, 10 and 18 for each mouse model, with that in control WT mice as the arbitrary unit 1 (Image J/Color Deconvolution plugin quantification). (C) Serum liver biomarkers in 12 week old jet-lagged WT mice. AST: aspartate transaminase, ALP: alkaline phosphatase, LDH: lactate dehydrogenase (Student t test). (D) The ratios of liver vs body weight of circadian gene mutant and WT mice (Student t test). (E) Cytokeratin 19 (CK19) and H&E staining show incidence of intrahepatic bile duct proliferation and inflammation in control and jet-lagged WT mice. Arrows indicate representative proliferating bile ducts (CK19) and areas of hematopoietic cell infiltration (H&E). (F) Ki67, TUNEL and Sirus Red staining show incidence of hepatocyte proliferation and death, and liver fibrosis in control and jet-lagged WT mice. Arrows indicate representative Ki67+ or TUNEL+ hepatocytes (Ki67 or TUNEL), and liver fibrosis (Sirus Red). Scale bars are 60 µm (CK19), 50 µm (HE), 60 µm (Ki67), 50 µm (TUNEL) and 100 µm (Sirus Red) in correspondent slides. *: Increase,#: decrease, comparing to WT controls at the same time or age */#p<0.05, **/##p<0.01; ***/###p<0.001, ±SEM. See also figures S2 and S3.
Figure 3
Figure 3. Global disruption of liver metabolism in jet-lagged WT mice
Hierarchical clustering heat maps show serum (left panel) and hepatic (right panel) carnitines, lipids and prostaglandins, CoA’s and TCA metabolites in control WT mice and the persistent deregulation of these metabolites in jet-lagged WT mice. See also figures S4 and S5.
Figure 4
Figure 4. Chronic jet lag induces genome-wide gene deregulation in mouse livers
(A) Hierarchical clustering heat map shows expression of hepatic genes in the livers of control and jet-lagged WT mice. (B) Venn diagrams showing persistent overlap of deregulated liver transcriptomic signatures in jet-lagged WT mice with that of human HCC from 12 to 30 weeks of age (hypergeometric test). (C) The summary of 3 independent RT-PCR studies on the expression of core circadian genes, Myc and Fxr in the livers of 12 week-old circadian gene mutant and WT mice, with levels detected in control WT mice at ZT2 as the arbitrary unit 1. (D–F) Western blots show the expression of Ser552 phospho-β-catenin (pβ-catenin), total β-catenin (T-β-catenin), c-Myc and p53 in (D), FXR, CAR, Cyp2B10 and Cyp7A1 in (E), and SREBP1 and PPARγ in (F) in the livers of 12 week old WT mice. (G) Serum and hepatic bile acid levels over a 24 hr period in circadian gene-mutant and WT mice at 7, 12 and 30 weeks of age. *: Increase,#: decrease, comparing to WT controls at the same time, */#p<0.05, **/##p<0.01; ***/###p<0.001, student t test, ±SEM. See also figure S6 and Table S1–6.
Figure 5
Figure 5. CAR stimulates NAFLD to NASH and fibrosis progression
(A) Circadian profiles of serum and hepatic bile acids and triglyceride (TG) in 12 week old control and jet-lagged WT, Car−/− and Fxr−/− mice (Student t test). (B) Daily hepatic glycogen storage in control and jet-lagged WT and Car−/− mice detected by PAS staining. Values indicate average levels of hepatic glycogen storage detected at ZT2, 10 and 18 for each mouse model, with that in control WT mice as the arbitrary unit 1 (Image J/Color Deconvolution plugin quantification). (C) The ratios of liver vs. body weight of WT, Car−/− and Fxr−/− mice at 30 weeks of age (Student t test). (D) H&E and Ki67 staining detect liver inflammation and hepatocyte proliferation in control and jet-lagged WT, Car−/−, Fxr−/− mice. Arrows indicate representative areas of hematopoietic cell infiltration in H&E and Ki67+ hepatocytes in Ki67 slides. Scale bars indicate 50 and 60 µm in the H&E and Ki67 slides, respectively. (E) TUNEL and Sirus Red staining show incidence of hepatocyte death (TUNEL) and fibrosis (Sirus Red) in the livers of WT, Car−/−, Fxr−/− mice. Arrows indicate representative TUNEL+ hepatocytes (TUNEL) and areas of liver fibrosis (Sirus Red). Scale bars indicate 50 and 100 µm in the TUNEL and Sirus Red slides, respectively. (F) The level of bile duct and hepatocyte proliferation (Student t test), hepatocyte necrosis (Student t test), and liver fibrosis (Image J) in 30 week old control and jetlagged WT and mutant mice. All analyzed at 10× magnification with CK19, Ki67 and TUNEL signals detected in the livers of control WT mice as the arbitrary unit 1. (G) Gross image (top) and histological diagnosis of HCC by H&E staining (bottom) show NAFLD in jet-lagged WT, Car−/− and Fxr−/− mice and HCCs found in jet-lagged WT and Fxr−/− mice. Kidneys that do not show significant changes in size among different mouse models are included in gross images. Tumors in H&E slides are circled by dashed green lines. Arrows indicate representative fat droplets in H&E slides. Scale bars indicate 200 µm. *: Increase,#: decrease, comparing to WT control samples at the same age or time, */#p<0.05, **/##p<0.01; ***/##p<0.001, ±SEM. See also figure S7.
Figure 6
Figure 6. Car is a clock-controlled gene
(A) The summary of 3–6 independent RT-PCR studies on core circadian gene expression in WT and Car−/− mouse livers at 12 weeks of age, with the expression level in control WT mice at ZT2 as the arbitrary unit 1. (B, C) Western blots show the expression of BMAL1, CRY1, PER2, FXR, Cyp7A1 and Cyp2B10 (B), and CAR, p53, c-Myc, phospho-β-catenin (pβ-catenin) and total β-catenin (T-β-catenin) (C) in WT and Car−/− mouse livers at 12 weeks of age. (D) The summary of 3 independent Western blotting on hepatic expression of FXR, CAR, c-Myc, pβ-catenin, p53, Cyp7A1 and Cyp2B10 in 12 week old WT and Car−/− mice, with the expression level in control WT mice at ZT2 as the arbitrary unit 1. (E) The summary of 3–6 independent RT-PCR studies on the expression of Car, Cyp2b10, Fxr, Cyp7a1, Myc, Fos, Pparγ, Srebp1c, Tnf and Il6 in the livers of 12 week-old WT, Car−/− and Albcre;Bmal1fl/fl mice, with the expression level in control WT mice at ZT2 as the arbitrary unit 1. *: Increase,#: decrease, comparing to WT control samples at the same time, */#p<0.05, **/##p<0.01; ***/###p<0.001, student t test, ±SEM.
Figure 7
Figure 7. SNS dysfunction induces Car activation
(A) The schematic illustration of conserved E-boxes, AP1 (A1 and A2) and CRE (C1 and C2) binding motifs and ChIP qPCR primers in the Car promoter. (B) The summary of 4–5 independent co-transfection assays studying the role of AP1 and CREB in Car promoter activation. (C) Urine catecholamine assays show sympathetic tone over a 24 hr period in control and jet-lagged WT mice at 12 weeks of age. (D) Western blots show nuclear expression of c-FOS and S133 phopho-CREB (pCREB) (top panel), and total CREB (T-CREB) (bottom panel) levels in liver nuclear extracts of WT and β-less mice at 12 weeks of age. (E) The summary of 3 independent Western blotting studying the hepatic expression of c-FOS, pCREB and T-CREB in WT and β-less mice at 12 weeks of age. F. Western blots show CAR and c-Myc expression in the livers of 12 week old β-less mice. G. The summary of 3 independent RT-PCR studies on hepatic expression of Fos, Myc, Car and Cyp2b10 mRNAs in control and jet-lagged WT and β-less mice at 12 weeks of age. (H) BMAL1, c-FOS and pCREB ChIP signals on Car and Per1 promoters in the livers of WT, β-less and AlbCre;Bmal1fl/fl mice at 12 week of age, with ChIP signals for each transcription factor detected in control WT mice at ZT2 as the arbitrary unit 1. Negative control IgGs and qPCR primers are explained in Supplemental Experimental Procedures. *: Increase,#: decrease, comparing to WT control mice at the same time, */#p<0.05, **/##p<0.01; ***/###p<0.001, student t test, ±SEM. (I) A model for the role of chronic circadian disruption in NAFLD-induced hepatocarcinogenesis. See also figure S8.

Comment in

References

    1. Anand P, Kunnumakkara AB, Sundaram C, Harikumar KB, Tharakan ST, Lai OS, Sung B, Aggarwal BB. Cancer is a preventable disease that requires major lifestyle changes. Pharmaceutical research. 2008;25:2097–2116. - PMC - PubMed
    1. Audard V, Grimber G, Elie C, Radenen B, Audebourg A, Letourneur F, Soubrane O, Vacher-Lavenu MC, Perret C, Cavard C, Terris B. Cholestasis is a marker for hepatocellular carcinomas displaying beta-catenin mutations. The Journal of pathology. 2007;212:345–352. - PubMed
    1. Bass J, Takahashi JS. Circadian integration of metabolism and energetics. Science. 2010;330:1349–1354. - PMC - PubMed
    1. Diwan BA, Rice JM, Ward JM. Strain-dependent effects of phenobarbital on liver tumor promotion in inbred mice. Progress in clinical and biological research. 1990;331:69–83. - PubMed
    1. Dong B, Lee JS, Park YY, Yang F, Xu G, Huang W, Finegold MJ, Moore DD. Activating CAR and beta-catenin induces uncontrolled liver growth and tumorigenesis. Nature communications. 2015;6:5944. - PMC - PubMed

MeSH terms

Substances