. 2017 Jan:137:165-172.
doi: 10.1016/j.antiviral.2016.11.017. Epub 2016 Nov 24.

Synergistic drug combination effectively blocks Ebola virus infection

Affiliations

Synergistic drug combination effectively blocks Ebola virus infection

Wei Sun et al. Antiviral Res. 2017 Jan.

Abstract

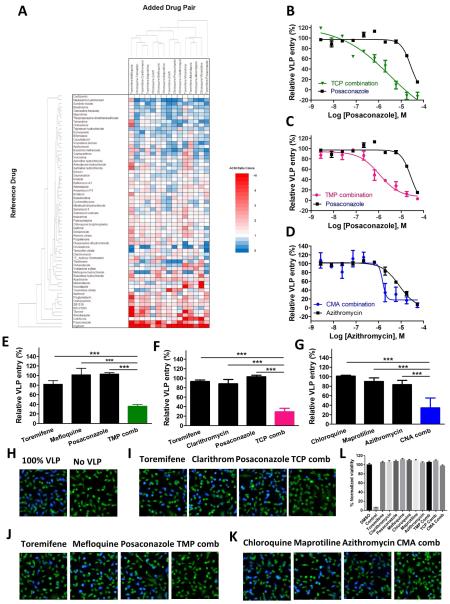
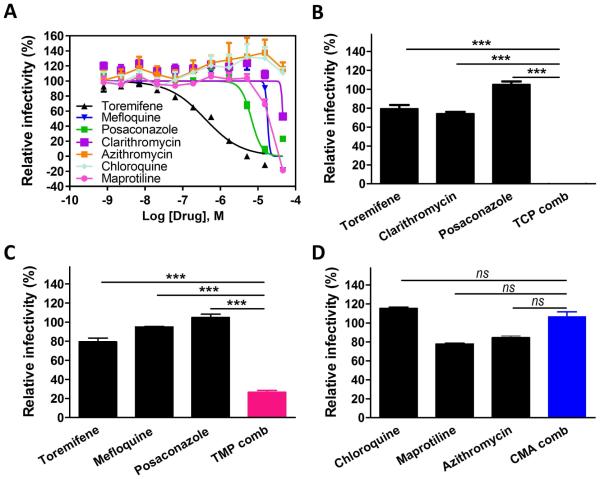
Although a group of FDA-approved drugs were previously identified with activity against Ebola virus (EBOV), most of them are not clinically useful because their human blood concentrations are not high enough to inhibit EBOV infection. We screened 795 unique three-drug combinations in an EBOV entry assay. Two sets of three-drug combinations, toremifene-mefloquine-posaconazole and toremifene-clarithromycin-posaconazole, were identified that effectively blocked EBOV entry and were further validated for inhibition of live EBOV infection. The individual drug concentrations in the combinations were reduced to clinically relevant levels. We identified mechanisms of action of these drugs: functional inhibitions of Niemann-Pick C1, acid sphingomyelinase, and lysosomal calcium release. Our findings identify the drug combinations with potential to treat EBOV infection.

Keywords: Drug combination; Drug repurposing; Ebola prevention; Ebola treatment; Polypharmacology.


Figures

Fig. 1
Fig. 1. Identifications of three-drug synergistic combinations from screening of FDA-approved drugs in the Ebola entry assay
(A) Heat map of triple drug combinations. Rows enumerate drug 1, columns enumerate drugs 2, 3 and heat map elements are ratios defined as AC50 (drug 1 alone)/AC50 (drugs 1 + 2 + 3). Color coding: Red = positive synergy (drug triple is more potent than drug 1 alone), white = no synergy (drug triple is equipotent to drug 1 alone), and blue = negative synergy (drug triple is less potent than drug 1 alone). (B-D) Shown are dose-response curves with respect to selected drugs. Three-drug combinations (green, red, or blue) verse single drug (black). TCP (0.15 μM toremifene, 2 μ M clarithromycin, and 4 μM posaconazole); TMP (0.15 μM toremifene, 2 μM mefloquine, and 4 μM posaconazole); CMA (2 μM chloroquine, 1 μ M maprotiline, and 1 μ M azithromycin). 0.15 μ M toremifene plus 2 μM clarithromycin and 0.15 μM toremifene plus 2 μM mefloquine sensitized the third drug posaconazole from IC50 of 24.9 μM (95% CI: 11.6 to 53.5 μ M) in the single drug application to 0.97 μM (95% CI: 0.35 to 2.69 μ M) and 1.08 μ M (95% CI: 0.53 to 2.22 μ M) in the three-drug combination, respectively. 2 μ M chloroquine with 1 μM maprotiline improved azithromycin from IC50 of 8.10 μM (95% CI: 4.82 to 13.6 μ M) in the single drug application to 1.53 μM (95% CI: 0.32 to 7.28 μM) in the three-drug combination. (E-G) Percentage of Ebola VLP inhibition at dose of each individual drug or three-drug combination. (H-K) Represented images of the inhibition of Ebola VLP entry by TCP, TMP and CMA using a high content assay. Magnification is x 20. (L) Cytotoxicity of individual drug and three-drug combinations. Cytotoxic control is 100 μM mefloquine. All experiments were performed in triplicate and data are representative of at least two independent experiments. Data are represented as mean±s.e.m. For D, E and F, ***P ≤ 0.001. P value indicates that the statistical significance was measured by Student’s t-test.
Fig. 2
Fig. 2. Synergistic inhibition of infection of Ebola live virus in Vero E6 cells by three-drug combinations
(A) Confirmatory dose-response curves of toremifene (dark line), mefloquine (blue line), posaconazole (green line), and clarithromycin (purple line) in inhibiting EBOV in Vero E6 cells using eGFP-EBOV assay. (B-D) Synergistic inhibition of EBOV infection by three-drug combination: TCP (0.15 μM toremifene, 2 μ M clarithromycin and 4 μM posaconazole), TMP (0.15 μM toremifene, 2 μM mefloquine and 4 μM posaconazole), and CMA (2 μ M chloroquine, 1 μM maprotiline and 1 μM azithromycin). All experiments were performed in triplicate and data are representative of at least two independent experiments. Data are represented as mean±s.e.m. For B, C and D, ***P ≤ 0.001. ns = difference is not statistically significant. P value indicates that the statistical significance was measured by Student’s t-test.
Fig. 3
Fig. 3. Assessment of mechanisms of drugs in perturbing Ebola-host interactions
(A) Inhibition of NAADP-AM stimulated calcium release by toremifene, mefloquine, posaconazole, and clarithromycin. Fibroblasts were loaded with NucBlue and Cal-520 (a calcium dye), treated with indicated drugs and then stimulated with NAADP-AM or HHBS. Cells showing Fmax/F0 > 2 (Fmax: maximum fluorescence intensity; F0: mean fluorescence intensity before stimulation) were counted as responsive cells. 150 cells were analyzed for each treatment. (B) Colocalization images of eGFP-Ebola with RFP-Lck (plasma membrane), RFP-Rab5a (early endosome), RFP-Rab7a (late endosome) or RFP-LAMP1 (lysosome). U2OS cells were treated with DMSO, EIPA, E-64D, U18666A, posaconazole, toremifene, mefloquine or clarithromycin (green: EBOV; red: organelle marker; blue: nuclei). (C and D) Drug effects on protease activities of cathepsin B and L. Recombinant cathepsin B or cathepsin L were treated with DMSO, Z-FA-FMK, cathepsin L inhibitor, toremifene, mefloquine, posaconazole, or clarithromycin. (E) Dose-response curves of toremifene (dark line), mefloquine (blue line), posaconazole (green line), and clarithromycin (purple line) in Amplex-red cholesterol assay in Hela cells. (F) Cholesterol accumulation induced by U18666A and posaconazole in fibroblasts (green: filipin; red: nuclei). (G) Lysosome enlargement induced by U18666A and posaconazole in fibroblasts (red: lysotracker; blue: nuclei). (H) Dose-response curves of toremifene (dark line), mefloquine (blue line), posaconazole (green line), and clarithromycin (purple line) in acid sphingomyelinase (ASM) assay in Hela cells. All experiments were performed in triplicate and data are representative of at least two independent experiments. Data are represented as mean±s.e.m.

References

    1. Clarithromycin. Tuberculosis (Edinb) 2008;88:92–95. - PubMed
    1. Abramowicz M, Zuccotti G, Pflomm JM. A 4-Drug Combination (Viekira Pak) for Hepatitis C. Jama-J Am Med Assoc. 2015;313:1857–1858. - PubMed
    1. Amini H, Ahmadiani A. Sensitive determination of clarithromycin in human plasma by high-performance liquid chromatography with spectrophotometric detection. J Chromatogr B Analyt Technol Biomed Life Sci. 2005;817:193–197. - PubMed
    1. Andersson DI, Hughes D. Antibiotic resistance and its cost: is it possible to reverse resistance? Nat Rev Microbiol. 2010;8:260–271. - PubMed
    1. Carette JE, Raaben M, Wong AC, Herbert AS, Obernosterer G, Mulherkar N, Kuehne AI, Kranzusch PJ, Griffin AM, Ruthel G, Dal Cin P, Dye JM, Whelan SP, Chandran K, Brummelkamp TR. Ebola virus entry requires the cholesterol transporter Niemann-Pick C1. Nature. 2011;477:340–U115. - PMC - PubMed

MeSH terms