. 2016 Nov 28:7:13525.
doi: 10.1038/ncomms13525.

Amplification of USP13 drives ovarian cancer metabolism

Affiliations

Amplification of USP13 drives ovarian cancer metabolism

Cecil Han et al. Nat Commun. .

Abstract

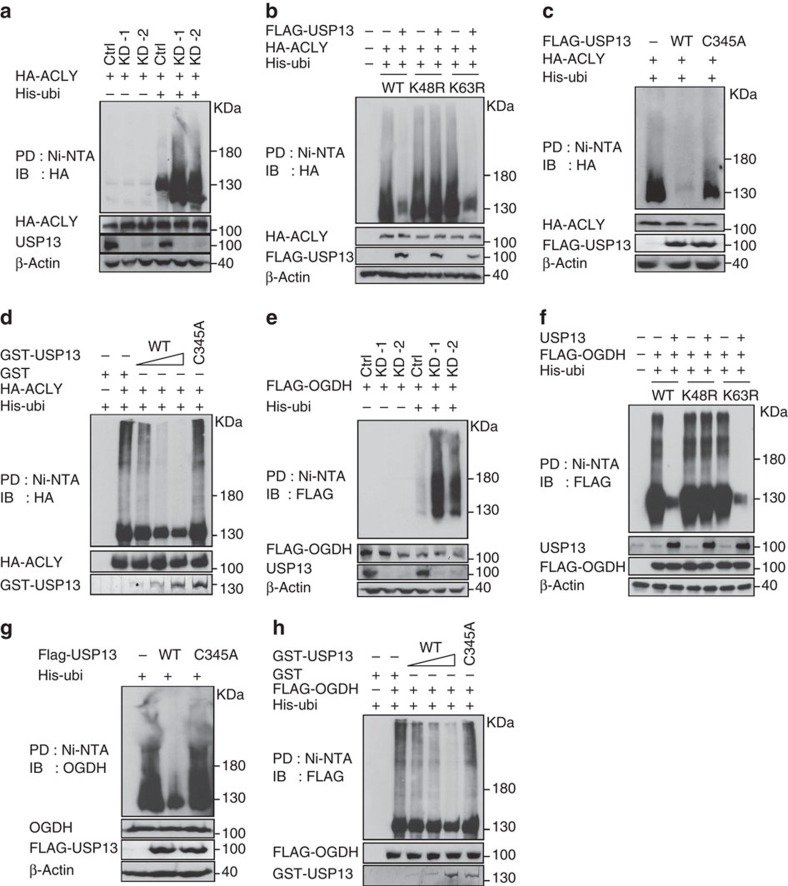
Dysregulated energetic metabolism has been recently identified as a hallmark of cancer. Although mutations in metabolic enzymes hardwire metabolism to tumourigenesis, they are relatively infrequent in ovarian cancer. More often, cancer metabolism is re-engineered by altered abundance and activity of the metabolic enzymes. Here we identify ubiquitin-specific peptidase 13 (USP13) as a master regulator that drives ovarian cancer metabolism. USP13 specifically deubiquitinates and thus upregulates ATP citrate lyase and oxoglutarate dehydrogenase, two key enzymes that determine mitochondrial respiration, glutaminolysis and fatty acid synthesis. The USP13 gene is co-amplified with PIK3CA in 29.3% of high-grade serous ovarian cancers and its overexpression is significantly associated with poor clinical outcome. Inhibiting USP13 remarkably suppresses ovarian tumour progression and sensitizes tumour cells to the treatment of PI3K/AKT inhibitor. Our results reveal an important metabolism-centric role of USP13, which may lead to potential therapeutics targeting USP13 in ovarian cancers.


Figures

Figure 1
Figure 1. Genomic amplification of USP13 is positively correlated with ovarian cancer progression.
(a) Genomic alterations of USP13 across human cancers determined by cBioportal analysis of TCGA databases. (b) Integrated analysis of USP13 amplification in 538 HGSC samples. Frequency plots of the copy-number abnormalities indicate degree of copy-number loss (red) or gain (blue). The colour intensity indicates the extent of copy-number changes. Representative genes in the amplicon of chromosome 3q26.2–3 are shown. (c) Positive correlation between USP13 and PI3KCA copy numbers. (d) Scatterplots of USP13 copy number versus messenger RNA expression in OVCA (left panel). USP13 expression levels are positively correlated with its gene copy numbers (right panel). (e) USP13 is highly expressed in ovarian tumours. Representative IHC-staining images of USP13 in a tissue microarray of OVCA and adjacent normal ovarian tissues (scale bar, 100 μm). Relative USP13 expression levels in ovarian tumours (136.7±11.29, n=118) were compared with that of normal tissues (37.27±13.15, n=16). (f) Western blot analysis of USP13 expression in normal ovarian tissues (n=8) and ovarian cancer tissue samples (n=21). USP13 blots were quantified by phosphoimaging and normalized to the levels of β-actin. (g) USP13 expression levels are positively correlated with ovarian tumour progression. Grade 1 (n=18), grade 2 (n=24) and grade 3 (n=38). Representative IHC-staining images of tissue samples are shown. (h) High expression of USP13 is associated with poor overall survival of patients with OVCA. Kaplan–Meyer plots for overall survival are shown. Tumour samples were divided into USP13 low group (n=84, intensity score from 10 to 150) and USP13 high group (n=84, score from 150 to 300). Box and whiskers indicate minimum to maximum percentiles in this figure: centre line, median value; upper box limit, 75% percentile; lower box limit, 25% percentile; whiskers, minimum or maximum values. Signals of immunohistochemistry data in tumour cells were visually quantified using a scoring system from 1 to 3, multiplied intensity of signal and percentage of positive cells (signal: 0=no signal, 1=weak signal, 2=intermediate signal and 3=strong signal; percentage: 10–100%). a.u., arbitrary unit. Unpaired t-test was used for statistical analyses in c, d, e, f and g. Log-rank (Mantel–Cox) test was used to analyse P value in h.
Figure 2
Figure 2. Inhibiting USP13 suppresses OVCA cell proliferation and tumourigenic potential.
(a) Genomic alteration frequency analysis shows USP13 amplification in 53 human OVCA cell lines. The colour intensity and copy-number changes are shown as described in Fig. 1b. (b) Copy number and protein expression of USP13 in seven representative cell lines were validated by quantitative PCR and immunoblotting. USP13 blots were quantified by phosphoimaging and normalized to the levels of β-actin. (c) Relative proliferation of OVCA cells stably expressing control or USP13 shRNAs. Control scramble shRNA was used as a negative control. Cells were cultured for 7 days with expression of shControl or shUSP13 and then stained by crystal violet. Representative crystal violet staining of OVCA cells were shown at the bottom. Unpaired t-test was used for statistical analysis. (n=3). (d) Tumour formation in mice transplanted with CAOV3 or HeyA8 cells expressing control or USP13 shRNAs. Mice were assessed at week 7 for CAOV3 and week 5 for HeyA8 (n=6 per group). Representative images show tumour growth and pattern of spread. Scale bars, 0.5 cm. Tumour weights and numbers of tumour nodules are shown at the bottom. Unpaired t-test was used for statistical analyses. (e) Depletion of USP13 sensitizes OVCA cells with high USP13 expression to the treatment of the AKT inhibitor, MK-2206. Unpaired t-test was used for statistical analysis.*P<0.05, **P<0.01, ***P<0.001, NS, nonsignificant. Error bars represent ±s.d. in this figure.
Figure 3
Figure 3. USP13 stabilizes ACLY and OGDH.
(a) USP13 physically interacts with ACLY and OGDH. Immunoprecipitation (IP) and western blot analyses were performed using indicated antibodies. Normal IgG was used as a negative control for IP. USP19 was used as a negative control DUB. WCL, whole-cell lysate. (b) Knockdown (KD) of USP13 decreases endogenous levels of ACLY and OGDH (left panel), while overexpression (OE) of USP13 increases their levels (right panel). (c) Enzymatically dead mutant of USP13 (C345A) fails to stabilize ACLY and OGDH. (d) Dox-induced USP13-KD decreases the levels of ACLY and OGDH in CAOV3 and HeyA8 cells. (e) Protein stability of ACLY and OGDH is reduced by USP13-KD. CAOV3 cells expressing control or USP13 shRNA were treated with cycloheximide (CHX, 100 μg ml−1) for indicated time points (n=3). Relative levels of ACLY and OGDH were quantified as a percentage of initial protein level. (f) USP13-KD does not affect the transcription of ACLY and OGDH (n=3). Unpaired t-test was used for statistical analysis. (g) USP13 overexpression induces deubiquitination of ACLY or OGDH. HEK293T cells were co-transfected with indicated expression vectors and treated with 5 μg ml−1 MG132 for 6 h before they were collected. His-tagged ubiquitin (His-ubi) were pulled down (PD) through nickel-charged magnetic agarose beads (Ni-NTA). Ubiquitinated proteins were PD and analysed by immunoblotting (IB) with anti-HA or anti-FLAG antibodies. Error bars represent ±s.d. in this figure. **P<0.01, ***P<0.001.
Figure 4
Figure 4. USP13 directly deubiquitinates ACLY and OGDH.
(a,e) USP13 knockdown (KD) increases the level of ubiquitinated ACLY (a) and OGDH (e). HEK293T cells expressing control and USP13 shRNAs were treated with MG132 and ubiquitinated ACLY or OGDH was pulled down (PD) and subject to immunoblotting (IB) analysis. (b,f) USP13-mediated deubiquitination acts on the lysine-48 (K48) ubiquitination of ACLY (b) and OGDH (f). HEK293T cells were co-transfected with the indicated expression vectors. Equal amounts of cell lysates were analysed by immunoprecipitation and IB assays as described above. (c,g) The C345A mutant form of USP13 fails to deubiquitinate ACLY (c) and OGDH (g). (d,h) USP13, but not the C345A mutant, deubiquitinates ACLY (d) and OGDH (h) in an in vitro deubiquitination assay. HEK293T cells were co-transfected with indicated expression vectors. The cells were treated with 5 μg ml−1 MG132 for 6 h before they were collected. Ubiquitinated ACLY or OGDH proteins immunopurified and incubated with varying amounts of bacterially purified GST-tagged USP13 in a deubiquitination buffer. His-tagged ubiquitin (His-ubi) were PD through nickel-charged magnetic agarose beads (Ni-NTA) under the denaturing condition (see Methods) and the ubiquitinated proteins were analysed by IB with anti-HA or anti-FLAG antibodies.
Figure 5
Figure 5. USP13 levels are positively correlated with the levels of ACLY and OGDH in ovarian tumours.
(a,b) A tissue microarray (TMA) of ovarian tumours were immunostained with antibodies against USP13, OGDH or ACLY, respectively. Immunohistochemical (IHC) signals are scored by multiplying the percentage of positive cells by the staining intensity (Signal: 0=no signal, 1=weak signal, 2=intermediate signal and 3=strong signal; percentage: 10–100%). a.u., arbitrary unit. Scale bars, 100 μm. Unpaired t-test (two-tailed) and Pearson r were used for statistical analysis. (c) Positive correlation between USP13 and ACLY or OGDH levels from IHC-staining analysis using human ovary tumour microarray samples.
Figure 6
Figure 6. Depletion of USP13 inhibits glutaminolysis and induces mitochondrial dysfunction.
(a) Schematic of carbon atom transitions using [U-13C] glutamine shows glutamine-driven oxidative metabolism into TCA cycle metabolites. (b) USP13 knockdown increases α-KG levels in CAOV3 and HeyA8 cells. Ctrl, shControl; KD-1, shUSP13-1; KD-2, shUSP13-2 (n=3, each group). α-KG is transaminated with the generation of pyruvate that is utilized to convert a nearly colourless probe to both colour (λmax=570 nm) and fluorescence (Ex/Em=535/587 nm). Unpaired t-test was used for statistical analysis. (c) Contribution of glutamine to TCA metabolites through oxidative metabolism and glutamate pool in control and USP13 knockdown HeyA8 and CAOV3 cells. Mass isotopologues distributions (MIDs, % of pool) of labelled metabolites are shown. (d) USP13 knockdown decreased NADH/NAD+ ratio. (e,f) USP13 knockdown inhibits OCR in CAOV3 (e) and HeyA8 (f) cells. Basal OCR is a measure of OXPHOS activity. Oligomycin, FCCP and antimycin were used to assess mitochondrial functional state in the cells through maximal mitochondrial capacities (Max) and respiratory control ratio (RCR). (g) USP13 knockdown decreases ATP levels in CAOV3 and HeyA8 cells. (h) Effect of glutamine on mitochondrial respiration in control and USP13 knockdown CAOV3 cells. (i) Schematic of carbon atom transitions using [U-13C] glucose. (j) Relative level of M2 fumarate, malate and citrate that are derived from [U-13C] glucose (Glc) in control and USP13 knockdown CAOV3 and HeyA8 cells. (k) Relative level of M4 fumarate, malate and citrate that are derived from [U-13C] glutamine (Gln) in control, OGDH knockdown, ACLY knockdown and OGDH/ACLY double knockdown HeyA8 cells. (I) Supplementing cells with dimethyl-aspartate, dimethyl-malate partially rescues proliferation of USP13 knockdown cells. In this figure, error bars represent ±s.e.m. and n≥6. *P<0.05, **P<0.01, ***P<0.001.
Figure 7
Figure 7. Depletion of USP13 inhibits ACLY in glutamine reductive carboxylation and lipid synthesis.
(a) Schematic of carbon atom transitions using [U-13C] glutamine shows glutamine-driven reductive metabolism into palmitate synthesis. (b) Ratio of intracellular α-KG over citrate levels. (c) Contribution of [U-13C] glutamine to TCA metabolites through reductive metabolism in control and USP13 knockdown CAOV3 cells, and in control and USP13-OE SKOV3 cells. Mass isotopologue distributions (MIDs; % of pool) of M5 citrate, M3 fumarate and M3 malate are shown. (d) Labelling of palmitate extracts from control and USP13-altered (knockdown or overexpressed) HeyA8 and SKOV3 cells. (e) Isotopologue spectral analysis (ISA) of glutamine's contribution to lipid synthesis. ISA shows that USP13 knockdown decreases glutamine's contribution to intracellular acetyl-CoA through reductive carboxylation. (f,g) USP13 knockdown decreases the incorporation of two major acetyl-CoA precursors, glutamine (f) and glucose (g), into lipid. (h) Labelling of palmitate from control, OGDH knockdown, ACLY knockdown and OGDH/ACLY double knockdown CAOV3 and HeyA8 cells cultured for 72 h in medium containing U-13C Gln. MID from U13-C5 Gln was measured. (i) Relative contribution of glutamine to de novo synthesized fatty acids in total fatty acids pool in CAOV3 and HeyA8 cells. (j) Supplementing cells with sodium acetate partially rescues proliferation of USP13 knockdown cells. (k) Schematic shows that USP13 knockdown inhibits OGDH and ACLY in OVCA cell metabolism. In this figure, error bars represent ±s.e.m. and n≥6. *P<0.05, **P<0.01, ***P<0.001.
Figure 8
Figure 8. Inhibiting USP13 suppresses ovarian tumour growth and metastasis in vivo.
(a) Suppression of USP13 significantly inhibits ovarian tumour growth. CAOV3 cells expressing Dox-inducible control or USP13 shRNA were injected intraperitoneally into female NOD/SCID mice. Tumour growth was monitored every 7 days (n=5 per time point). Dox treatment (red line) was initiated 14 days after injection. (b) Tumour weights and numbers of tumour nodules were measured in the CAOV3-derived tumours expressing Dox-inducible USP13 shRNA (n=10 per group) 7 weeks after transplantation. Representative images of mice bearing Dox-treated or -untreated tumours are shown. (c) Metastatic sites and frequency of ovarian tumours derived from control and USP13 knockdown CAOV3 cells. Other sites include the kidney and liver. Significant difference in the metastatic patterns of these two groups was compared by Fisher's exact test. (d) IHC-staining analysis of USP13, ACLY and OGDH in Dox-treated or -untreated ovarian tumours. Scale bars, 50 μm. The graph shows relative signal intensity scores of USP13, ACLY or OGDH. (e) Knockdown of ACLY or OGDH significantly inhibits ovarian tumour growth in vivo. ACLY or OGDH was stably knocked down in CAOV3 or HeyA8 cells. The non-silencing scramble shRNA was used as a control. Cells (1 × 10⁶) expressing control scramble shRNA, shACLY or/and shOGDH were intraperitoneally injected into female NOD/SCID mice (seven mice in each group). Tumour weights were measured at 4 weeks after inoculation. (f) Overexpression of ACLY and/or OGDH rescued the growth of USP13 knockdown ovarian tumours in vivo. Relative tumour weights compared with control groups were shown. ACLY or/and OGDH were stably overexpressed in CAOV3 and HeyA8 cells expressing shControl or shUSP13. Cells (1 × 10⁶) of each group were intraperitoneally injected into female NOD/SCID mice (seven mice in each group). Tumour weights were measured 4 weeks after inoculation. Ctrl, empty expression vector. In this figure, unpaired t-test (two-tailed) was used for statistical analysis. Error bars represent ±s.d. *P<0.05, **P<0.01, ***P<0.001, ****P<0.0001. NS, nonsignificant.
Figure 9
Figure 9. Knockdown of USP13 sensitizes ovarian tumours to the treatment of the AKT inhibitor.
(a) Effect of MK-2206 and USP13 knockdown on tumour growth in vivo. CAOV3 cells expressing Dox-induced USP13 shRNAs (1 × 10⁶) were injected intraperitoneally into female NOD/SCID mice (n=5). Fourteen days after cell injection, Dox (2 mg ml−1, 5% sucrose) treatment was initiated and 1 week later, MK-2206 at 120 mg kg−1 was administered by oral gavage (three times a week for 3 weeks). (b) Representative end-point tumour images (left) and tumour weights (right) in the four experimental groups (n=10). Scale bars, 1 cm. (c) Efficiency of USP13 knockdown by Dox and inhibition of AKT signalling by MK-2206 in vivo. Tumours were collected 6 h after MK-2206 treatment and analysed for the levels of pAKT (S473), total AKT and USP13 by western blot. (d) Expression of total AKT, phospho AKT (S473) and Ki-67 in the above tumours was assessed by IHC staining. HE, haematoxylin and eosin staining. Scale bars, 100 μm. (e) Percentages of total AKT, Phospho-AKT1 (S473) and Ki-67-positive cells in each treatment group were compared. In this figure, unpaired t-test (two-tailed) was used for statistical analysis. Error bars represent ±s.d. **P<0.01, ***P<0.001, ****P<0.0001.

Similar articles

Cited by

References

    1. Boroughs L. K. & DeBerardinis R. J. Metabolic pathways promoting cancer cell survival and growth. Nat. Cell Biol. 17, 351–359 (2015). - PMC - PubMed
    1. Vander Heiden M. G. Exploiting tumor metabolism: challenges for clinical translation. J. Clin. Invest. 123, 3648–3651 (2013). - PMC - PubMed
    1. Vander Heiden M. G., Cantley L. C. & Thompson C. B. Understanding the Warburg effect: the metabolic requirements of cell proliferation. Science 324, 1029–1033 (2009). - PMC - PubMed
    1. Yang L. et al.. Metabolic shifts toward glutamine regulate tumor growth, invasion and bioenergetics in ovarian cancer. Mol. Syst. Biol. 10, 728 (2014). - PMC - PubMed
    1. Possemato R. et al.. Functional genomics reveal that the serine synthesis pathway is essential in breast cancer. Nature 476, 346–350 (2011). - PMC - PubMed

Publication types

MeSH terms