. 2016 Nov 28:7:13636.
doi: 10.1038/ncomms13636.

Wnt5a induces renal AQP2 expression by activating calcineurin signalling pathway

Affiliations

Wnt5a induces renal AQP2 expression by activating calcineurin signalling pathway

Fumiaki Ando et al. Nat Commun. .

Abstract

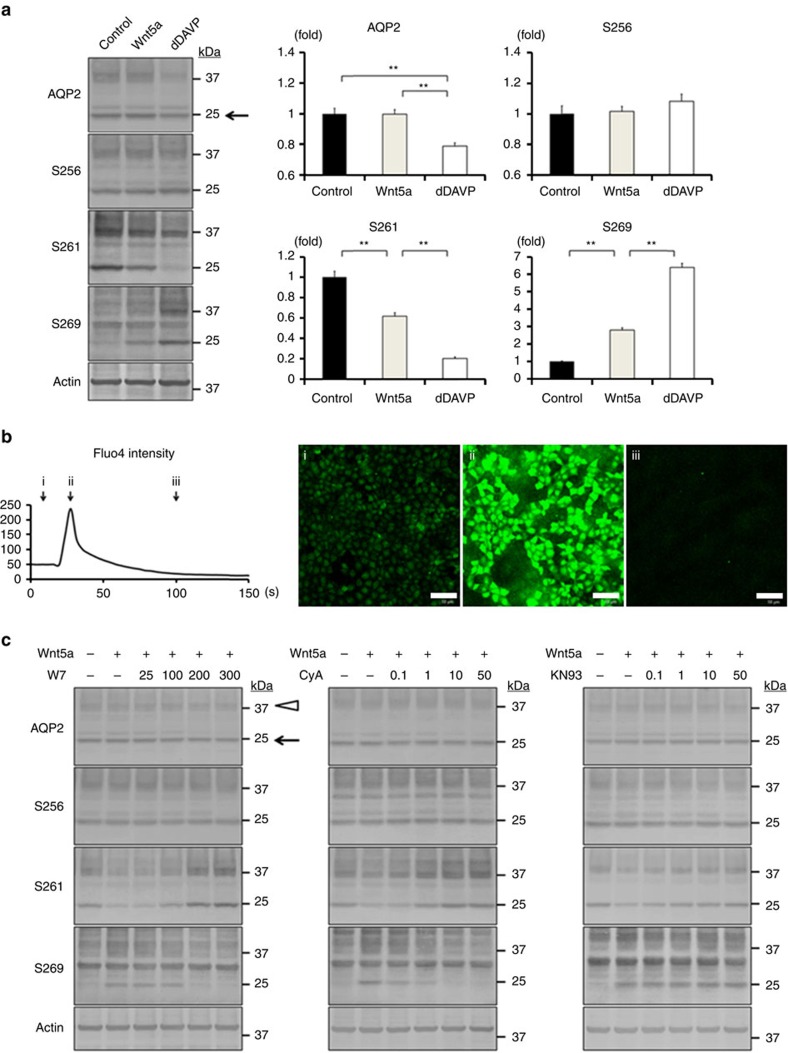
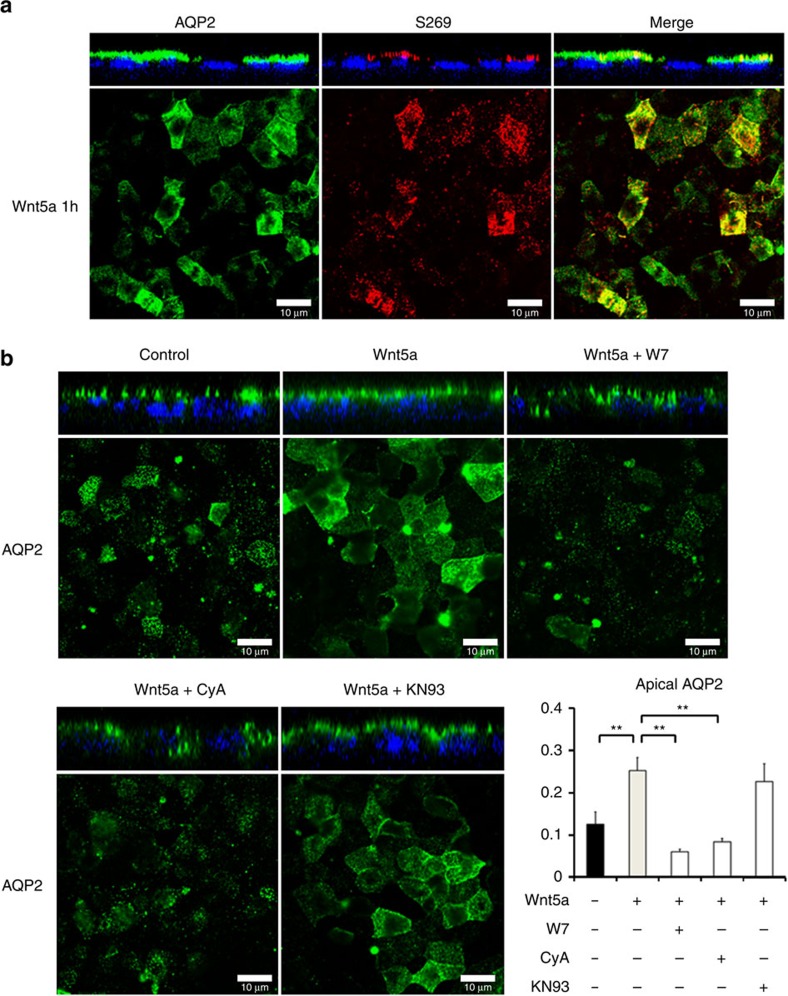
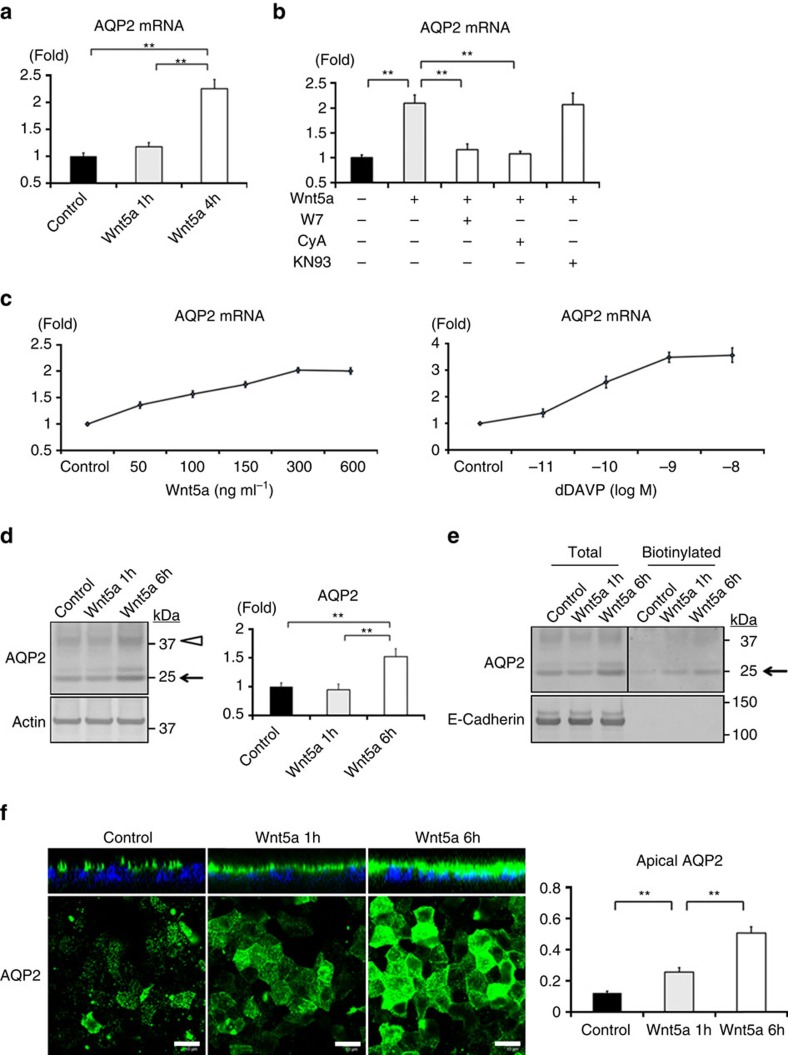
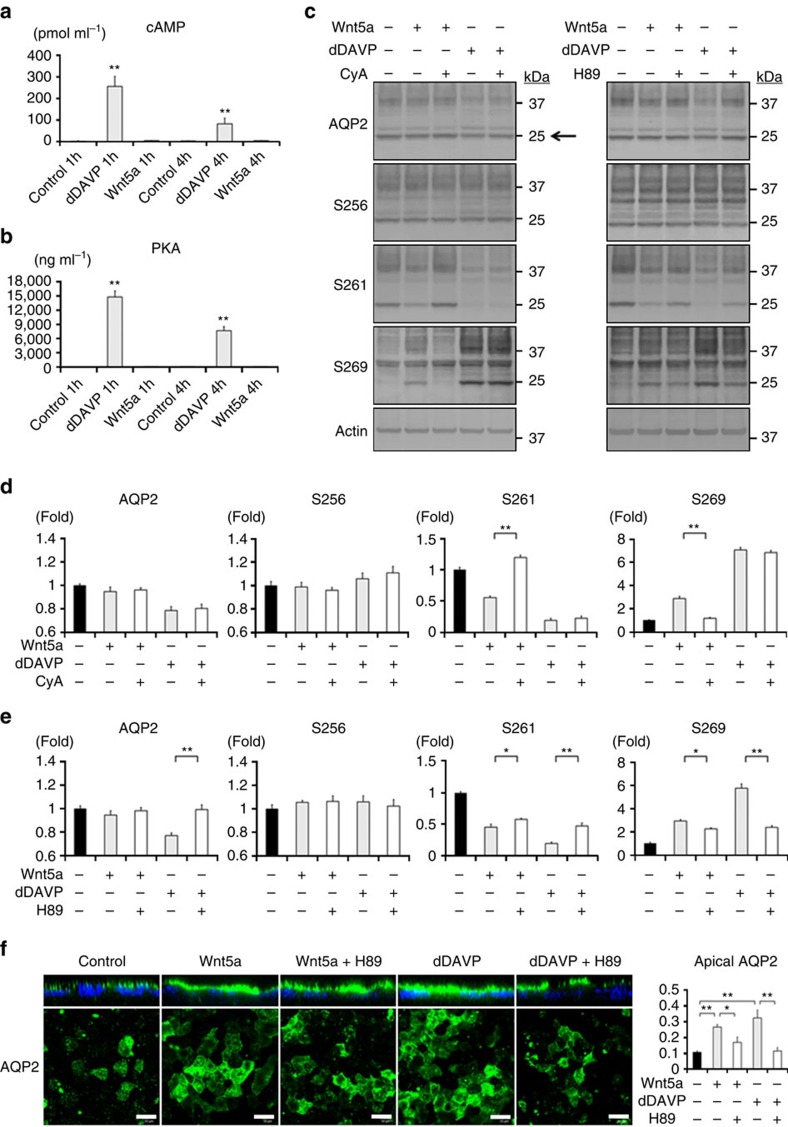
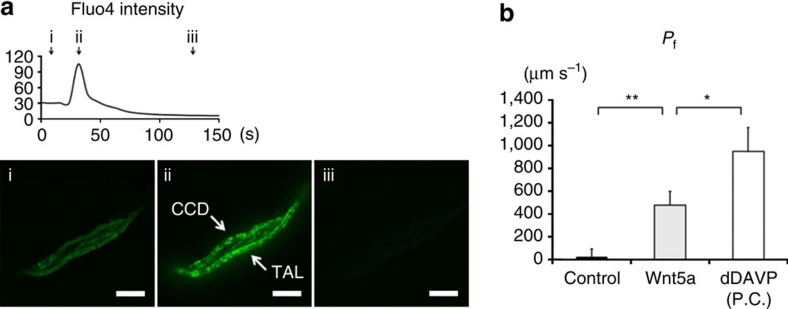
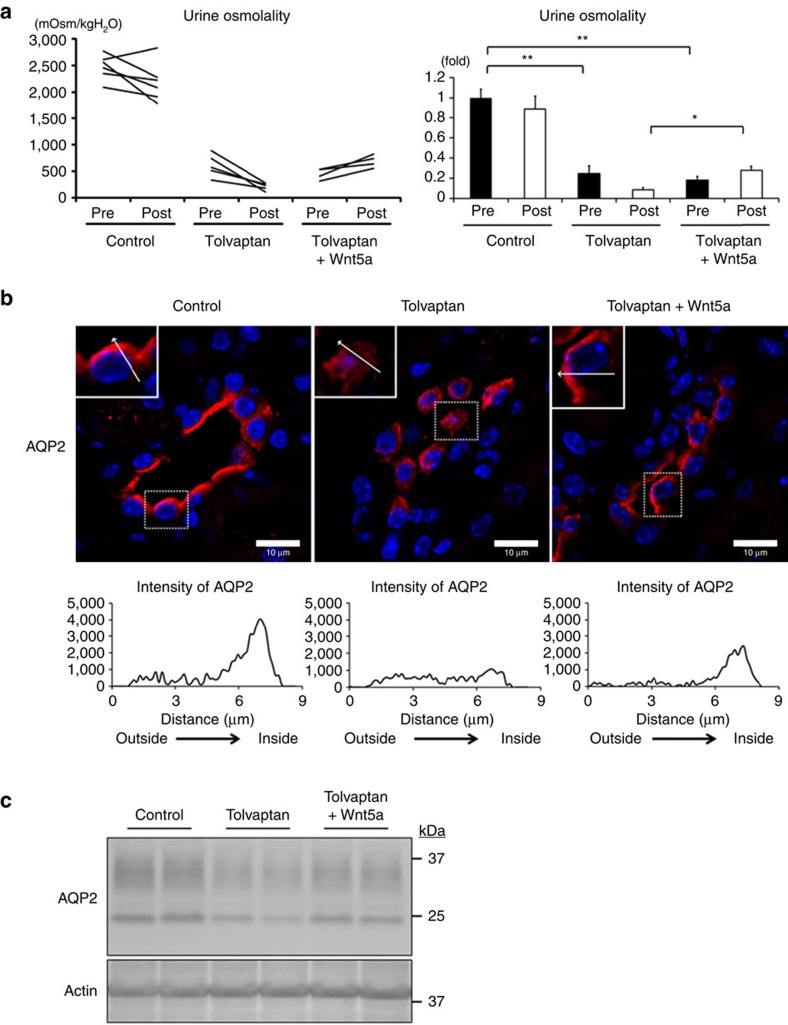
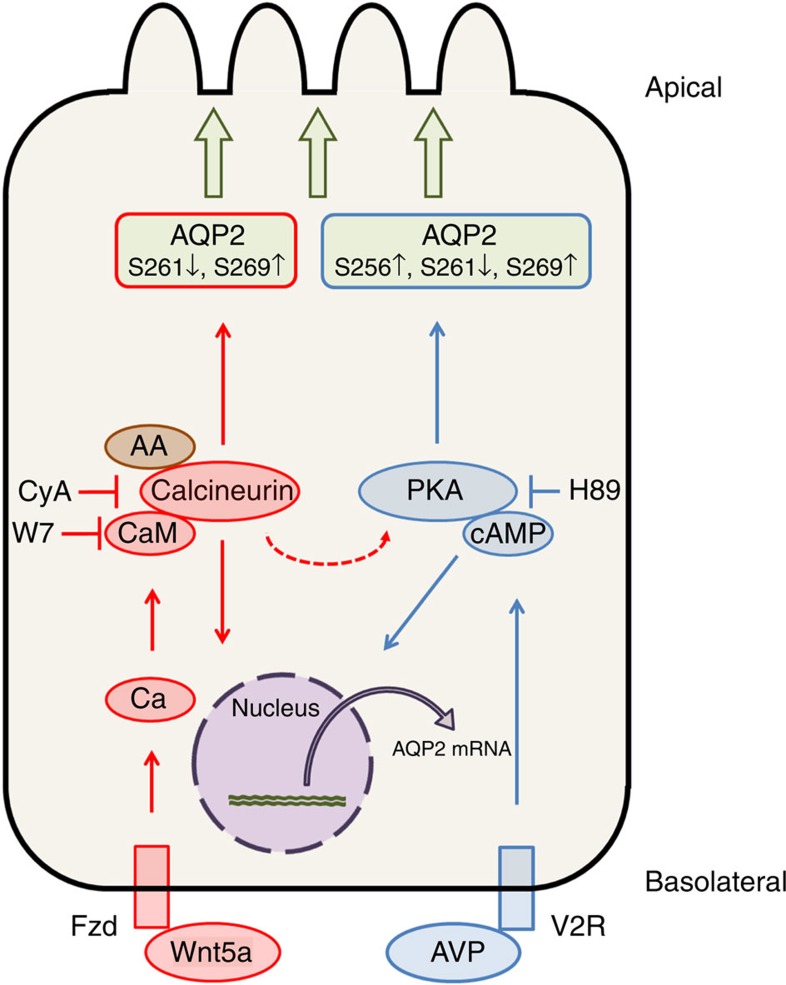
Heritable nephrogenic diabetes insipidus (NDI) is characterized by defective urine concentration mechanisms in the kidney, which are mainly caused by loss-of-function mutations in the vasopressin type 2 receptor. For the treatment of heritable NDI, novel strategies that bypass the defective vasopressin type 2 receptor are required to activate the aquaporin-2 (AQP2) water channel. Here we show that Wnt5a regulates AQP2 protein expression, phosphorylation and trafficking, suggesting that Wnt5a is an endogenous ligand that can regulate AQP2 without the activation of the classic vasopressin/cAMP signalling pathway. Wnt5a successfully increases the apical membrane localization of AQP2 and urine osmolality in an NDI mouse model. We also demonstrate that calcineurin is a key regulator of Wnt5a-induced AQP2 activation without affecting intracellular cAMP level and PKA activity. The importance of calcineurin is further confirmed with its activator, arachidonic acid, which shows vasopressin-like effects underlining that calcineurin activators may be potential therapeutic targets for heritable NDI.


Figures

Figure 1
Figure 1. Wnt5a alters AQP2 phosphorylation through the activation of calcium signalling.
(a) Western blot analysis of total and phosphorylated AQP2. (Left) Wnt5a (500 ng ml−1) or dDAVP (1 nM) was added to the basolateral side of the mpkCCD cells for 1 h. (Right) Non-glycosylated AQP2 bands (arrow) were quantified by densitometric analysis, and the results are presented in the bar graphs as fold change compared with the value in the control cells. Error bars are mean values±s.d. from three experiments. Tukey, **P<0.01. (b) The increase of Fluo4 intensity. (Left) Wnt5a (500 ng ml−1) was added to the mpkCCD cells. The time-course of Fluo4 fluorescence intensity is shown. The x axis indicates time, and the y axis indicates Fluo4 intensity. (Right) Representative confocal images at the indicated time (arrow) are shown. Scale bars, 50 μm. (c) Dose–response studies of W7, CyA, and KN93. Wnt5a (500 ng ml−1) was added in the presence or absence of W7 (25–300 μM), CyA (0.1–50 μM), or KN93 (0.1–50 μM) for 1 h. The mpkCCD cells were pretreated with each inhibitor for 45 min before Wnt5a stimulation. Representative blots of three independent experiments are shown.
Figure 2
Figure 2. Wnt5a promotes AQP2 trafficking through the activation of calcium signalling.
(a) The subcellular localization of total AQP2 and phosphorylated AQP2 at S269. The mpkCCD cells were treated with Wnt5a (500 ng ml−1) for 1 h, and the subcellular localization of AQP2 was then analysed by immunofluorescence using confocal microscopy. The larger panels display confocal sections of the apical regions of the cells. Z-stack confocal images are shown at the top of each panel. Representative confocal images of three independent experiments are shown. Scale bars, 10 μm. (b) The effects of W7, CyA and KN93 on Wnt5a-induced AQP2 trafficking. Wnt5a (500 ng ml−1) was added in the presence or absence of W7 (100 μM), CyA (10 μM), or KN93 (10 μM) for 1 h. The mpkCCD cells were pretreated with each inhibitor for 45 min before Wnt5a stimulation. Immunofluorescence staining of AQP2 was analysed as in a. Scale bars, 10 μm. Fluorescence intensities of apical AQP2 were quantified, and the results are presented in the bar graphs. Error bars are mean values±s.d. from three experiments. Tukey, **P<0.01.
Figure 3
Figure 3. Wnt5a increases AQP2 mRNA and protein expression.
(a) Wnt5a-induced AQP2 mRNA expression. The mpkCCD cells were treated with Wnt5a (500 ng ml−1) for 1 or 4 h. AQP2 mRNA expression was examined by quantitative real-time PCR. Results are presented as fold change compared with the value in the control cells. Error bars are mean values±s.d. from three experiments. Tukey, **P<0.01. (b) Inhibition of Wnt5a-induced AQP2 mRNA expression by W7 and CyA. Wnt5a (500 ng ml−1) was added to the mpkCCD cells in the presence or absence of W7 (50 μM), CyA (10 μM), or KN93 (10 μM) for 4 h. The mpkCCD cells were pretreated with each inhibitor for 45 min before Wnt5a stimulation. AQP2 mRNA expression was analyzed as in a. Bars are mean values±s.d. from four experiments. Tukey, **P<0.01. (c) Dose–response curves of AQP2 mRNA expression in response to Wnt5a or dDAVP. The mpkCCD cells were treated with the indicated concentrations of Wnt5a or dDAVP for 4 h. AQP2 mRNA expression was analyzed as in a. The x axis indicates the concentration of the Wnt5a or dDAVP, and the y axis indicates the relative fold change of the AQP2 mRNA. Each value is presented as mean±s.d. from three experiments. (d) Wnt5a-induced AQP2 protein expression. (Left) The mpkCCD cells were treated with Wnt5a (500 ng ml−1) for 1 or 6 h. (Right) Densitometric analysis of non-glycosylated AQP2 bands (arrow) are presented in the bar graphs as fold change compared with the value in the control cells. Error bars are mean values±s.d. from three experiments. Tukey, **P<0.01. (e) Biotinylation analysis of Wnt5a-induced apical AQP2 expression. The mpkCCD cells were treated with Wnt5a (500 ng ml−1) for 1 or 6 h. The amount of AQP2 in the apical plasma membrane was quantitated by apical surface biotinylation. Representative blots of three independent experiments are shown. (f) Immunofluorescent analysis of Wnt5a-induced apical AQP2 expression. (Left) The mpkCCD cells were treated with Wnt5a (500 ng ml−1) for 1 or 6 h. Immunofluorescence staining of AQP2 was analyzed as in Fig. 2. Scale bars, 10 μm. (Right) Fluorescence intensities of apical AQP2 were quantified, and the results are presented in the bar graphs. Error bars are mean values±s.d. from three experiments. Tukey, **P<0.01.
Figure 4
Figure 4. Wnt5a does not activate cAMP and PKA.
(a) No significant elevation of cAMP concentration in response to Wnt5a. The mpkCCD cells were treated with Wnt5a (500 ng ml−1) or dDAVP (1 nM) for 1 or 4 h. Error bars are mean values±s.d. from three experiments. Asterisk indicates a significant difference compared with control. Tukey, **P<0.01. (b) No significant elevation of PKA kinase activity in response to Wnt5a. The mpkCCD cells were treated with Wnt5a (500 ng ml−1) or dDAVP (1 nM) for 1 or 4 h. Error bars are mean values±s.d. from three experiments. Asterisk indicates a significant difference compared with control. Tukey, **P<0.01. (ce) The effects of CyA and H89 on AQP2 phosphorylation. Wnt5a (500 ng ml−1) or dDAVP (1 nM) was added in the presence or absence of CyA (10 μM) or H89 (50 μM) for 1 h. The mpkCCD cells were pretreated with each inhibitor for 45 min before Wnt5a or dDAVP stimulation. Non-glycosylated AQP2 bands (arrow) were quantified by densitometric analysis, and the results are presented in the bar graphs as fold change compared with the value in the control cells. Mean values±s.d. were determined from three experiments. Tukey, *P<0.05, **P<0.01. (f) The effects of CyA and H89 on AQP2 trafficking. (Left) Wnt5a (500 ng ml−1) or dDAVP (1 nM) was added in the presence or absence of CyA (10 μM), or H89 (50 μM) for 1 h. The mpkCCD cells were pretreated with each inhibitor for 45 min before Wnt5a or dDAVP stimulation. Immunofluorescence staining of AQP2 was analyzed as in Fig. 2. Scale bars, 10 μm. (Right) Fluorescence intensities of apical AQP2 were quantified, and the results are presented in the bar graphs. Error bars are mean values±s.d. from three experiments. Tukey, *P<0.05, **P<0.01.
Figure 5
Figure 5. Wnt5a increases intracellular calcium and osmotic water permeability in isolated CCD of mouse kidneys.
(a) The increase of Fluo4 intensity. (Upper) Wnt5a (500 ng ml−1) was added to the CCD cells dissected from mouse kidneys. The time-course of Fluo4 fluorescence intensity is shown. The x axis indicates time, and the y axis indicates Fluo4 intensity. (Lower) Representative confocal images at the indicated time (black arrow) are shown. Scale bars, 50 μm. TAL indicates thick ascending limb. (b) Pf in the mouse CCD. Wnt5a (500 ng ml−1) were added to isolated CCD tubules for 1 h. After Wnt5a washout, dDAVP (1 nM) was added to CCD for 15 min. Each value is an average of triplicate assays. P.C. indicates positive control. Mean values±s.e. were determined from six experiments. Student's t-test, *P<0.05, **P<0.01.
Figure 6
Figure 6. Wnt5a increases urine osmolality and apical AQP2 expression in an NDI mouse model.
(a) Increase in urine osmolality by Wnt5a in the tolvaptan-infused mice. (Left) The C57BL/6 mice were subcutaneously infused with tolvaptan (1.5 mg h−1 kg−1) or DMSO control for 2 days by osmotic minipumps. Tolvaptan-infused mice were intraperitoneally injected with Wnt5a (500 μg kg−1) or PBS, and DMSO-infused control mice were intraperitoneally injected with PBS. After the injection of Wnt5a or PBS, urine was collected within 2 h. (Right) The results are presented in the bar graphs as fold change compared with the value in the control. Tukey, *P<0.05, **P<0.01. (b) Immunofluorescence staining of AQP2 in tolvaptan-infused mouse kidneys. (Upper) The C57BL/6 mice were subcutaneously infused with tolvaptan or DMSO control as in a. Tolvaptan-infused mice were intraperitoneally injected with Wnt5a (500 μg kg−1) or PBS, and DMSO-infused control mice were intraperitoneally injected with PBS for 1 h. Representative collecting duct cells are enlarged in the inset at top left. Scale bars, 10 μm. (Lower) The relative intensities of AQP2 staining from outer to apical membrane (along the arrow) are shown. (c) Western blot analysis of the membrane fraction of AQP2 in mouse kidneys. The C57BL/6 mice were subcutaneously infused with tolvaptan or DMSO control as in a, and then intraperitoneally injected with Wnt5a or PBS as in b.
Figure 7
Figure 7. Schematic summary of Wnt5a signalling pathway in the regulation of AQP2.
Wnt5a activates intracellular calcium in the presence of Fzd receptors. Calcium-binding protein calmodulin (CaM) and calmodulin-mimicking protein AA stimulate calcineurin. Calcineurin alters AQP2 phosphorylation at S261 and S269 leading to the apical membrane trafficking of AQP2. Additionally, calcineurin increases AQP2 mRNA expression. On the other hand, vasopressin (AVP) binding to V2R increases intracellular cAMP concentration and activates PKA. cAMP upregulates AQP2 mRNA expression, and PKA along with other basophilic kinases alters AQP2 phosphorylation at S256, S261, and S269. Wnt5a activates AQP2 by different mechanisms of the vasopressin signalling pathway. Slight inhibitory effects of H89 on Wnt5a were also observed (Fig. 4e), suggesting the existence of crosstalk between Wnt5a signalling pathway and PKA.

References

    1. Moeller H. B., Rittig S. & Fenton R. A. Nephrogenic diabetes insipidus: essential insights into the molecular background and potential therapies for treatment. Endocr. Rev. 34, 278–301 (2013). - PMC - PubMed
    1. Nakada T., Miyauchi T., Sumiya H. & Shimazaki J. Nonobstructive urinary tract dilatation in nephrogenic diabetes insipidus. Int. Urol. Nephrol. 22, 419–427 (1990). - PubMed
    1. Bichet D. G. Nephrogenic diabetes insipidus. Adv. Chronic Kidney Dis. 13, 96–104 (2006). - PubMed
    1. Sasaki S., Chiga M., Kikuchi E., Rai T. & Uchida S. Hereditary nephrogenic diabetes insipidus in Japanese patients: analysis of 78 families and report of 22 new mutations in AVPR2 and AQP2. Clin. Exp. Nephrol. 17, 338–344 (2013). - PubMed
    1. Olesen E. T., Moeller H. B., Assentoft M., MacAulay N. & Fenton R. A. The vasopressin type-2 receptor and prostaglandin receptors EP2 and EP4 can increase aquaporin-2 plasma membrane targeting through a cAMP independent pathway. Am. J. Physiol. Renal Physiol. 311, F935–F944 (2016). - PubMed

Publication types

MeSH terms