. 2016 Nov 28:6:37594.
doi: 10.1038/srep37594.

Autophagy is required for PDAC glutamine metabolism

Affiliations

Autophagy is required for PDAC glutamine metabolism

Ju-Won Seo et al. Sci Rep. .

Abstract

Macroautophagy (autophagy) is believed to maintain energy homeostasis by degrading unnecessary cellular components and molecules. Its implication in regulating cancer metabolism recently started to be uncovered. However, the precise roles of autophagy in cancer metabolism are still unclear. Here, we show that autophagy plays a critical role in glutamine metabolism, which is required for tumor survival. Pancreatic ductal adenocarcinoma (PDAC) cells require both autophagy and typical glutamine transporters to maintain intracellular glutamine levels. Glutamine deprivation, but not that of glucose, led to the activation of macropinocytosis-associated autophagy through TFEB induction and translocation into the nucleus. In contrast, glutamine uptake increased as a compensatory response to decreased intracellular glutamine levels upon autophagy inhibition. Moreover, autophagy inhibition and glutamine deprivation did not induce cell death, while glutamine deprivation dramatically activated apoptotic cell death upon autophagy inhibition. Interestingly, the addition of α-ketoglutarate significantly rescued the apoptotic cell death caused by the combination of the inhibition of autophagy with glutamine deprivation. Our data suggest that macropinocytosis-associated autophagy is a critical process providing glutamine for anaplerosis of the TCA cycle in PDAC. Thus, targeting both autophagy and glutamine metabolism to completely block glutamine supply may provide new therapeutic approaches to treat refractory tumors.


Figures
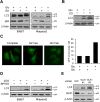
Figure 1
Figure 1. Glutamine, but not glucose, deprivation induces autophagy.
(A) PDAC cells were plated in complete medium, which was replaced the following day with glucose or glutamine-free medium and then incubated for another 24 h. Cell lysates were immunoblotted for LC3 and p62. (B) 8988 T cells were cultured in complete or glutamine free medium with or without CQ (10 μM) for 24 h and immunoblotted for LC3. (C) 8988 T cells were infected with a lentivirus expressing GFP-LC3, grown in complete, glucose-free, or glutamine-free medium for 24 h and analyzed for LC3 dots. (D) PDAC cells were treated with 2DG (10 mM) or BPTES (10 μM) for 24 h and immunoblotted for LC3. (E) Effect of GLS1 knockdown on LC3 levels in 8988 T cells expressing a control shRNA (shGFP) or glutaminase 1 shRNAs (shGLS1s).
Figure 2
Figure 2. Autophagy is required to maintain intracellular glutamine levels.
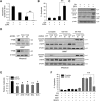
(A) PDAC cells were treated with CQ (10 μM) for 24 h. (B) Relative glutamine consumption rate of 8988 T cells expressing a control shRNA (shGFP) or a shRNA targeting ATG7. Western blot confirmed the knockdown of ATG7 expression. (C) WT MEFs and atg5−/− MEFs expressing KRas G12V were cultured in complete medium for 24 h. Western blot confirmed the knockdown of ATG5 expression. (AC) Glutamine levels were measured in the medium using a metabolite analyzer (BioProfile Basic100 analyzer) to monitor glutamine consumption. The glutamine consumption rate was presented after normalization by the number of cells. (D) 8988 T cells were plated in complete medium, which was replaced by glutamine-free medium the following day and then incubated for another 24 h with or without CQ (10 μM). Glutamine levels were monitored by using LC-MS/MS. (E) 8988 T cells expressing a control (shGFP) or ATG7 shRNA were cultured in complete or glutamine-free medium for 24 h and glutamine levels were monitored by using LC-MS/MS. Error bars represent the s.d. of triplicate wells from a representative experiment. **p < 0.01.
Figure 3
Figure 3. TFEB transcription factor regulates autophagy upon glutamine deprivation.
(A and B) The expression of TFEB was determined by quantitative RT-PCR (A) or western blot (B) in PDAC cells 24 h after supplementing with glucose or glutamine-free medium. (C) PDAC cells expressing a control (shGFP) or TFEB shRNAs (shTFEBs) were plated in the complete medium, which was replaced with glucose or glutamine-free medium the following day and then incubated for another 24 h. Cell lysates were immunoblotted for LC3 and p62. (D) Subcellular localization of GFP-TFEB in MIAPaCa2 was monitored by fluorescent microscopy analysis after incubating for 24 hr under either glutamine-replete or glutamine-free conditions, 20 μm. Error bars represent the s.d. of triplicate wells from a representative experiment. **p < 0.01.
Figure 4
Figure 4. Glutamine deprivation and autophagy inhibition exacerbate Ras mutant cell survival.
(A and B) 8988 T cells were plated in the complete medium, which was replaced with glucose or glutamine-free medium the following day and then incubated for another 24 h with or without CQ (10 μM). Cell death was assessed by using the annexin V/PI assay (A) and cleaved caspase-3 and -9 expression was assessed by immunoblotting (B). Error bars represent the s.d. of three separate experiments. (C) 8988 T cells were treated with CQ (10 μM) and BPTES (10 μM) alone, or in combination for 24 h and cell death was determined by using the annexin V/PI assay. Error bars represent the s.d. of three separate experiments. (D and E) 8988 T cells expressing a control (shGFP) or ATG7 shRNAs (shATGs) were plated in the complete medium, which was replaced with glucose or glutamine-free medium the following day and then incubated for another 24 h. Cell death was assessed by using the annexin V/PI assay (D) and cleaved caspase-3 and -9 expression was assessed by immunoblotting. ATG7 knockdown was confirmed by western blot (E). Error bars represent the s.d. of three separate experiments. (F and G) WT MEFs and atg5−/− MEFs expressing KRas G12V were plated in the complete medium, which was replaced with glutamine-free medium the following day and then incubated for another 24 h. Cell death was assessed by using the annexin V/PI assay (F) and immunoblotted for PARP and cleaved caspase-3 expression was assessed by immunoblotting (G). Error bars represent the s.d. of three separate experiments. (H) Subcutaneous MIAPaCa2-driven tumors were established in 6-week old male mice. CQ (20 mg kg−1 per day), BPTES (4 mg kg−1 per day) alone, or in combination, were administered daily via intraperitoneal injection. Tumor growth was assessed once the tumor volume reached 150 mm3. Data are shown as the mean of five mice in each group ± SEM. NS, not significant. **p < 0.01.
Figure 5
Figure 5
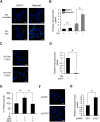
Glutamine deprivation increases macropinocytosis (A) Macropinocytosis was assessed in BxPC3 and MIAPaCa2 cells by monitoring the uptake of FITC-Dextran under either glutamine-replete or glutamine-free conditions. Scale bars, 20 μm. (B) The relative macropinocytic uptake of BxPC3 and MIAPaCa2 were quantified by image-based determination of the total macropinocytic vesicle area compared with the DAPI-stained area of cells. Data are expressed relative to the values of BxPC3 observed in the glutamine-free conditions. Data are shown as the mean of five images in each experiment ± SEM. (Error bars represent the SEM of values from five representative images per experiment) (C) Macropinocytic uptake of MIAPaCa2 cells induced by glutamine deprivation was inhibited by the treatment with EIPA (50 μM). (D) The levels of macropinocytic uptake of MIAPaCa2. MIAPaCa2 were quantified by image-based determination as shown in (B). Data are expressed relative to the values of MIAPaCa2 in the glutamine-free conditions. (E) MIAPaCa2 cells were cultured in glutamine deprivation medium for 6 days, either with or without 2% BSA and further with EIPA treatment. Growth levels were measured by cell counting. Data are expressed relative to the values observed in the glutamine-free conditions. (F) MIAPaCa2 cells expressing ATG7 shRNA and control shRNA were cultured in glutamine-free medium for 16 h after treatment with FITC-Dextran and macropinocytic degradation was determined by monitoring intracellular FITC-Dextran. Scale bars, 20 μm. (G) Levels of macropinocytic uptake of MIAPaCa2 cells were quantified by image-based determination as shown in (B). Data are relative to the values of MIAPaCa2 cells cultured in glutamine-free conditions. Error bars represent the SEM of triplicates from a representative experiment. *p < 0.05.
Figure 6
Figure 6. Inhibition of metabolic pathways providing substrates for the TCA cycle induces apoptotic cell death in PDAC.
(A) 8988Tcells were plated in the complete medium, which was replaced by glutamine-free medium the following day and then incubated for another 24 h with or without EIPA (25 μM). Glutamine levels were monitored by using LC-MS/MS. Error bars represent the s.d. of triplicate wells from a representative experiment. (B and C) PDAC cells were plated in the complete medium which was replaced by glutamine-free medium the following day and then incubated for another 24 h with or without EIPA (25 μM) for 24 h. Cell death was assessed by using the annexin V/PI assay (B) and cleaved-3, -9 and PARP expression was determined by immunoblotting (C). Error bars represent the s.d. of three separate experiments. (D) 8988 T cells expressing a control shRNA (shGFP) or TFEB shRNAs (shTFEBs) were plated in the complete medium, which was replaced by glucose or glutamine-free medium the following day and then incubated for another 24 h. Cell lysates were immunoblotted for cleaved caspase-3 and PARP. TFEB knockdown was confirmed by western blot. (E) TCA metabolite pools were analyzed by using LC-MS/MS in 8988 T cells expressing a control (shGFP) or ATG7 shRNA. Error bars represent the s.d. of triplicate wells from a representative experiment. (F) 8988 T cells were plated in the complete medium, which was replaced by glutamine-free medium supplemented with NAC (2 mM), GSH (2 mM), or MAKG (2 mM) in the absence or presence of CQ (10 μM) the following day and then incubated for another 24 h. NAC, N-acetylcysteine; GSH, glutathione; MAKG, dimethyl α-ketoglutarate. Error bars represent the s.d. of triplicate wells from a representative experiment. *p < 0.05; **p < 0.01.
Figure 7
Figure 7. Model of maintaining intracellular levels of glutamine via two parallel pathways, including macropinocytosis-associated autophagy and a canonical glutamine transportation pathway.

References

    1. Hezel A. F., Kimmelman A. C., Stanger B. Z., Bardeesy N. & Depinho R. A. Genetics and biology of pancreatic ductal adenocarcinoma. Genes & development 20, 1218–1249, doi: 10.1101/gad.1415606 (2006). - DOI - PubMed
    1. Ben-Josef E. & Lawrence T. S. Chemoradiotherapy for unresectable pancreatic cancer. International journal of clinical oncology 13, 121–126, doi: 10.1007/s10147-007-0763-x (2008). - DOI - PubMed
    1. Hidalgo M. Pancreatic cancer. The New England journal of medicine 362, 1605–1617, doi: 10.1056/NEJMra0901557 (2010). - DOI - PubMed
    1. Ward P. S. & Thompson C. B. Metabolic reprogramming: a cancer hallmark even warburg did not anticipate. Cancer cell 21, 297–308, doi: 10.1016/j.ccr.2012.02.014 (2012). - DOI - PMC - PubMed
    1. Vander Heiden M. G., Cantley L. C. & Thompson C. B. Understanding the Warburg effect: the metabolic requirements of cell proliferation. Science 324, 1029–1033, doi: 10.1126/science.1160809 (2009). - DOI - PMC - PubMed

Publication types

MeSH terms