

A Convolutional Neural Network for Automatic Characterization of Plaque Composition in Carotid Ultrasound
- PMID: 27893402
- PMCID: PMC5293622
- DOI: 10.1109/JBHI.2016.2631401
A Convolutional Neural Network for Automatic Characterization of Plaque Composition in Carotid Ultrasound
Abstract
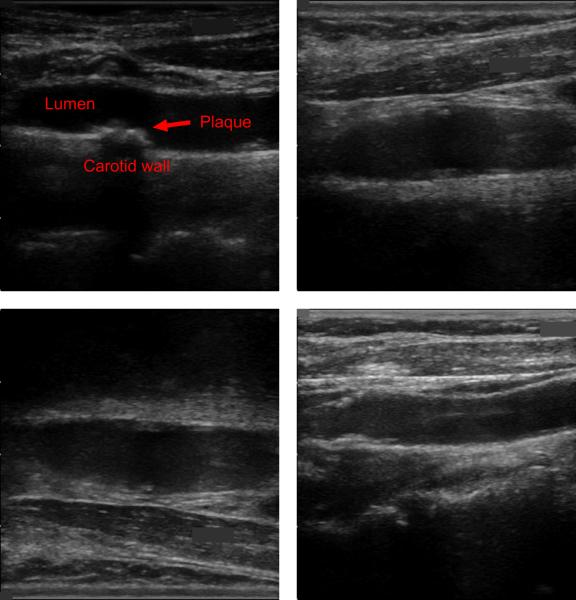
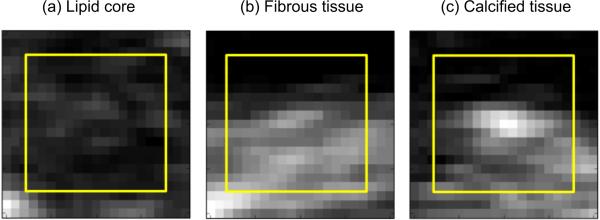
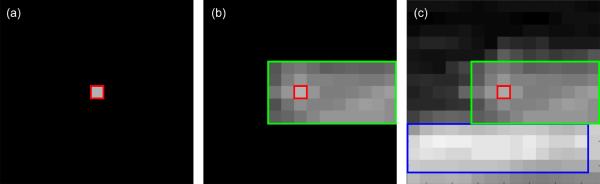
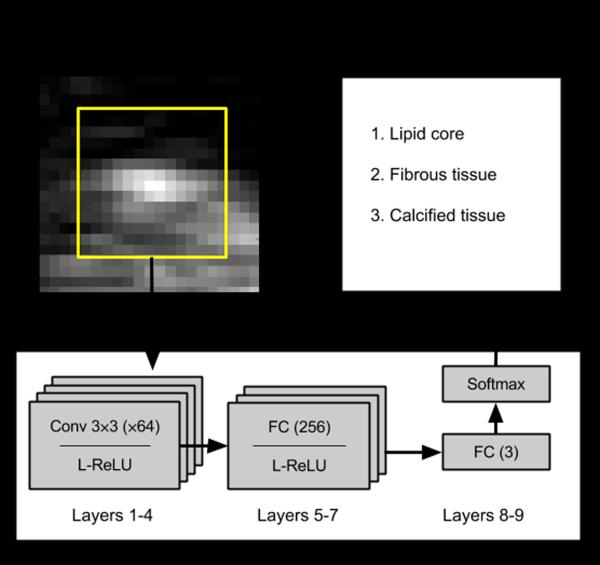
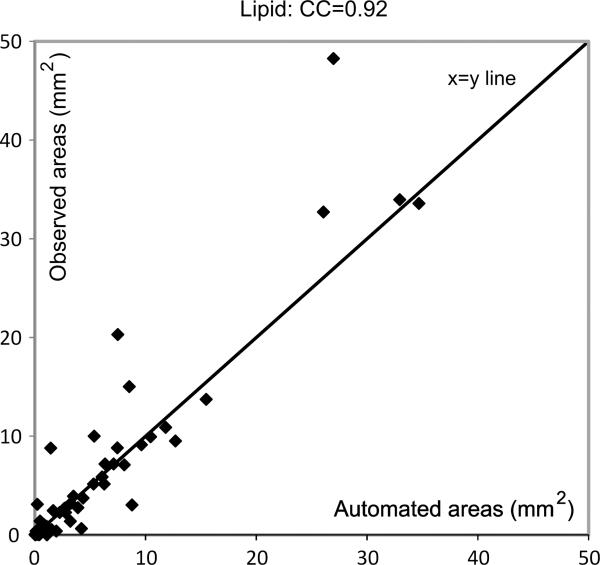
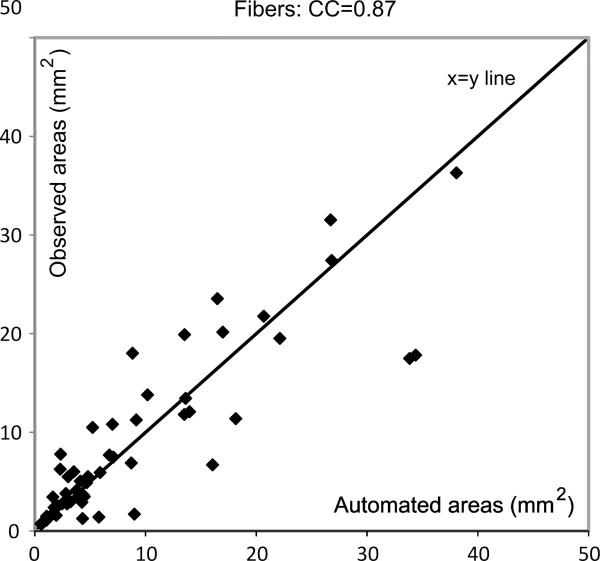
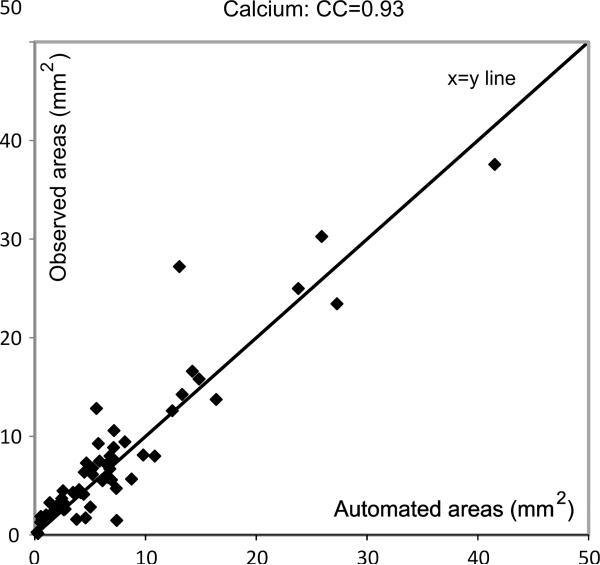
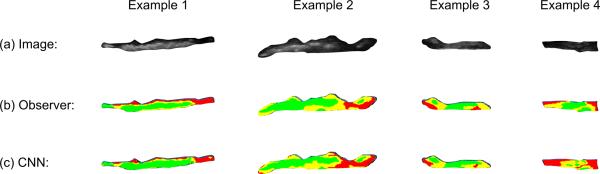
Characterization of carotid plaque composition, more specifically the amount of lipid core, fibrous tissue, and calcified tissue, is an important task for the identification of plaques that are prone to rupture, and thus for early risk estimation of cardiovascular and cerebrovascular events. Due to its low costs and wide availability, carotid ultrasound has the potential to become the modality of choice for plaque characterization in clinical practice. However, its significant image noise, coupled with the small size of the plaques and their complex appearance, makes it difficult for automated techniques to discriminate between the different plaque constituents. In this paper, we propose to address this challenging problem by exploiting the unique capabilities of the emerging deep learning framework. More specifically, and unlike existing works which require a priori definition of specific imaging features or thresholding values, we propose to build a convolutional neural network (CNN) that will automatically extract from the images the information that is optimal for the identification of the different plaque constituents. We used approximately 90 000 patches extracted from a database of images and corresponding expert plaque characterizations to train and to validate the proposed CNN. The results of cross-validation experiments show a correlation of about 0.90 with the clinical assessment for the estimation of lipid core, fibrous cap, and calcified tissue areas, indicating the potential of deep learning for the challenging task of automatic characterization of plaque composition in carotid ultrasound.
Figures
References
-
- Paiva L, Providencia R, Barra S, Dinis P, Faustino AC, Goncalves L. Universal definition of myocardial infarction: Clinical insights. Cardiol. 2015;131(1):13–21. - PubMed
-
- W. H. Organisation WHO: Stroke, Cerebrovascular accident. Stroke. 2011 [Online]. Available: http://www.who.int/topics/cerebrovascular_accident/en/
-
- Hippisley-Cox J, Coupland C, Vinogradova Y, Robson J, Brindle P. Performance of the QRISK cardiovascular risk prediction algorithm in an independent UK sample of patients from general practice: a validation study. Heart. 2008;94(1):34–39. - PubMed
-
- Wolf PA, D'Agostino RB, Belanger AJ, Kannel WB. Probability of stroke: a risk profile from the Framingham Study. Stroke. 1991;22(3):312–318. - PubMed
-
- Vancraeynest D, Pasquet A, Roelants V, Gerber BL, Vanoverschelde JLJ. Imaging the vulnerable plaque. J. Am. Coll. Cardiol. 2011;57(20):1961–1979. - PubMed
MeSH terms
Grants and funding
LinkOut - more resources
Full Text Sources
Other Literature Sources
Medical
Miscellaneous
