. 2017 May 18;36(20):2791-2801.
doi: 10.1038/onc.2016.439. Epub 2016 Nov 28.

MUC1-C activates BMI1 in human cancer cells

Affiliations

MUC1-C activates BMI1 in human cancer cells

M Hiraki et al. Oncogene. .

Abstract

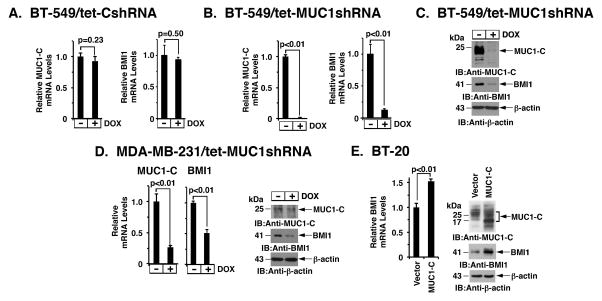
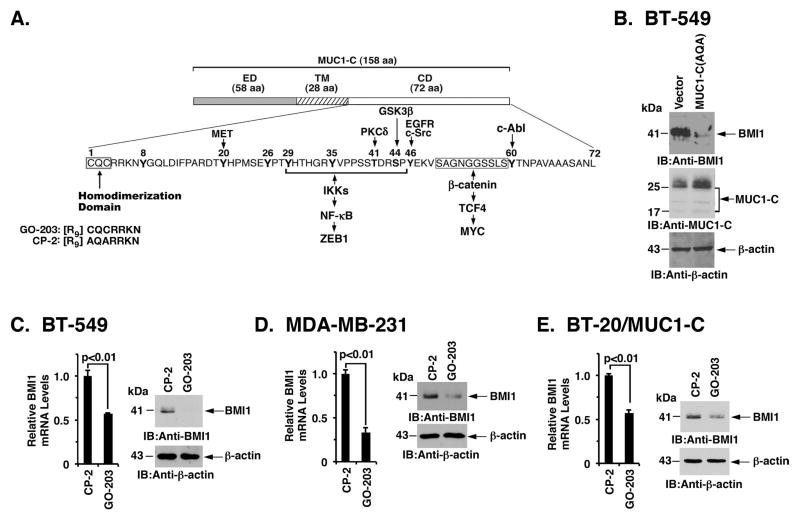
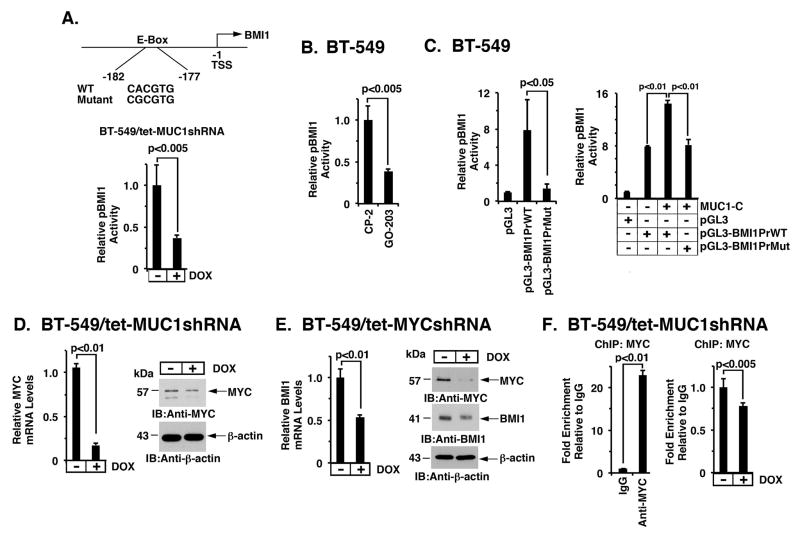
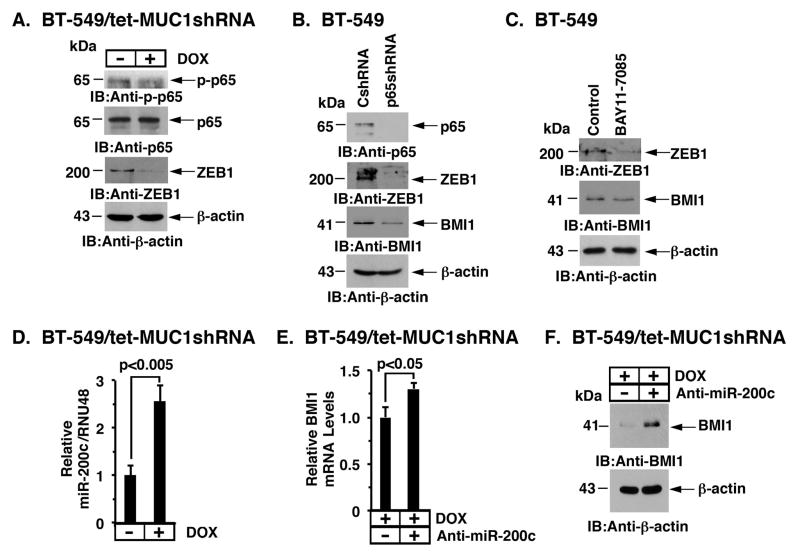
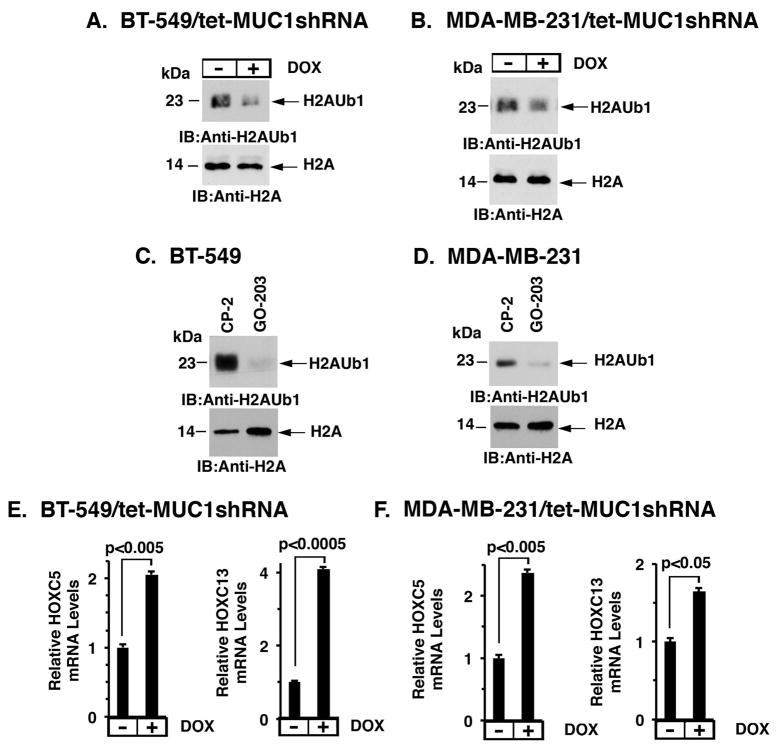
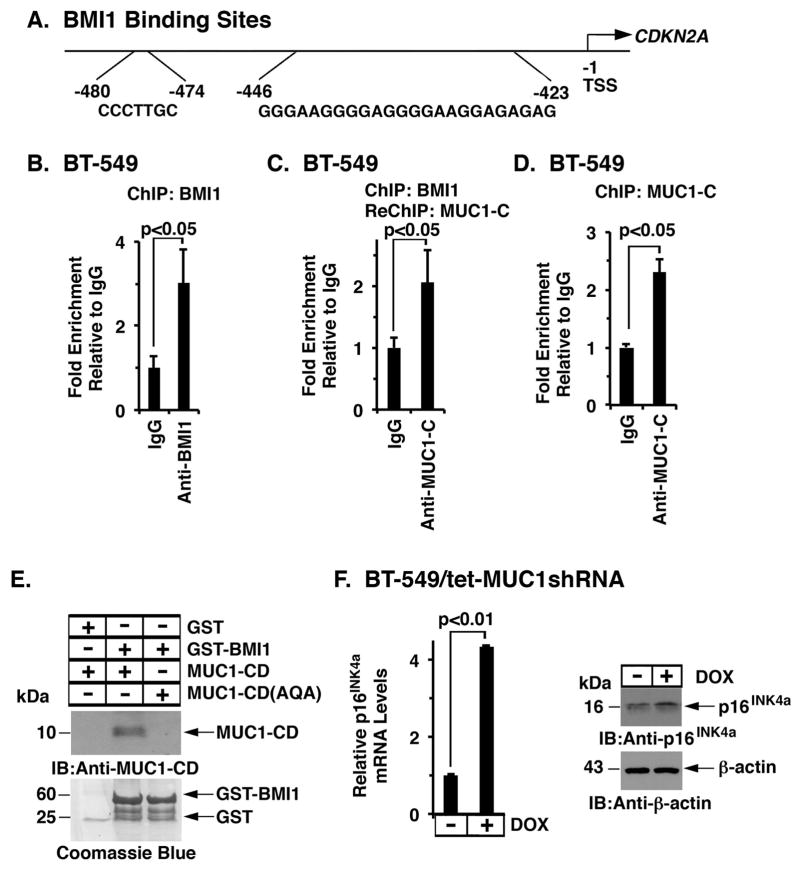
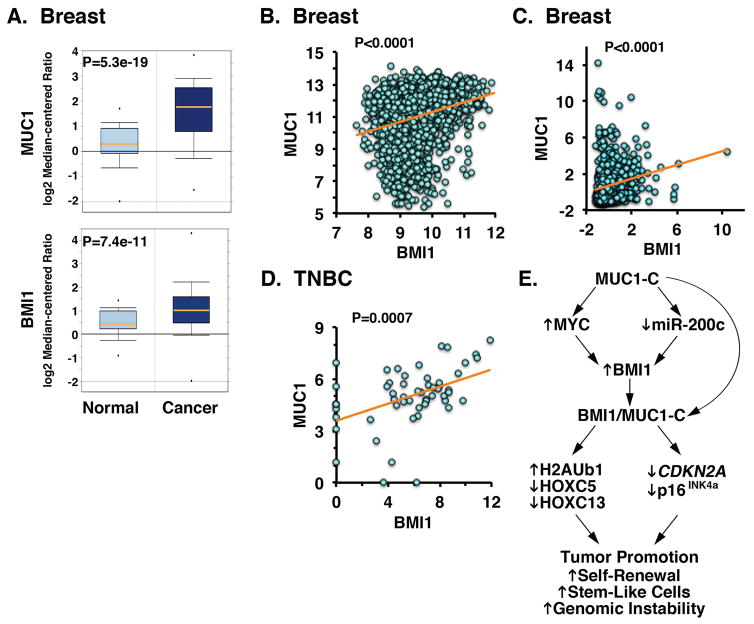
B-cell-specific Moloney murine leukemia virus integration site 1 (BMI1) is a component of the polycomb repressive complex 1 (PRC1) complex that is overexpressed in breast and other cancers, and promotes self-renewal of cancer stem-like cells. The oncogenic mucin 1 (MUC1) C-terminal (MUC1-C) subunit is similarly overexpressed in human carcinoma cells and has been linked to their self-renewal. There is no known relationship between MUC1-C and BMI1 in cancer. The present studies demonstrate that MUC1-C drives BMI1 transcription by a MYC-dependent mechanism in breast and other cancer cells. In addition, we show that MUC1-C blocks miR-200c-mediated downregulation of BMI1 expression. The functional significance of this MUC1-C→︀BMI1 pathway is supported by the demonstration that targeting MUC1-C suppresses BMI1-induced ubiquitylation of H2A and thereby derepresses homeobox HOXC5 and HOXC13 gene expression. Notably, our results further show that MUC1-C binds directly to BMI1 and promotes occupancy of BMI1 on the CDKN2A promoter. In concert with BMI1-induced repression of the p16INK4a tumor suppressor, we found that targeting MUC1-C is associated with induction of p16INK4a expression. In support of these results, analysis of three gene expresssion data sets demonstrated highly significant correlations between MUC1-C and BMI1 in breast cancers. These findings uncover a previously unrecognized role for MUC1-C in driving BMI1 expression and in directly interacting with this stem cell factor, linking MUC1-C with function of the PRC1 in epigenetic gene silencing.


Conflict of interest statement

Conflict of Interest

The authors declare competing financial interests: D.K. holds equity in Genus Oncology and is a consultant to the company. The other authors disclosed no potential conflicts of interest.

Figures

Figure 1
Figure 1. Silencing MUC1-C downregulates BMI1 expression
A–C. BT-549 cells were stably transduced to express a tetracycline-inducible control shRNA (tet-CshRNA) (A) or a MUC1 shRNA (tet-MUC1shRNA) (B). Cells treated with 200 ng/ml DOX for 4 d were analyzed for MUC1 and BMI1 mRNA levels by qRT-PCR. The results (mean±SD) are expressed as relative mRNA levels compared to that obtained for control DOX-untreated cells (assigned a value of 1). Cell lysates treated with 200 ng/ml DOX for 7 d were immunoblotted with the indicated antibodies (C). D. MDA-MB-231/tet-MUC1shRNA cells treated with 200 ng/ml DOX for 4 d were analyzed for MUC1 and BMI1 mRNA levels by qRT-PCR (left). Cell lysates treated with 200 ng/ml DOX for 7 d were immunoblotted with the indicated antibodies (right). E. BT-20 cells stably expressing a control or MUC1-C vector were analyzed for BMI1 mRNA levels by qRT-PCR. The results (mean±SD) are expressed as relative BMI1 mRNA levels compared to that obtained for vector cells (assigned a value of 1) (left). Lysates were immunoblotted with the indicated antibodies (right).
Figure 2
Figure 2. Targeting the MUC1-C cytoplasmic domain downregulates BMI1 expression
A. Schema of the MUC1-C subunit with the 58 aa extracellular domain (ED), the 28 aa transmembrane domain (TM), and the sequence of the 72 aa cytoplasmic domain (CD). The MUC1-C cytoplasmic domain contains a CQC motif that is necessary and sufficient for MUC1-C homodimerization and oncogenic function. GO-203 is a cell-penetrating peptide that binds the CQC motif and blocks MUC1-C homodimerization. Highlighted are MUC1-C-induced pathways that confer the activation of ZEB1 and MYC. B. BT-549 cells were transfected with a control or MUC1-C(AQA) vector in which the CQC motif had been mutated to AQA. Lysates were immunoblotted with the indicated antibodies. C–E. BT-549 (C), MDA-MB-231 (D), and BT-20/MUC1-C (E) cells treated with 5 μM CP-2 or 5 μM GO-203 for 12 h were analyzed for BMI1 mRNA levels by qRT-PCR. The results (mean±SD) are expressed as relative BMI1 mRNA levels compared to that obtained for CP-2 (assigned a value of 1) (left). Cell lysates treated with 5 μM CP-2 or 5 μM GO-203 for 48 h were immunoblotted with the indicated antibodies (right).
Figure 3
Figure 3. MUC1-C activates BMI1 transcription by a MYC-dependent mechanism
A. Schema of the BMI1 promoter region with positioning of the putative MYC binding site at −177 to −182 bp upstream of the transcription start site. The BMI1 promoter-luciferase (Luc) pGL3-BMI1PrWT vector includes the wild-type BMI1 promoter and pGL3-BMI1PrMut contains a mutation in the E-Box sequences (CACGTG has been mutated to CGCGTG)(upper panel). BT-549/tet-MUC1shRNA cells cultured with or without DOX for 5 d were transfected with the pGL3-Basic Luc or pGL3-BMI1PrWT reporter for 48 h and then analyzed for luciferase activity. The results (mean±SD of 3 determinations) are expressed as the relative luciferase activity compared to that obtained with pGL3-Basic Luc (assigned a value of 1)(lower panel). B. BT-549 cells were transfected with the pGL3-Basic Luc or pGL3-BMI1PrWT reporter for 6 h and then treated with 5 μM CP-2 or GO-203 for an additional 42 h. The results (mean±SD of 3 determinations) are expressed as the relative luciferase activity compared to that obtained with CP-2-treated cells (assigned a value of 1). C. BT-549 cells were transfected with the pGL3-Basic Luc, pGL3-BMI1PrWT or pGL3-BMI1PrMut reporter for 48 h and then analyzed for luciferase activity (left). BT-549 cells were transfected with (i) a control vector or one expressing MUC1-C, and (ii) the pGL3-Basic Luc, pGL3-BMI1PrWT or pGL3-BMI1PrMut reporter for 72 h and then analyzed for luciferase activity (right). The results (mean±SD of 3 determinations) are expressed as the relative luciferase activity compared to that obtained with pGL3-Basic Luc (assigned a value of 1). D. BT-549/tet-MUC1shRNA cells were treated with or without DOX for 5 d. MYC mRNA levels were determined by qRT-PCR. The results (mean±SD) are expressed as relative MYC mRNA levels compared to that obtained for control DOX-untreated cells (assigned a value of 1) (left). Lysates were immunoblotted with the indicated antibodies (right). E. BT-549/tet-MYCshRNA cells cultured with or without DOX for 12 h were analyzed for BMI1 mRNA levels by qRT-PCR. The results (mean±SD) are expressed as relative BMI1 mRNA levels compared to that obtained for control DOX-untreated cells (assigned a value of 1) (left). Cell lysates treated with DOX for 48 h were immunoblotted with the indicated antibodies (right). F. Soluble chromatin from BT-549/tet-MUC1shRNA cells was precipitated with anti-MYC or a control IgG (left). The final DNA samples were amplified by qPCR with primers for the BMI1 promoter. The results (mean±SD of three determinations) are expressed as the relative fold enrichment compared with that obtained with the IgG control (assigned a value of 1). Soluble chromatin from 549/tet-MUC1shRNA cells cultured with or without DOX for 5 d was precipitated with anti-MYC or a control IgG. The final DNA samples were amplified by qPCR. The results (mean±SEM of three determinations) are expressed as the relative fold enrichment compared to that obtained for control DOX-untreated cells (assigned a value of 1) (right).
Figure 4
Figure 4. MUC1-C blocks miR-200c-mediated downregulation of BMI1 expression
A. BT-549/tet-MUC1shRNA cells were treated with or without DOX for 4 d. Lysates were immunoblotted with the indicated antibodies. B. BT-549 cells were transduced with lentiviral vectors to stably express a control shRNA (CshRNA) or a NF-κB p65 shRNA. Lysates were immunoblotted with the indicated antibodies. C. BT-549 cells were treated with control DMSO vehicle or BAY-11-7085 for 16 h. Lysates were immunoblotted with the indicated antibodies. D. BT-549/tet-MUC1shRNA cells were treated with or without DOX for 4 d. The cells were analyzed for miR-200c levels by qRT-PCR. The results (mean±SD) are expressed as relative miR-200c/RNU48 levels compared to that obtained for control DOX-untreated cells (assigned a value of 1). E and F. BT-549/tet-MUC1shRNA cells cultured with DOX for 7 d were transfected with 12.5 nM anti-miR-200c or a negative control oligonucleotide for 4 d. The cells were then analyzed for BMI1 mRNA levels by qRT-PCR. The results (mean±SD) are expressed as relative BMI1 mRNA levels compared to that obtained for control anti-miR-200c-untreated cells (assigned a value of 1) (E). Lysates were immunoblotted with the indicated antibodies (F).
Figure 5
Figure 5. Targeting MUC1-C decreases ubiquitylation of H2A and derepresses HOX gene expression
A and B. BT-549/tet-MUC1shRNA (A) and MDA-MB-231/tet-MUC1shRNA (B) cells were treated with or without DOX for 5 d. Lysates were immunoblotted with the indicated antibodies. C and D. BT-549 (C) and MDA-MB-231 (D) cells were treated with 5 μM CP-2 or 5 μM GO-203 for 48 h. Lysates were immunoblotted with the indicated antibodies. E and F. BT-549/tet-MUC1shRNA (E) and MDA-MB-231/tet-MUC1shRNA (F) cells were treated with or without DOX for 7 d. HOXC5 (left) and HOXC13 (right) mRNA levels were determined by qRT-PCR. The results (mean±SD) are expressed as relative mRNA levels compared to that obtained for control DOX-untreated cells (assigned a value of 1).
Figure 6
Figure 6. MUC1-C/BMI1 complexes occupy the CDKN2A promoter
A. Schema of the CDKN2A promoter with positioning of the BMI1-response element (BRE) at −423 to −446 and −474 to −480 bp upstream to the transcription start site. B. Soluble chromatin from BT−549 cells was precipitated with anti-BMI1 or a control IgG. C. In the re-ChIP analysis, BMI1 precipitates were released and re-immunoprecipitated with anti-MUC1-C and a control IgG. D. Soluble chromatin from BT-549 cells was precipitated with anti-MUC1-C or a control IgG. The final DNA samples were amplified by qPCR with primers for the CDKN2A promoter. The results (mean±SD of three determinations) are expressed as the relative fold enrichment compared with that obtained with the IgG control (assigned a value of 1). E. GST and GST-BMI1 were incubated with either purified MUC1-CD or MUC1-CD(AQA). The adsorbates were immunoblotted with anti-MUC1-C. Input of the GST proteins was assessed by Coomassie blue staining. F. BT-549/tet-MUC1shRNA cells were treated with or without DOX for 7 d. p16INK4a mRNA levels were determined by qRT-PCR. The results (mean±SD) are expressed as relative p16INK4a mRNA levels compared to that obtained for control DOX-untreated cells (assigned a value of 1) (left). Cell lysates cultured with or without DOX for 12 d were immunoblotted with the indicated antibodies (right).
Figure 7
Figure 7. Correlation between MUC1 and BMI1 in breast cancer samples
A. Microarray data from Oncomine database are expressed as box plots (25th–75th percentiles) for MUC1 (upper panel) and BMI1 (lower panel) expression in normal breast tissues (n=61) and breast cancer samples (n=389). B–D. MUC1 and BMI1 gene expression data from METABRIC (B; n=1980), TCGA (C; n=528), and GSE41970 (D; n=54) datasets was assessed for correlation using the Pearson’s correlation coefficient, where p<0.05 was considered as statistically significant. E. Schema depicting the proposed effects of MUC1-C on BMI1 expression and function. MUC1-C drives BMI1 expression by (i) inducing MYC and in turn MYC-mediated activation of the BMI1 gene, and (ii) downregulating miR-200c and thereby inhibiting the suppressive effects of miR-200c on BMI1 mRNA. As a result, MUC1-C promotes the ubiquitylation of H2A and repression of HOXC5 and HOXC13. MUC1-C also interacts directly with BMI1 and contributes to repression of the CDKN2A promoter and suppression of p16INK4a expression. These findings and the demonstration that MUC1 and BMI1 significantly correlate in breast tumors supports the notion that MUC1-C is, at least in part, responsible for the upregulation of BMI1 in human cancers, which has been linked to tumor promotion by increasing self-renewal capacity, cancer stem-like cells and genomic instability.

References

    1. Park IK, Morrison SJ, Clarke MF. Bmi1, stem cells, and senescence regulation. J Clin Invest. 2004;113:175–179. - PMC - PubMed
    1. Siddique HR, Saleem M. Role of BMI1, a stem cell factor, in cancer recurrence and chemoresistance: preclinical and clinical evidences. Stem Cells. 2012;30:372–8. - PubMed
    1. Wang H, Wang L, Erdjument-Bromage H, Vidal M, Tempst P, Jones RS, et al. Role of histone H2A ubiquitination in Polycomb silencing. Nature. 2004;431:873–8. - PubMed
    1. de Napoles M, Mermoud JE, Wakao R, Tang YA, Endoh M, Appanah R, et al. Polycomb group proteins Ring1A/B link ubiquitylation of histone H2A to heritable gene silencing and X inactivation. Dev Cell. 2004;7:663–76. - PubMed
    1. Cao R, Tsukada Y, Zhang Y. Role of Bmi-1 and Ring1A in H2A ubiquitylation and Hox gene silencing. Mol Cell. 2005;20:845–54. - PubMed

Publication types

MeSH terms