. 2016 Nov 28;12(11):e1006030.
doi: 10.1371/journal.ppat.1006030. eCollection 2016 Nov.

T Cell Receptor Vβ Staining Identifies the Malignant Clone in Adult T cell Leukemia and Reveals Killing of Leukemia Cells by Autologous CD8+ T cells

Affiliations

T Cell Receptor Vβ Staining Identifies the Malignant Clone in Adult T cell Leukemia and Reveals Killing of Leukemia Cells by Autologous CD8+ T cells

Aileen G Rowan et al. PLoS Pathog. .

Abstract

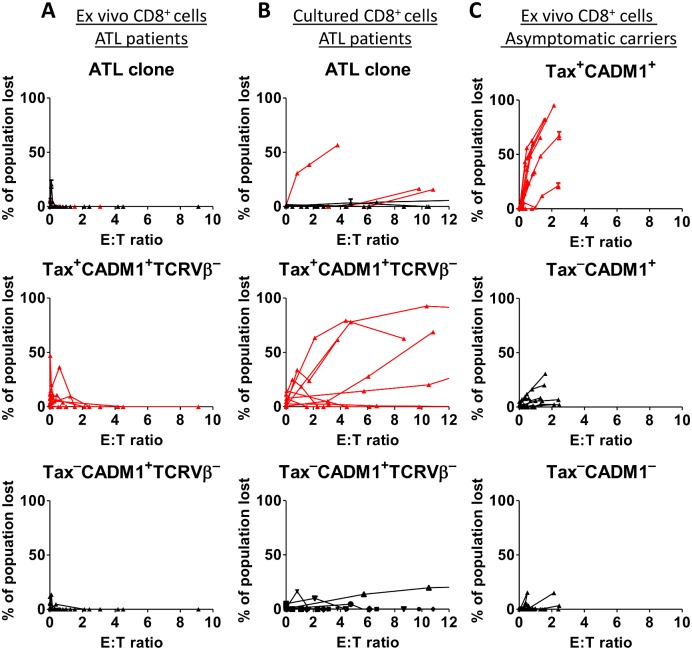
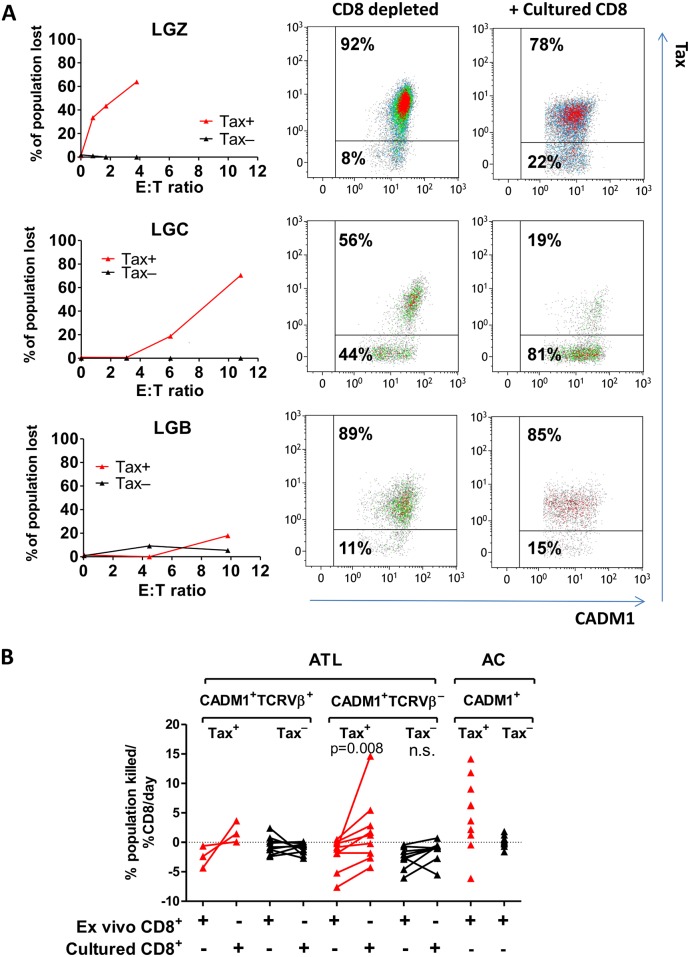
There is growing evidence that CD8+ cytotoxic T lymphocyte (CTL) responses can contribute to long-term remission of many malignancies. The etiological agent of adult T-cell leukemia/lymphoma (ATL), human T lymphotropic virus type-1 (HTLV-1), contains highly immunogenic CTL epitopes, but ATL patients typically have low frequencies of cytokine-producing HTLV-1-specific CD8+ cells in the circulation. It remains unclear whether patients with ATL possess CTLs that can kill the malignant HTLV-1 infected clone. Here we used flow cytometric staining of TCRVβ and cell adhesion molecule-1 (CADM1) to identify monoclonal populations of HTLV-1-infected T cells in the peripheral blood of patients with ATL. Thus, we quantified the rate of CD8+-mediated killing of the putative malignant clone in ex vivo blood samples. We observed that CD8+ cells from ATL patients were unable to lyse autologous ATL clones when tested directly ex vivo. However, short in vitro culture restored the ability of CD8+ cells to kill ex vivo ATL clones in some donors. The capacity of CD8+ cells to lyse HTLV-1 infected cells which expressed the viral sense strand gene products was significantly enhanced after in vitro culture, and donors with an ATL clone that expressed the HTLV-1 Tax gene were most likely to make a detectable lytic CD8+ response to the ATL cells. We conclude that some patients with ATL possess functional tumour-specific CTLs which could be exploited to contribute to control of the disease.


Conflict of interest statement

The authors have declared that no competing interests exist.

Figures

Fig 1
Fig 1. Flow cytometric staining of TCRVβ subunits reveals clonal expansions in ATL patients.
Cryopreserved PBMCs from 52 individuals (28 ATL; 11 AC; 13 HAM) were thawed and stained with a viability stain followed by antibodies specific for 24 TCRVβ subunits, CD3, CD4, CD8, CADM1, CD7, CD127, CD25 and CCR4. Proviral genomic integration sites were mapped by LM-PCR and HTS. OCI was calculated using the Gini index, as previously described [12]. (A) Representative data from one individual with chronic ATL, and one high PVL AC. Pie charts show the relative frequency distribution of unique integration sites (green), and CD3+ cells (TCRVβ identified: CD4+, red; CD8+, blue; TCRVβ ‘off panel’: CD4+, light grey; CD8+, dark grey). (B) OCI-flow of CADM1+CD3+ cells versus OCI-flow of CADM1CD3+ cells. Statistical analysis: Kruskal-Wallis test with Dunn post-test, 95% confidence interval (CI). * denotes p<0.05, *** denotes p<0.001. (C) Comparison of LM-PCR/HTS data (n = 28 ATL patients) and CADM1/TCRVβ flow cytometry. Statistical analysis: Spearman correlation.
Fig 2
Fig 2. Expression of candidate ATL cell surface markers by the dominant TCRVβ-expressing population.
Staining was performed as described in Fig 1. (A) Representative flow cytometry plots of total live CD3+CD4+ cells from an ATL patient (LHN) and an AC (HHD). Plots display the most frequently expressed TCRVβ subunit in the respective donor. (B) Expanded clones are CCR4+CD7CADM1+. Live CD3+CD4+ T cells from ATL patients (n = 21) with an OCI-flow (CADM1+CD3+) >0.7 were gated on the basis of expression of the dominant TCRVβ (designated TCRVβX+ or TCRVβX). Total live CD4+ T cells from PBMC of n = 24 individuals without malignancy (patients with HAM or ACs) were included as controls. Whiskers represent maximum and minimum values. Statistical analysis: Kruskal-Wallis test with Dunn post-test, 95% confidence interval (CI). * denotes p<0.05, ** denotes p<0.01, *** denotes p<0.001.
Fig 3
Fig 3. OCI-flow of CADM1+CD3+ cells is an excellent diagnostic test for monoclonal integration.
Receiver operator curves illustrating the specificity and sensitivity by which the OCI-flow of CADM1+CD3+ cells, the frequency of CD7CD4+ or the frequency of CD25+CD4+ cells discriminate individuals with clinically evident ATL (n = 23) from individuals with non-malignant HTLV-1 infection (n = 24). Individuals previously diagnosed with ATL which were in clinical remission were excluded from this analysis.
Fig 4
Fig 4. Expression HLA-ABC, CADM1 and Tax by CADM1+CD4+ T cells.
CD8+ cells were depleted from PBMCs of 15 ATL patients with a dominant ATL clone detectable by TCRVβ staining, and 10 ACs. Cells were cultured for 18h, after which they were surface stained with a viability stain followed by antibodies specific for the most frequently utilised TCRVβ (VβX), CD3, CD4, CD8, CADM1, PD-L1, FoxP3 and HLA-ABC (S2 table; panels 3, 4, 6 and 7). Cells were then permeabilised and stained with antibodies specific for Tax and FoxP3 and analysed by flow cytometry. Cells from ATL patients and ACs were gated on live CD3+CD4+CADM1+ cells which were positive or negative for the dominant TCRVβX as indicated. Intensity of expression of (A) MHC class 1 and (B) CADM1. (C) Frequency of Tax expression by ATL clones. Taxhigh ATL clones are plotted in red, and Taxlow ATL clones are plotted in blue. Statistical analysis: Kruskal-Wallis test with Dunn post-test, 95% CI. * denotes p<0.05, ** denotes p<0.01, *** denotes p<0.001.
Fig 5
Fig 5. Experimental design of cell survival assay.
PBMCs from each of 9 ATL patients with a dominant ATL clone detectable by TCRVβ staining were depleted of CD8+ T cells. The CD8 PBMCs (CADM1+CD4+, purple; CADM1CD4+, yellow) were cultured overnight either alone or in the presence of autologous CD8+ cells at a range of ratios, after which cells were stained with a viability stain and antibodies specific for CD3, CD4, CD8, CADM1 and the TCRVβ subunit which was most frequently used in that individual (‘TCRVβX’). Cells were then permeabilised, stained intracellularly with anti-Tax antibody, and analysed by flow cytometry. Absolute cell counts of CD3+, CD4+ and CD8+ cells were performed in parallel.
Fig 6
Fig 6. Cultured CD8+ cells can kill autologous malignant cells in some donors.
CD8 depleted PBMCs from ATL patients (n = 9) with a known dominant TCRVβ were incubated in the presence of ex vivo (A) or cultured (B) autologous CD8+ cells at the indicated E:T ratios. After 18h, the absolute number of viable ATL cells (live CD3+CD4+CADM1+TCRVβ+) was quantified by flow cytometry and used to calculate the proportion of the ATL clone which had been specifically killed in the presence of CD8+ cells. The proportion of Tax+ and TaxCADM1+ TCRVβ cells which were killed was calculated in the same manner. (C) Ex vivo CD8+ cell killing of Tax+CD3+CD4+CADM1+ cells, TaxCD3+CD4+CADM1+ cells and CD3+CD4+CADM1 cells in ACs (n = 10). Subsets of cells which expressed Tax (in both ATL and ACs) are plotted in red.
Fig 7
Fig 7. Tax-expressing cells are preferentially killed by cultured autologous CD8+ cells.
(A) Selective loss of live Tax-expressing ATL cells after incubation with cultured CD8+ cells. Extended analysis of data from Fig 6. ATL clones from three Taxhigh ATL patients (LGZ, LGC and LGB) were gated on the basis of Tax expression as shown. For each donor, graphs show the percentage of Tax+ or Taxcells which were killed in the presence of cultured autologous CD8+ cells. Flow plots show Tax and CADM1 expression by live CD3+CD4+CADM1+TCRVβX+ cells from each individual after culture alone or in the presence of CD8+ cells at the highest E:T ratio tested. (B) Comparison of the rate at which ex vivo and cultured CD8+ cells supress survival of the populations indicated in ATL patients (n = 9) and ACs (n = 10). Subsets of cells which expressed Tax (in both ATL and ACs) are plotted in red. Data from Fig 6 was analysed by nonlinear regression to estimate the % change observed in each population with each 1% increase in CD8+ cells present in the co-culture. A negative rate indicates that number of viable target cells recovered from the co-culture was greater in the presence of CD8+ cells versus in the absence of CD8+ cells. Statistical analysis (CADM1+TCRVβ groups only): Wilcoxon matched pairs test, two tailed, 95% confidence interval.

References

    1. Shimoyama M. Diagnostic criteria and classification of clinical subtypes of adult T-cell leukaemia-lymphoma. A report from the Lymphoma Study Group (1984–87). Br J Haematol. 1991;79: 428–437. - PubMed
    1. Katsuya H, Ishitsuka K, Utsunomiya A, Hanada S, Eto T, Moriuchi Y, et al. Treatment and survival among 1594 patients with ATL. Blood. 2015;126: 2570–7. 10.1182/blood-2015-03-632489 - DOI - PubMed
    1. Utsunomiya A, Choi I, Chihara D, Seto M. Recent advances in the treatment of adult T-cell leukemia-lymphomas. Cancer Sci. 2015;106: 344–351. 10.1111/cas.12617 - DOI - PMC - PubMed
    1. Hermine O, Bouscary D, Gessain A, Turlure P, Leblond V, Franck N, et al. Brief report: treatment of adult T-cell leukemia-lymphoma with zidovudine and interferon alfa. N Engl J Med. 1995;332: 1749–51. 10.1056/NEJM199506293322604 - DOI - PubMed
    1. Gill P, Harrington W, Kaplan M, Ribeiro R, Bennett J, Liebman H, et al. Treatment of adult T-cell leukemia-lymphoma with a combination of interferon alfa and zidovudine. N Engl J Med. 1995;332: 1744–1748. 10.1056/NEJM199506293322603 - DOI - PubMed

Substances