. 2016 Nov 28;17(1):979.
doi: 10.1186/s12864-016-3331-9.

Gene cassette knock-in in mammalian cells and zygotes by enhanced MMEJ

Affiliations

Gene cassette knock-in in mammalian cells and zygotes by enhanced MMEJ

Tomomi Aida et al. BMC Genomics. .

Abstract

Background: Although CRISPR/Cas enables one-step gene cassette knock-in, assembling targeting vectors containing long homology arms is a laborious process for high-throughput knock-in. We recently developed the CRISPR/Cas-based precise integration into the target chromosome (PITCh) system for a gene cassette knock-in without long homology arms mediated by microhomology-mediated end-joining.

Results: Here, we identified exonuclease 1 (Exo1) as an enhancer for PITCh in human cells. By combining the Exo1 and PITCh-directed donor vectors, we achieved convenient one-step knock-in of gene cassettes and floxed allele both in human cells and mouse zygotes.

Conclusions: Our results provide a technical platform for high-throughput knock-in.

Keywords: CRISPR/Cas; Cloning-free; Exo1; Flox; Gene cassette; High throughput; Knock-in; MMEJ; Mouse; Reporter.


Figures

Fig. 1
Fig. 1
Generation of knock-in mice carrying a gene cassette by the PITCh system. a Targeting strategy for the generation of Actb-TetO-FLEX-hM3Dq/mCherry knock-in mice by the PITCh system. Purple highlights indicate microhomologies between endogenous Actb locus and PITCh-donor. Blue characters indicate CRISPR target sequences. Red characters indicate protospacer adjacent motif (PAM) sequences. Yellow lightnings indicate DSB sites. b Schematic diagram of pronuclear injection of Cas9 protein, Actb and gRNA-s1 crRNAs, tracrRNA and PITCh-donor. The red, purple, and blue boxes indicate the insert, Actb microhomologies, and gRNA-s1 target sequences, respectively. c PCR screenings of knock-in newborns. d Summary of Actb-TetO-FLEX-hM3Dq/mCherry knock-in mouse production by the PITCh system. e Sequences of boundaries between Actb and TetO-FLEX- hM3Dq/mCherry cassette. Blue characters indicate microhomologies. IF: internal forward primer, IR: internal reverse primer, LF: left forward primer, LR: left reverse primer, RF: right forward primer, RR: right reverse primer, MH: microhomology, M: molecular marker, WT: wildtype, KI: knock-in, WPRE: woodchuck hepatitis virus posttranscriptional regulatory element, pA: polyA, and KI/+: tail genomic DNA of F1 heterozygous knock-in pup derived from #13 (KI#2) F0 knock-in mouse
Fig. 2
Fig. 2
Screening of MMEJ-enhancing factors using a fluorescence reporter assay. a Schematic diagram of MMEJ-dependent EGFP recovery. Green letters indicate chromophore sequence. Black line indicates CRISPR target sequence. Black box indicates protospacer adjacent motif (PAM) sequence. Black triangles indicate DSB site. MH, microhomology. CMV, cytomegalovirus promoter. b Schematic diagram of HEK293T-based reporter assay, followed by imaging analysis. c Fluorescence microscopy images of transfected cells. Bars, 500 μm. d Relative frequencies of MMEJ repair, fold to mock overexpression. The MMEJ frequencies were calculated by imaging analysis. Data are expressed as means ± SEM (n = 4)
Fig. 3
Fig. 3
Enhancement of MMEJ-mediated gene knock-in by Exo1 overexpression at the FBL locus in HEK293T cells. a Schematic diagram of gene knock-in strategy at the FBL locus in HEK293T cells. Black lines indicate CRISPR target sequences. Black boxes indicate PAM sequences. Black triangles indicate DSB sites. MH, microhomology. Puro, puromycin resistance gene. b Schematic diagram of gene knock-in in HEK293T cells, followed by FACS analysis. c Relative frequencies of gene knock-in, fold to mock overexpression. The knock-in frequencies were calculated by FACS analysis (Additional file 1: Figure S4). Data are expressed as means ± SEM (n = 3). Statistical significance was determined by Student’s t-test. *P < 0.05. d The percentages of mNeonGreen-positive cell areas in mCherry-positive cell areas, calculated by imaging analysis (Additional file 1: Figure S5). Data are expressed as means ± SEM (n = 3). Statistical significance was determined by Student’s t-test. *P < 0.05. e Confocal laser scanning microscopy images of transfected cells. The knocked-in cells showed nucleolar localization of mNeonGreen fluorescence. Bars, 30 μm. f DNA sequencing analysis of bacterially cloned PCR products of 5’ and 3’ junctions amplified from the cells knocked-in with Exo1. The intended knocked-in sequence is shown at the top of each set of sequences. Blue letters indicate the microhomologies. Red letters indicate insertions
Fig. 4
Fig. 4
MMEJ-mediated gene knock-in at the hACTB locus in HeLa cells. a Schematic diagram of gene knock-in strategy at the hACTB locus in HeLa cells. Black lines indicate CRISPR target sequences. Black boxes indicate PAM sequences. Black triangles indicate DSB sites. MH, microhomology. Puro, puromycin resistance gene. b Relative frequencies of gene knock-in, fold to mock overexpression. The knock-in frequencies were calculated by FACS analysis, similar to Fig. 3b, except that mCherry was used to normalize the transfection efficiency. Data are expressed as means ± SEM (n = 3). Statistical significance was determined by Student’s t-test. *P < 0.05. c Confocal laser scanning microscopy images of transfected cells. The knocked-in cells showed cytoplasmic localization and peripheral accumulation of mNeonGreen fluorescence. Bars, 30 μm. d, e DNA sequencing analysis of bacterially cloned PCR products of 5’ and 3’ junctions amplified from the cells knocked-in without Exo1 (d) and with Exo1 (e). The intended knocked-in sequence is shown at the top of each set of sequences. Blue bars indicate the microhomologies. Red letters indicate mutated bases including insertions, deletions, and substitutions. Blue letters indicate polymorphisms found on the off-target genomic sites, related to Fig. 5a. Roman numbers shown at the left side of each set of sequences indicate the allele types, related to Fig. 5a and Additional file 1: Figure S15, S16 and Table S1. Statistical significance was determined by chi-square test. *P < 0.05. ** P < 0.01
Fig. 5
Fig. 5
Potential window of MMEJ-dependent base replacement revealed by sequence alignment of on- and off-target knock-ins. a Sequence alignment of upstream and downstream regions of the DSB site. OT1–OT14 represents off-target sites, related to Additional file 1: Table S1. Roman numbers shown at the right side of each set of sequences indicate the allele types, related to Fig. 4d, e and Additional file 1: Figure S15, S16 and Table S1. Black triangles indicate the DSB site. Black boxes indicate the CRISPR target sequence. Red and blue underlines indicate the left and right microhomologies, respectively. Black underlines indicate mutated sequences found in sequenced knock-in junctions. Blue letters indicate the polymorphisms found in sequenced knock-in junctions, related to Fig. 4d, e. Red letters indicate the mutations not found in the sequenced knock-in junctions. Asterisks indicate positions with complete base conservation among on- and off-target sites. The positions of bases replaced and not replaced with the donor sequence were masked in red and blue, respectively. The upstream sequences of OT2, OT3, OT4, OT5, OT7, and OT8 and the downstream sequences of OT5, OT6, and OT8 were identical, respectively (Additional file 1: Figure S17). b Schematic representation of potential MMEJ window. Red and blue boxes indicate the left and right microhomologies, respectively
Fig. 6
Fig. 6
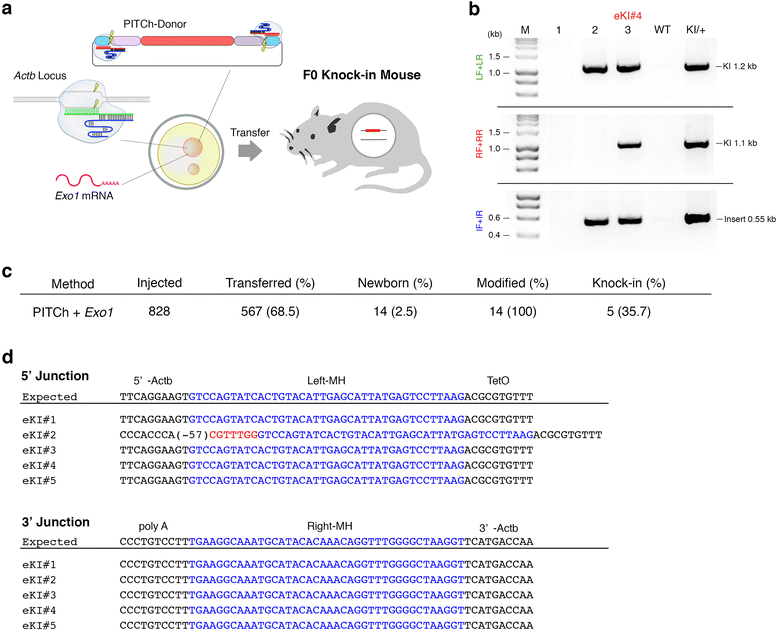
Generation of gene cassette knock-in mice by the enhanced PITCh system. a Schematic diagram of pronuclear injection of Cas9 protein, Actb and gRNA-s1 crRNAs, tracrRNA, PITCh-donor, and Exo1 mRNA. b PCR screenings of knock-in newborns. c Summary of Actb-TetO-FLEX-hM3Dq/mCherry knock-in mouse production by the enhanced PITCh system. d Sequences of boundaries between Actb and TetO-FLEX- hM3Dq/mCherry cassette. Blue and red characters indicate microhomologies and partial crRNA(gRNA-s1) target sequence, respectively. IF: internal forward primer, IR: internal reverse primer, LF: left forward primer, LR: left reverse primer, RF: right forward primer, RR: right reverse primer, MH: microhomology, M: molecular marker, WT: wildtype, KI: knock-in, and KI/+: tail genomic DNA of F1 heterozygous knock-in pup derived from #13 (KI#2) F0 knock-in mouse
Fig. 7
Fig. 7
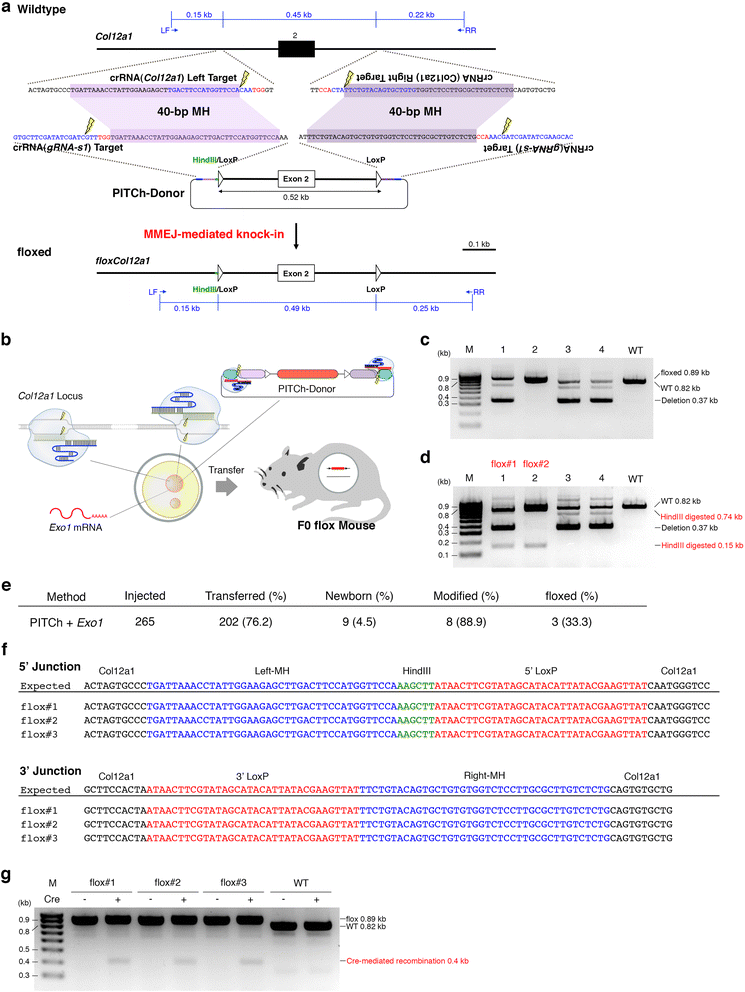
Generation of floxed mice by the enhanced PITCh system. a Targeting strategy for the generation of floxCol12a1 mice by the enhanced PITCh system. Purple highlights indicate microhomologies between endogenous Col12a1 locus and PITCh-donor. Blue characters indicate CRISPR target sequences. Red characters indicate protospacer adjacent motif (PAM) sequences. Yellow lightnings indicate DSB sites. b Schematic diagram of pronuclear injection of Cas9 protein, Col12a1-left, -right, and gRNA-s1 crRNAs, tracrRNA, PITCh-donor, and Exo1 mRNA. The red, purple, and blue boxes indicate the insert, Col12a1 microhomologies, and gRNA-s1 target sequences, respectively. c PCR screenings of newborns. d PCR-RFLP (restriction fragment length polymorphism) screenings of floxed newborn mice. e Summary of floxCol12a1 mouse production by the enhanced PITCh system. f Sequences of boundaries between Col12a1 and LoxPs. Blue, green, and red characters indicate microhomologies, HindIII sites, and LoxPs, respectively. g in vitro Cre-recombination assay. Cloned PCR products of flox alleles from three floxCol12a1 mice and genomic PCR of wildtype were incubated with or without Cre-recombinase. LF: left forward primer, RR: right reverse primer, MH: microhomology, M: molecular marker, and WT: wildtype

References

    1. Huang ZJ, Zeng H. Genetic approaches to neural circuits in the mouse. Annu Rev Neurosci. 2013;36:183–215. doi: 10.1146/annurev-neuro-062012-170307. - DOI - PubMed
    1. Capecchi MR. Gene targeting in mice: functional analysis of the mammalian genome for the twenty-first century. Nat Rev Genet. 2005;6:507–12. doi: 10.1038/nrg1619. - DOI - PubMed
    1. Sternberg SH, Doudna JA. Expanding the Biologist’s Toolkit with CRISPR-Cas9. Mol Cell. 2015;58:568–74. doi: 10.1016/j.molcel.2015.02.032. - DOI - PubMed
    1. Doudna JA, Charpentier E. The new frontier of genome engineering with CRISPR-Cas9. Science. 2014;346:1258096. doi: 10.1126/science.1258096. - DOI - PubMed
    1. Hsu PD, Lander ES, Zhang F. Development and Applications of CRISPR-Cas9 for Genome Engineering. Cell. 2014;157:1262–78. doi: 10.1016/j.cell.2014.05.010. - DOI - PMC - PubMed

Publication types

Substances