. 2016 Nov 23;3(5):444-455.e2.
doi: 10.1016/j.cels.2016.10.002. Epub 2016 Oct 27.

Push-Pull and Feedback Mechanisms Can Align Signaling System Outputs with Inputs

Affiliations

Push-Pull and Feedback Mechanisms Can Align Signaling System Outputs with Inputs

Steven S Andrews et al. Cell Syst. .

Abstract

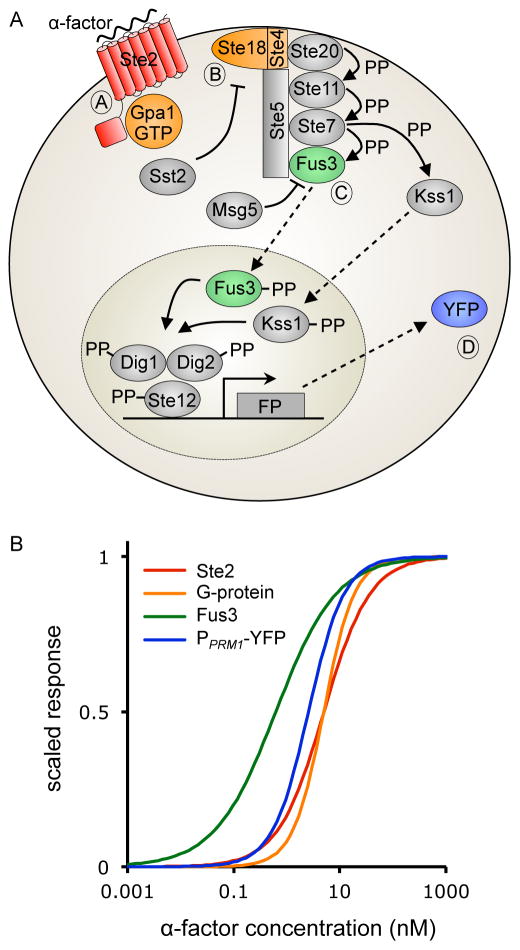
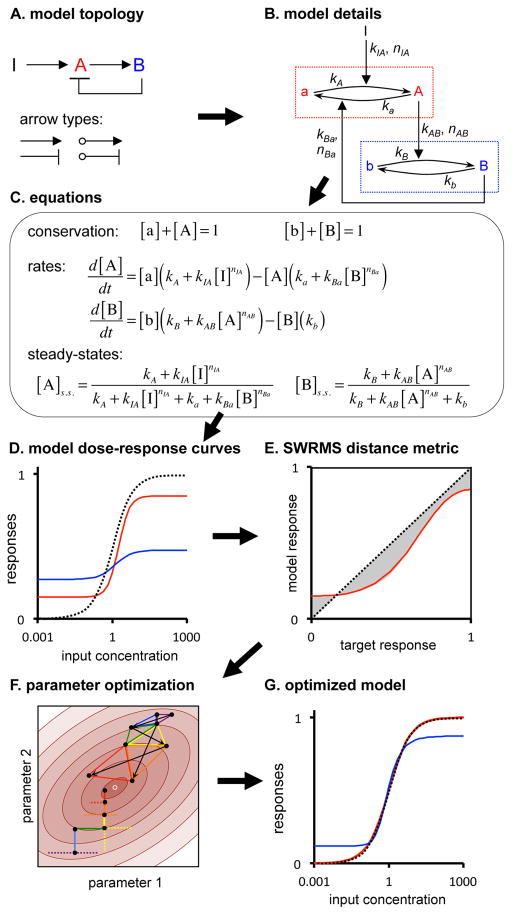
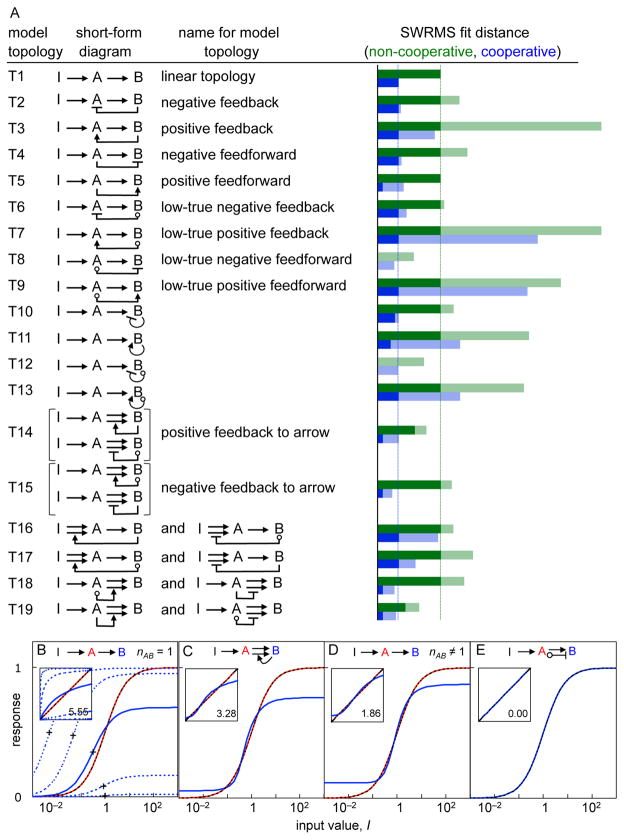
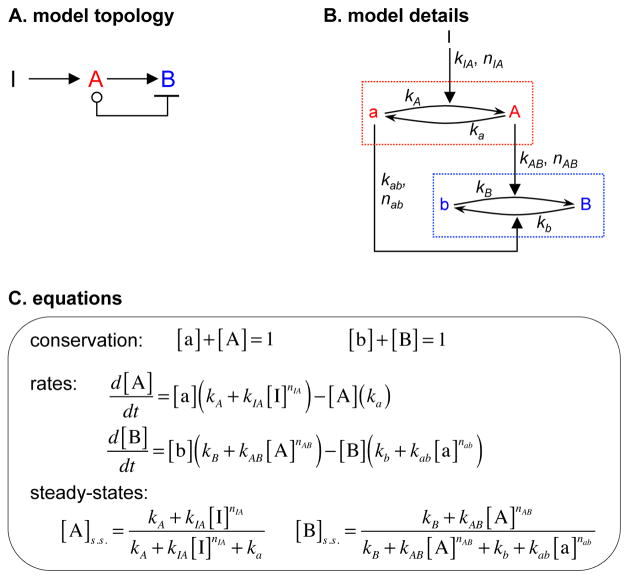
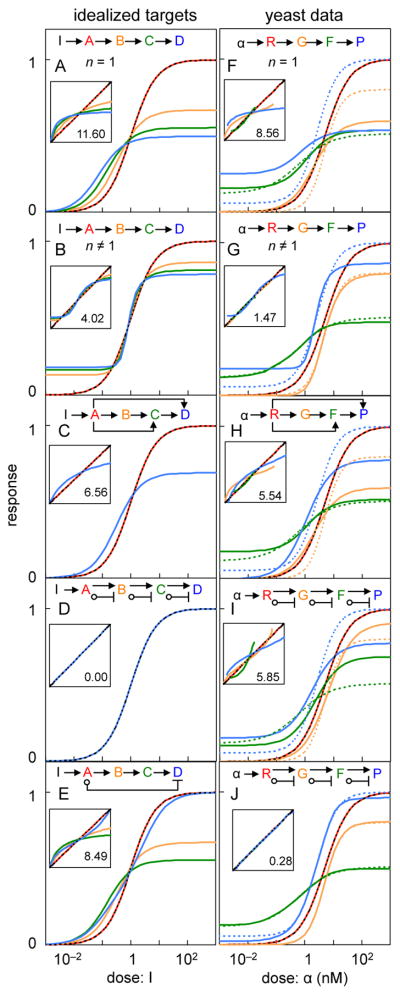
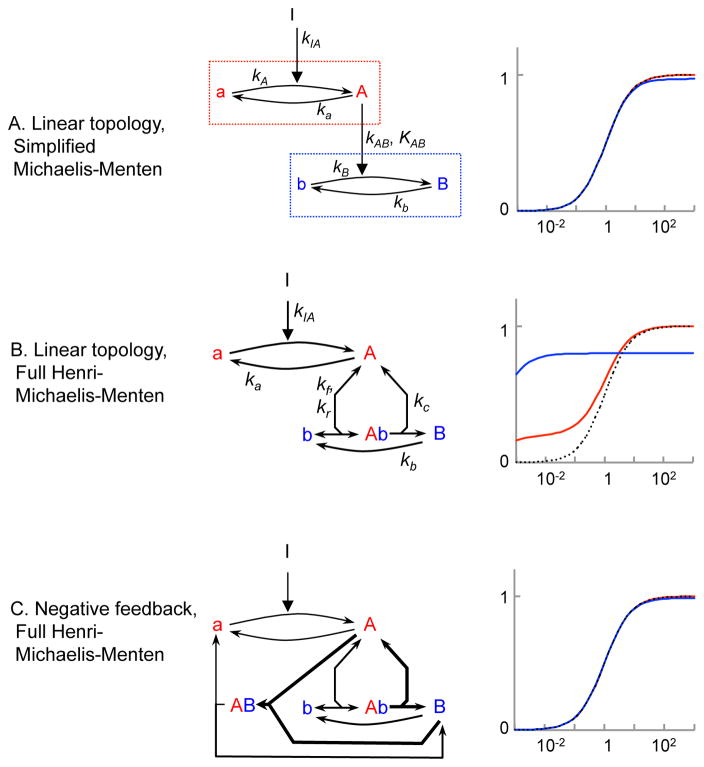
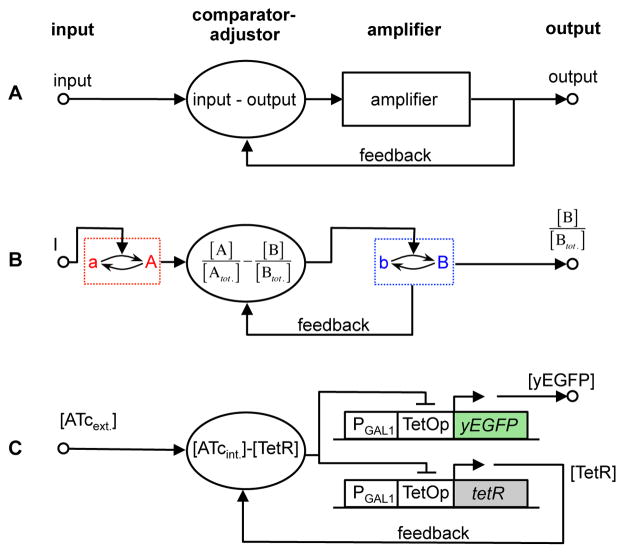
Many cell signaling systems, including the yeast pheromone response system, exhibit "dose-response alignment" (DoRA), in which output of one or more downstream steps closely matches the fraction of occupied receptors. DoRA can improve the fidelity of transmitted dose information. Here, we searched systematically for biochemical network topologies that produced DoRA. Most networks, including many containing feedback and feedforward loops, could not produce DoRA. However, networks including "push-pull" mechanisms, in which the active form of a signaling species stimulates downstream activity and the nominally inactive form reduces downstream activity, enabled perfect DoRA. Networks containing feedbacks enabled DoRA, but only if they also compared feedback to input and adjusted output to match. Our results establish push-pull as a non-feedback mechanism to align output with variable input and maximize information transfer in signaling systems. They also suggest genetic approaches to determine whether particular signaling systems use feedback or push-pull control.

Keywords: Saccharomyces cervisiae; cell signaling; dose response alignment; paradoxical signaling; pheromone response system; push-pull; yeast.


Figures

Figure 1
Figure 1
(A) The yeast pheromone response system (PRS). Binding of mating pheromone, α-factor, to the G-protein coupled receptor Ste2GPCR activates a G-protein (Gpa1-Ste18-Ste4). Its βγ subunit (Ste18-Ste4) causes the Ste5 scaffold protein to translocate from the cytoplasm to the cell membrane and initiates a mitogen-activated protein (MAP) kinase cascade, operating on Ste5. The final cascade elements, Fus3MAPK and Kss1MAPK, carry the signal to the nucleus where it activates transcription of fluorescent reporter genes (FP), including the PPRM1. -YFP fusion that generated data here (Yu et al., 2008). (B) Dose Response Alignment (DoRA) in the PRS. Red line represents pheromone binding to Ste2GPCR, orange represents G-protein dissociation (Yi et al., 2003), green represents Fus3 phosphorylation (Yu et al., 2008), and blue represents YFP expression from the PRM1 promoter (Yu et al., 2008). Responses are scaled to range from 0 to 1.
Figure 2
Figure 2
Modeling scheme, illustrated by a two-node network with negative feedback. (A) Model topology; ‘I’ is the input, A and B are nodes, and arrows types depict interactions. (B) Detailed representation; dotted boxes are nodes, showing nominally inactive and active states and interconversion reactions, and black text symbols are model parameters. (C) Model equations; brackets denote concentrations of node species and the “s.s.” indicates steady-state. (D) Steady-state dose-response curves for the same model, using arbitrary parameters. The black dashed line is the target function, the red line is the node A response, and the blue line is the node B response. (E) SWRMS distance using the node A dose-response curve shown in panel D, now with the target response as the x-axis. (F) Parameter optimization. Brown ellipses show a contour graph of SWRMS distances near a minimum (small white circle). Four intermediate steps are shown in progressively warmer colors (blue, green, yellow, red) for each approach. Black dots mark the parameter estimates. Vertical and horizontal lines depict greedy random walk steps while triangles depict downhill simplex method steps. (G) Dose-response curves after optimization of model parameters for agreement with the target function.
Figure 3
Figure 3
Survey of two-node models. (A) All model topologies, showing topology designation, representation, name, and SWRMS distances. Green bars show fit distances with non-cooperative reactions and blue bars for cooperative reactions. Control arrow reaction rates were fixed for the shaded portions of the bars and optimized for the solid portions. Vertical dashed lines show fit distances for linear topologies. (B–E) Best fits for linear topology (T1), a positive feedback to an arrow (T14), linear topology with cooperative reactions (T1), and push-pull (T8), all with non-cooperative reactions except as noted. Colors are as in Figure 2. Insets show target responses on the x-axis and list SWRMS distances. Dashed lines in (B) show the node B responses with different values of kAB, while crosses show EC50 values.
Figure 4
Figure 4
Push-pull mechanism. This figure is similar to Figure 2, except that it shows topology T8.
Figure 5
Figure 5
Results for 4-node models. Left column represents idealized models, for which the target responses are shown with a black dashed line, node A in red, node B in orange, node C in green, and node D in blue. Right column represents models fit to experimental yeast PRS data. Hill function fits to the data (target functions) are shown with dashed lines and model fits are shown with solid lines. Node GPCR is shown in red, G-protein in orange, Fus3 in green, and PRM1-YFP in blue. (A) and (F) show results for linear topologies with non-cooperative reactions, (B) and (G) show results for linear topologies with cooperative reactions, (C) and (H) show results for topologies constructed with positive feedforward loops that skip over intermediate nodes, (D) and (I) show results for push-pull mechanisms, (E) shows a pull arrow that skips intermediate nodes, and (J) shows push-pull mechanisms with cooperative reactions. The insets are analogous to those shown in Figure 3.
Figure 6
Figure 6
(A,B) Dose-response behavior of linear topology (T1) when the first step is modeled with simple mass action kinetics and the second step with Henri-Michaelis-Menten kinetics. Each row shows a reaction network and the dose-response curves that result from it using the parameters [Atot.] = [Btot.] = kIA = ka = kb = kr = 1, kf = 10,000, and kc = 9; from these, KM = 0.001. (A) shows simplified Michaelis-Menten kinetics; it approaches DoRA as KM approaches 0. (B) shows full Henri-Michaelis-Menten kinetics; note retroactivity effect on node A. (C) Topology with a negative feedback loop (T2) in which the first step is modeled with simple mass action kinetics and other reactions with full Henri-Michaelis-Menten kinetics. Optimal parameters are depicted here using bold arrows for fast reactions and single-headed arrows for irreversible reactions.
Figure 7
Figure 7
Alignment by feedback and comparator-adjuster. (A) Control theory diagram, where “amplifier” is a device to be controlled and “comparator-adjuster” compares input to output and adjusts signal in proportion to the difference. (B) Biochemical reaction network where nodes have active and nominally inactive states. Feedback alone cannot produce alignment in such a network, but can if network contains a comparator-adjuster, shown with an unspecified mechanism. (C) A human-built cell system that aligned output with variant input using feedback and a comparator-adjuster (Nevozhay et al. (2009). An inhibitor, anhydrotetracycline (ATc) diffuses into (and out of) yeast cells slowly. ATc binds and inactivates tetracycline repressor, TetR. If ATc level rises so that intracellular ATc exceeds TetR, then all TetR is bound, while some ATc is free. Because all TetR is inactivated, it does not repress yEGFP expression, so system output increases. Meanwhile, TetR synthesis driven by an identical promoter is derepressed. Once total TetR concentration exceeds that of ATc, some TetR remains free and active. Free TetR represses yEGFP expression, capping yEGFP synthesis and TetR synthesis at a new, higher level. The comparator uses binding between ATc and TetR to compute their concentration difference, and the adjuster (free TetR) aligns system output (yEGFP and total TetR) with the input, ATc.

Comment in

References

    1. Alon U. Network motifs: theory and experimental approaches. Nature. 2007;8:450–461. - PubMed
    1. Ang J, Bagh S, Ingalls BP, McMillen DR. Considerations for using integral feedback control to construct a perfectly adapting synthetic gene network. J Theor Biol. 2010;266:723–738. - PubMed
    1. Astrom KJ, Murray RM. Feedback systems: an introduction for scientists and engineers. Princeton: Princeton University Press; 2008.
    1. Bardwell L. A walk-through of the yeast mating pheromone response pathway. Peptides. 2005;26:339–350. - PMC - PubMed
    1. Bardwell L, Cook JG, Voora D, Baggott DM, Martinez AR, Thorner J. Repression of yeast Ste12 transcription factor by direct binding of unphosphorylated Kss1 MAPK and its regulation by the Ste7 MEK. Genes and Development. 1998a;12:2887–2898. - PMC - PubMed

Publication types

LinkOut - more resources