. 2016 Dec;47(12):2966-2971.
doi: 10.1161/STROKEAHA.116.014177. Epub 2016 Nov 15.

Optimal Computed Tomographic Perfusion Scan Duration for Assessment of Acute Stroke Lesion Volumes

Affiliations

Optimal Computed Tomographic Perfusion Scan Duration for Assessment of Acute Stroke Lesion Volumes

Aimen S Kasasbeh et al. Stroke. 2016 Dec.

Abstract

Background and purpose: The minimal scan duration needed to obtain reliable lesion volumes with computed tomographic perfusion (CTP) has not been well established in the literature.

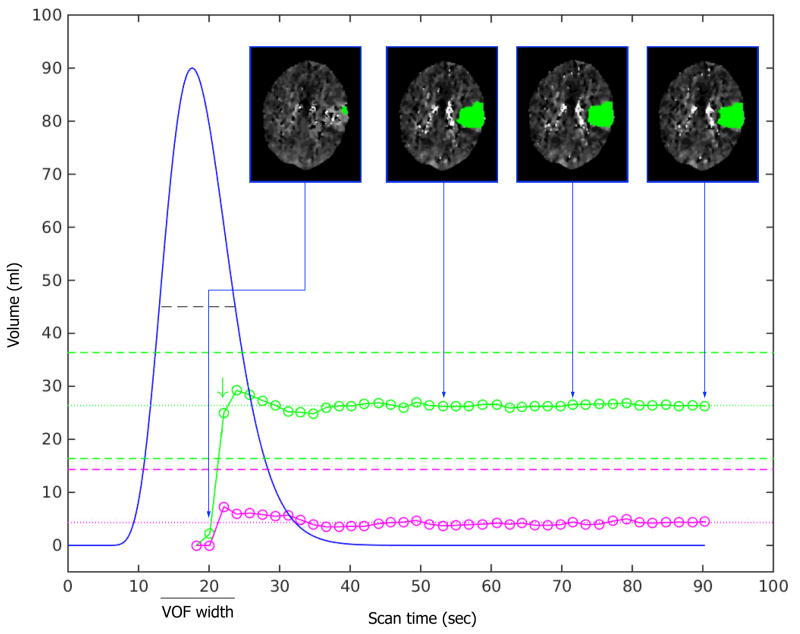
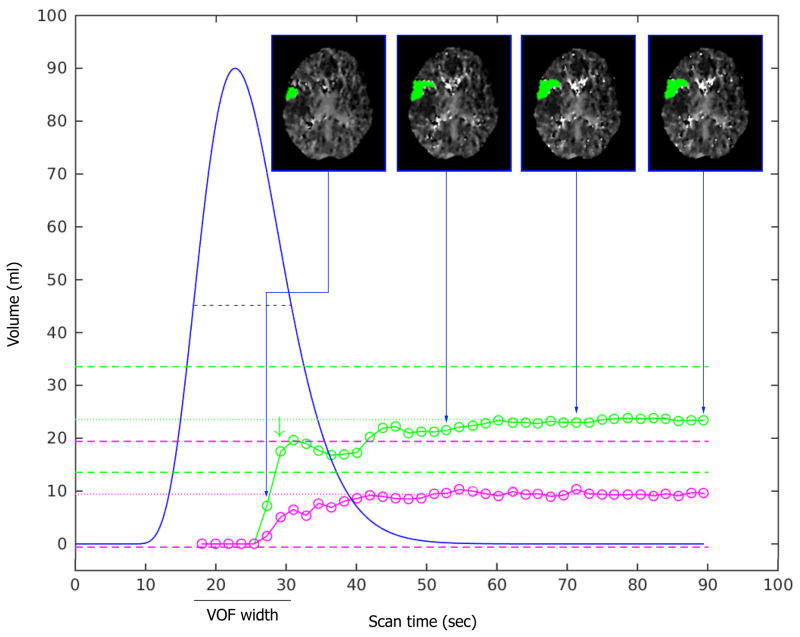
Methods: We retrospectively assessed the impact of gradual truncation of the scan duration on acute ischemic lesion volume measurements. For each scan, we identified its optimal scan time, defined as the shortest scan duration that yields measurements of the ischemic lesion volumes similar to those obtained with longer scanning, and the relative height of the fitted venous output function at its optimal scan time.

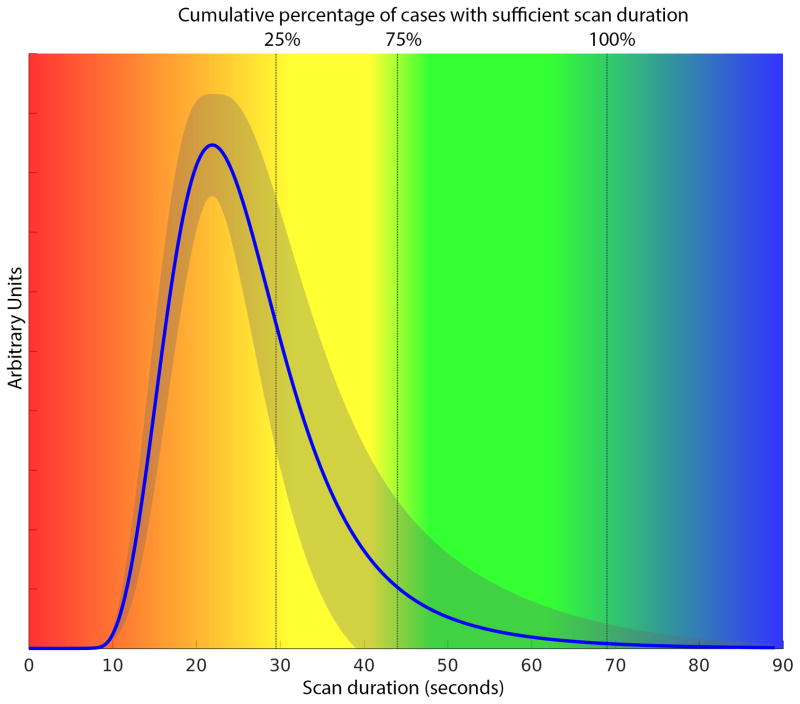
Results: We analyzed 70 computed tomographic perfusion scans of acute stroke patients. An optimal scan time could not be determined in 11 scans (16%). For the other 59 scans, the median optimal scan time was 32.7 seconds (90th percentile 52.6 seconds; 100th percentile 68.9 seconds), and the median relative height of the fitted venous output function at the optimal scan times was 0.39 (90th percentile 0.02; 100th percentile 0.00). On the basis of a linear model, the optimal scan time was T0 plus 1.6 times the width of the venous output function (P<0.001; R2=0.49).

Conclusions: This study shows how the optimal duration of a computed tomographic perfusion scan relates to the arrival time and width of the contrast bolus. This knowledge can be used to optimize computed tomographic perfusion scan protocols and to determine whether a scan is of sufficient duration. Provided a baseline (T0) of 10 seconds, a total scan duration of 60 to 70 seconds, which includes the entire downslope of the venous output function in most patients, is recommended.

Keywords: magnetic resonance imaging; perfusion imaging; reperfusion; stroke.


Conflict of interest statement

DISCLOSURES/CONFLICT OF INTEREST G. Albers has received consulting fees and expenses from Lundbeck for Steering Committee work and consulting fees from Concentric for serving on a Data Safely and Monitory Board. G Albers and R Bammer are equity shareholders in iSchemaView and perform consulting work for iSchemaView. Soren Christensen performs consulting work for iSchemaView. All other authors report no conflicts of interest.

Figures

Figure 1
Figure 1. Relationship between scan duration (seconds) and ischemic lesion volume (ml) estimates
The VOF curve fit is shown as a blue curve. The volume estimates of critically hypoperfused tissue (Tmax>6s) are indicated with green circles. The dotted green line represents the mean volume of the Tmax>6 lesion for the last 6 frames (the “stability tail”). The dashed green lines represent the boundaries (mean volume ±10ml) beyond which the lesion volumes are deemed unreliable. For the scan shown in panel A, the Tmax>6s lesion volume estimate (green circles) is essentially unaffected by reductions in scan time from 90s down to 38s. With further reductions in scan time down to 23s (corresponds with the optimal scan time, green arrow), some fluctuations in the Tmax>6s lesion volume estimates is observed. When scan time is reduced below 23s, the Tmax>6s lesion volume estimate drops to nil and is clearly unreliable. A similar pattern is observed for the volume estimates of the ischemic core (rCBF<30%, pink circles), although no optimal scan time is noted given the comparatively small size of the ischemic core. The insets show axial CTP images corresponding to four select scan durations. The insets illustrate the marginal differences in lesion volume and lesion morphology when the scan time exceeds the optimal scan duration, but dramatic changes in lesion volume when the scan is shorter than its optimal duration. The graphs in Panel B show the same pattern as in panel A, but due to a later bolus arrival time (T0) and a wider VOF, the graphs of the ischemic lesion volume estimates and the optimal scan duration are shifted to the right.
Figure 2
Figure 2. Cumulative percentage of patients with accurate ischemic lesion volume estimates
For the 59 scans that had stable lesion volume estimates with 90s scan duration, the vertical color-coding corresponds to the cumulative proportion of scans that have reached their optimal scan duration: 25% of scans have an optimal scan duration <29.5s; 75% <44s, and 100% <69s. These data indicate that, with a uniform T0 of 10s, a total scan duration of 69s would have been sufficient for all 59 cases. A total scan duration of 60s, would have been sufficient for 93% of the cases (55 of 59). The averaged VOF for the 59 cases, normalized to a T0 of 10s, is shown (blue curve) with its standard deviation (grey shaded area).

References

    1. Heiss WD, Sobesky J, Hesselmann V. Identifying thresholds for penumbra and irreversible tissue damage. Stroke. 2004;35:2671–4. - PubMed
    1. Wintermark M, Flanders AE, Velthuis B, Meuli R, van LM, Goldsher D, et al. Perfusion-CT assessment of infarct core and penumbra: receiver operating characteristic curve analysis in 130 patients suspected of acute hemispheric stroke. Stroke. 2006;37:979–85. - PubMed
    1. Bivard A, Spratt N, Levi C, Parsons M. Perfusion computer tomography: imaging and clinical validation in acute ischaemic stroke. Brain. 2011;134:3408–16. - PubMed
    1. Campbell BC, Christensen S, Levi CR, Desmond PM, Donnan GA, Davis SM, et al. Cerebral blood flow is the optimal CT perfusion parameter for assessing infarct core. Stroke. 2011;42:3435–40. - PubMed
    1. Campbell BC, Mitchell PJ, Kleinig TJ, Dewey HM, Churilov L, Yassi N, et al. Endovascular therapy for ischemic stroke with perfusion-imaging selection. N Engl J Med. 2015;372:1009–18. - PubMed

Publication types