

Sex- and age-related differences in arterial pressure and albuminuria in mice
- PMID: 27895890
- PMCID: PMC5109725
- DOI: 10.1186/s13293-016-0110-x
Sex- and age-related differences in arterial pressure and albuminuria in mice
Abstract
Background: Animal models have become valuable experimental tools for understanding the pathophysiology and therapeutic interventions in cardiovascular disease. Yet to date, few studies document the age- and sex-related differences in arterial pressure, circadian rhythm, and renal function in normotensive mice under basal conditions, across the life span. We hypothesized that mice display similar sex- and age-related differences in arterial pressure and renal function to humans.
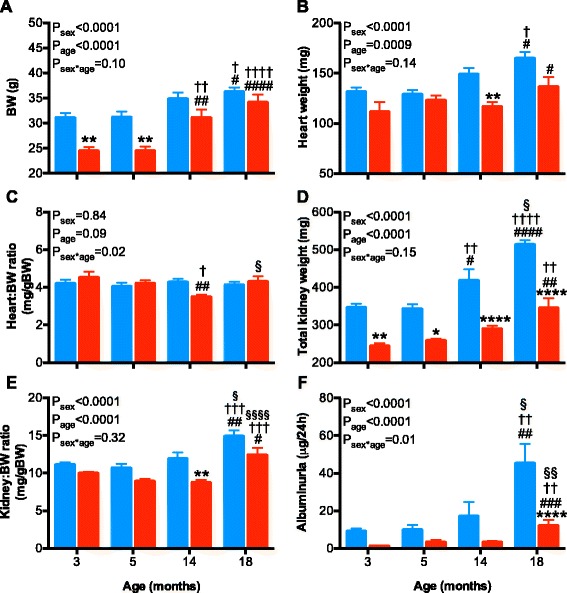
Methods: Mean arterial pressure (MAP) and circadian rhythm of arterial pressure were measured over 3 days via radiotelemetry, in 3- and 5-month-old (adult) and 14- and 18-month-old (aged) FVB/N and in 5-month-old (adult) C57BL/6 male and female normotensive mice. In FVB/N mice, albuminuria from 24-h urine samples as well as body, heart, and kidney weights were measured at each age.
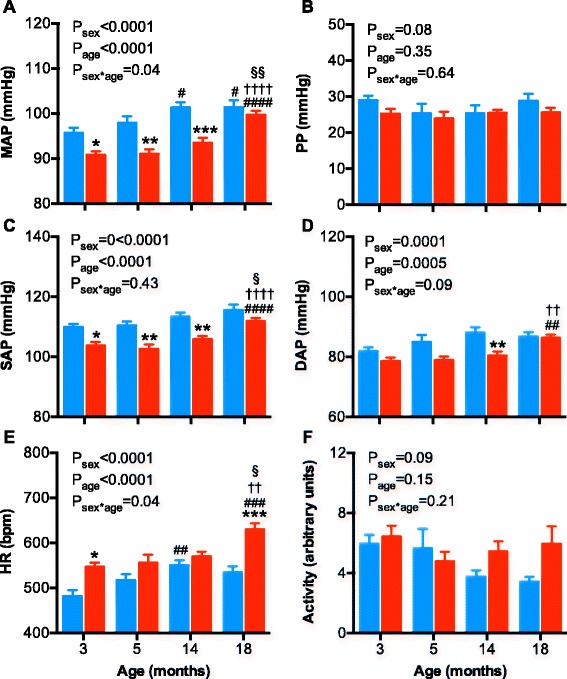
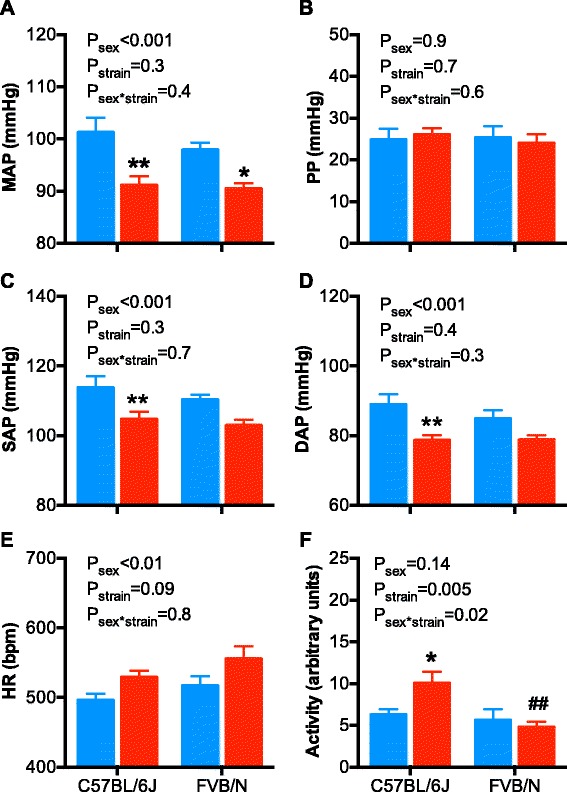
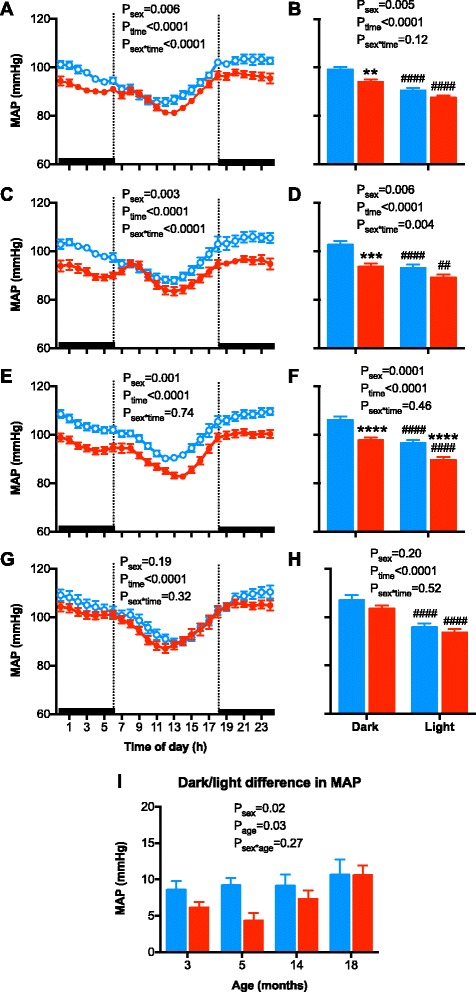
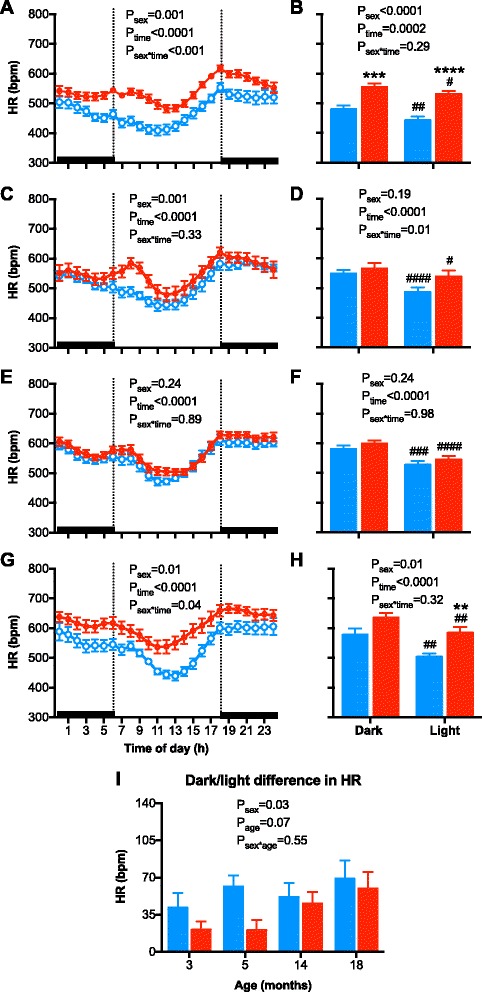
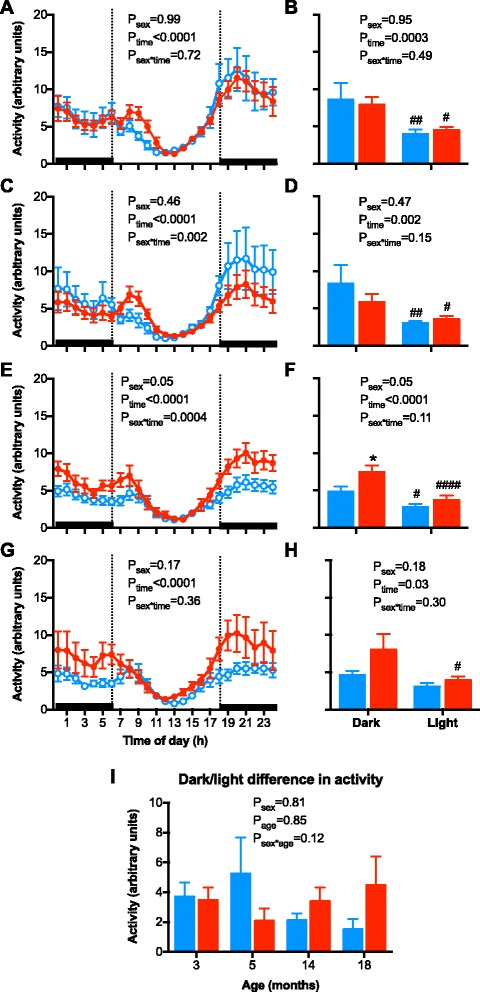
Results: Twenty-four-hour MAP was greater in males than females at 3, 5, and 14 months of age. A similar sex difference in arterial pressure was observed in C57BL/6 mice at 5 months of age. In FVB/N mice, 24-h MAP increased with age, with females displaying a greater increase between 3 and 18 months of age than males, such that MAP was no longer different between the sexes at 18 months of age. A circadian pattern was observed in arterial pressure, heart rate, and locomotor activity, with values for each greater during the active (night/dark) than the inactive (day/light) period. The night-day dip in MAP was greater in males and increased with age in both sexes. Albuminuria was greater in males than females, increased with age in both sexes, and rose to a greater level in males than females at 18 months of age.
Conclusions: Arterial pressure and albuminuria increase in an age- and sex-specific manner in mice, similar to patterns observed in humans. Thus, mice represent a useful model for studying age and sex differences in the regulation of arterial pressure and renal disease. Understanding the mechanisms that underlie the pathophysiology of cardiovascular disease may lead to new and better-tailored therapies for men and women.
Keywords: Aging; Arterial pressure; Hypertension; Menopause; Renal function; Sex.
Figures
Similar articles
-
NTP Toxicology and Carcinogenesis Studies of Coumarin (CAS No. 91-64-5) in F344/N Rats and B6C3F1 Mice (Gavage Studies).Natl Toxicol Program Tech Rep Ser. 1993 Sep;422:1-340. Natl Toxicol Program Tech Rep Ser. 1993. PMID: 12616289
-
NTP Toxicology and Carcinogenesis Studies of Tetrafluoroethylene (CAS No. 116-14-3) in F344 Rats and B6C3F1 Mice (Inhalation Studies).Natl Toxicol Program Tech Rep Ser. 1997 Apr;450:1-321. Natl Toxicol Program Tech Rep Ser. 1997. PMID: 12594525
-
NTP Toxicology and Carcinogenesis Studies of 3,4-Dihydrocoumarin (CAS No. 119-84-6) in F344/N Rats and B6C3F1 Mice (Gavage Studies).Natl Toxicol Program Tech Rep Ser. 1993 Sep;423:1-336. Natl Toxicol Program Tech Rep Ser. 1993. PMID: 12616288
-
Toxicology and carcinogenesis studies of tetralin (CAS No. 119-64-2) in F344/N rats and B6C3F1 mice (inhalation studies).Natl Toxicol Program Tech Rep Ser. 2011 Apr;(561):1-198. Natl Toxicol Program Tech Rep Ser. 2011. PMID: 21685956
-
Toxicology and carcinogenesis studies of androstenedione (CAS No. 63-05-8) in F344/N rats and B6C3F1 mice (gavage studies).Natl Toxicol Program Tech Rep Ser. 2010 Sep;(560):1, 7-31,33-171 passim. Natl Toxicol Program Tech Rep Ser. 2010. PMID: 21037592 Review.
Cited by
-
Sex differences in soluble prorenin receptor in patients with type 2 diabetes.Biol Sex Differ. 2021 May 1;12(1):33. doi: 10.1186/s13293-021-00374-3. Biol Sex Differ. 2021. PMID: 33933156 Free PMC article.
-
Urinary angiotensinogen increases in the absence of overt renal injury in high fat diet-induced type 2 diabetic mice.J Diabetes Complications. 2020 Feb;34(2):107448. doi: 10.1016/j.jdiacomp.2019.107448. Epub 2019 Oct 5. J Diabetes Complications. 2020. PMID: 31761419 Free PMC article.
-
Hydrogen sulfide ameliorates aging-associated changes in the kidney.Geroscience. 2018 Apr;40(2):163-176. doi: 10.1007/s11357-018-0018-y. Epub 2018 May 1. Geroscience. 2018. PMID: 29717417 Free PMC article.
-
Anatomical location, sex, and age modulate adipocyte progenitor populations in perivascular adipose tissues.Front Physiol. 2024 Jul 12;15:1411218. doi: 10.3389/fphys.2024.1411218. eCollection 2024. Front Physiol. 2024. PMID: 39072214 Free PMC article.
-
Epigenetic mechanisms differentially regulate blood pressure and renal dysfunction in male and female Npr1 haplotype mice.FASEB J. 2024 Aug 15;38(15):e23858. doi: 10.1096/fj.202400714R. FASEB J. 2024. PMID: 39109516 Free PMC article.
References
LinkOut - more resources
Full Text Sources
Other Literature Sources
