

Cerebral blood flow is decoupled from blood pressure and linked to EEG bursting after resuscitation from cardiac arrest
- PMID: 27896005
- PMCID: PMC5119605
- DOI: 10.1364/BOE.7.004660
Cerebral blood flow is decoupled from blood pressure and linked to EEG bursting after resuscitation from cardiac arrest
Abstract
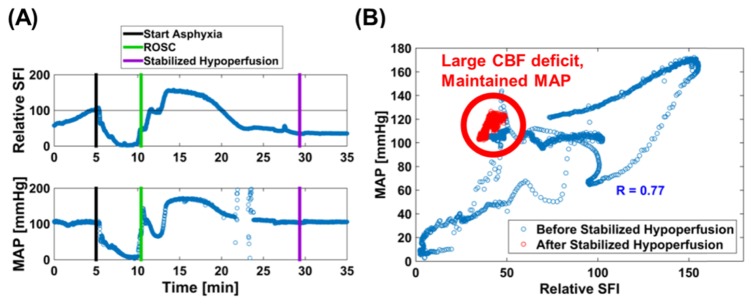
In the present study, we have developed a multi-modal instrument that combines laser speckle imaging, arterial blood pressure, and electroencephalography (EEG) to quantitatively assess cerebral blood flow (CBF), mean arterial pressure (MAP), and brain electrophysiology before, during, and after asphyxial cardiac arrest (CA) and resuscitation. Using the acquired data, we quantified the time and magnitude of the CBF hyperemic peak and stabilized hypoperfusion after resuscitation. Furthermore, we assessed the correlation between CBF and MAP before and after stabilized hypoperfusion. Finally, we examined when brain electrical activity resumes after resuscitation from CA with relation to CBF and MAP, and developed an empirical predictive model to predict when brain electrical activity resumes after resuscitation from CA. Our results show that: 1) more severe CA results in longer time to stabilized cerebral hypoperfusion; 2) CBF and MAP are coupled before stabilized hypoperfusion and uncoupled after stabilized hypoperfusion; 3) EEG activity (bursting) resumes after the CBF hyperemic phase and before stabilized hypoperfusion; 4) CBF predicts when EEG activity resumes for 5-min asphyxial CA, but is a poor predictor for 7-min asphyxial CA. Together, these novel findings highlight the importance of using multi-modal approaches to investigate CA recovery to better understand physiological processes and ultimately improve neurological outcome.
Keywords: (110.6150) Speckle imaging; (120.5475) Pressure measurement; (170.1610) Clinical applications; (170.2655) Functional monitoring and imaging; (170.3880) Medical and biological imaging; (170.5380) Physiology.
Figures


Similar articles
-
Dissociation of Cerebral Blood Flow and Femoral Artery Blood Pressure Pulsatility After Cardiac Arrest and Resuscitation in a Rodent Model: Implications for Neurological Recovery.J Am Heart Assoc. 2020 Jan 7;9(1):e012691. doi: 10.1161/JAHA.119.012691. Epub 2020 Jan 4. J Am Heart Assoc. 2020. PMID: 31902319 Free PMC article.
-
Real-time monitoring of cerebral blood flow by laser speckle contrast imaging after cardiac arrest in rat.Annu Int Conf IEEE Eng Med Biol Soc. 2015;2015:6971-4. doi: 10.1109/EMBC.2015.7319996. Annu Int Conf IEEE Eng Med Biol Soc. 2015. PMID: 26737896 Free PMC article.
-
Magnetic resonance imaging assessment of regional cerebral blood flow after asphyxial cardiac arrest in immature rats.J Cereb Blood Flow Metab. 2009 Jan;29(1):197-205. doi: 10.1038/jcbfm.2008.112. Epub 2008 Oct 1. J Cereb Blood Flow Metab. 2009. PMID: 18827831 Free PMC article.
-
Alterations in Cerebral Blood Flow after Resuscitation from Cardiac Arrest.Front Pediatr. 2017 Aug 16;5:174. doi: 10.3389/fped.2017.00174. eCollection 2017. Front Pediatr. 2017. PMID: 28861407 Free PMC article. Review.
-
Regulation of cerebral blood flow and metabolism during exercise.Exp Physiol. 2017 Nov 1;102(11):1356-1371. doi: 10.1113/EP086249. Epub 2017 Sep 30. Exp Physiol. 2017. PMID: 28786150 Review.
Cited by
-
Wearable speckle plethysmography (SPG) for characterizing microvascular flow and resistance.Biomed Opt Express. 2018 Jul 30;9(8):3937-3952. doi: 10.1364/BOE.9.003937. eCollection 2018 Aug 1. Biomed Opt Express. 2018. PMID: 30338166 Free PMC article.
-
Cortical Anoxic Spreading Depolarization During Cardiac Arrest is Associated with Remote Effects on Peripheral Blood Pressure and Postresuscitation Neurological Outcome.Neurocrit Care. 2022 Jun;37(Suppl 1):139-154. doi: 10.1007/s12028-022-01530-2. Epub 2022 Jun 21. Neurocrit Care. 2022. PMID: 35729464 Free PMC article.
-
High-speed spatial frequency domain imaging of rat cortex detects dynamic optical and physiological properties following cardiac arrest and resuscitation.Neurophotonics. 2017 Oct;4(4):045008. doi: 10.1117/1.NPh.4.4.045008. Epub 2017 Dec 26. Neurophotonics. 2017. PMID: 29296630 Free PMC article.
-
Handheld motion stabilized laser speckle imaging.Biomed Opt Express. 2019 Sep 13;10(10):5149-5158. doi: 10.1364/BOE.10.005149. eCollection 2019 Oct 1. Biomed Opt Express. 2019. PMID: 31646037 Free PMC article.
-
Therapeutic hypothermia promotes cerebral blood flow recovery and brain homeostasis after resuscitation from cardiac arrest in a rat model.J Cereb Blood Flow Metab. 2019 Oct;39(10):1961-1973. doi: 10.1177/0271678X18773702. Epub 2018 May 9. J Cereb Blood Flow Metab. 2019. PMID: 29739265 Free PMC article.
References
-
- Mozaffarian D., Benjamin E. J., Go A. S., Arnett D. K., Blaha M. J., Cushman M., De Ferranti S., Després J. P., Fullerton H. J., Howard V. J., Huffman M. D., Judd S. E., Kissela B. M., Lackland D. T., Lichtman J. H., Lisabeth L. D., Liu S., Mackey R. H., Matchar D. B., McGuire D. K., Mohler E. R., Moy C. S., Muntner P., Mussolino M. E., Nasir K., Neumar R. W., Nichol G., Palaniappan L., Pandey D. K., Reeves M. J., Rodriguez C. J., Sorlie P. D., Stein J., Towfighi A., Turan T. N., Virani S. S., Willey J. Z., Woo D., Yeh R. W., Turner M. B., Heart Disease and Stroke Statistics-2015 Update : A Report from the American Heart Association (2015), Vol. 131. - PubMed
-
- Lee J. K., Brady K. M., Mytar J. O., Kibler K. K., Carter E. L., Hirsch K. G., Hogue C. W., Easley R. B., Jordan L. C., Smielewski P., Czosnyka M., Shaffner D. H., Koehler R. C., “Cerebral blood flow and cerebrovascular autoregulation in a swine model of pediatric cardiac arrest and hypothermia,” Crit. Care Med. 39(10), 2337–2345 (2011).10.1097/CCM.0b013e318223b910 - DOI - PMC - PubMed
Grants and funding
LinkOut - more resources
Full Text Sources
Other Literature Sources