. 2016 Oct 31;7(11):4787-4802.
doi: 10.1364/BOE.7.004787. eCollection 2016 Nov 1.

Wide-field Fourier ptychographic microscopy using laser illumination source

Affiliations

Wide-field Fourier ptychographic microscopy using laser illumination source

Jaebum Chung et al. Biomed Opt Express. .

Abstract

Fourier ptychographic (FP) microscopy is a coherent imaging method that can synthesize an image with a higher bandwidth using multiple low-bandwidth images captured at different spatial frequency regions. The method's demand for multiple images drives the need for a brighter illumination scheme and a high-frame-rate camera for a faster acquisition. We report the use of a guided laser beam as an illumination source for an FP microscope. It uses a mirror array and a 2-dimensional scanning Galvo mirror system to provide a sample with plane-wave illuminations at diverse incidence angles. The use of a laser presents speckles in the image capturing process due to reflections between glass surfaces in the system. They appear as slowly varying background fluctuations in the final reconstructed image. We are able to mitigate these artifacts by including a phase image obtained by differential phase contrast (DPC) deconvolution in the FP algorithm. We use a 1-Watt laser configured to provide a collimated beam with 150 mW of power and beam diameter of 1 cm to allow for the total capturing time of 0.96 seconds for 96 raw FPM input images in our system, with the camera sensor's frame rate being the bottleneck for speed. We demonstrate a factor of 4 resolution improvement using a 0.1 NA objective lens over the full camera field-of-view of 2.7 mm by 1.5 mm.

Keywords: (070.0070) Fourier optics and signal processing; (110.1758) Computational imaging; (180.0180) Microscopy.


Figures

Fig. 1
Fig. 1
Modified FP algorithm to include DPC-generated phase into the iteration. The reconstruction begins with the raw image captured with the illumination from the center mirror element as an initial guess of the sample field. The iteration process starts by forming the sample’s quantitative phase image via DPC deconvolution with the resolution defined by the DPC transfer function. The phase of the sample field with the corresponding resolution is updated. Images captured under varying illuminations are used to update the pupil function and the sample’s Fourier spectrum up to NAsys resolution, just as in the original FP algorithm. The updated pupil function is used to generate an updated DPC-deconvolved phase image for the update process, and the iteration process repeats until convergence. In the end, we reconstruct the complex field of the sample and the pupil function.
Fig. 2
Fig. 2
Experimental setup. It consists of a 4f system with the 2D Galvo mirror system and the mirror array guiding the laser illumination direction. The beam diameter is about 1 cm, covering the entire FOV captured by the camera (2.7 mm by 1.5 mm after magnification). The objective lens has an NA of 0.1 and the total illumination NA is 0.325, resulting in NAsys = 0.425.
Fig. 3
Fig. 3
The Fourier spectrum region covered by the angularly varying illumination and the layout of the mirror array to achieve the desired coverage. With the objective NA of 0.1 and one normal plane wave illumination, the spatial frequency acquired by the system is delineated by the black circle in the Fourier domain. With varying illumination angles, we can expand the extent of the captured spatial frequency, as indicated by the red circle with the NA of 0.425. The mirror array is 30 cm wide and is placed 40 cm away from the sample plane. Each circular bandpass in the Fourier domain, with its size defined by NAobj and its location by the illumination angle provided by each mirror element, has 60% overlap with the contiguous one.
Fig. 4
Fig. 4
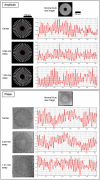
Resolution measurement for amplitude and phase imaging of our laser FPM setup. Both amplitude and phase Siemens star targets are imaged at 3 different locations in the system’s total FOV of 2.7 mm by 1.5 mm for a thorough quantification of the system’s resolution. Normal illumination raw images show the captured image of the corresponding Siemens star target under the illumination by the center mirror element before FP reconstruction. The red circular trace in each reconstructed target corresponds to the smallest circumference at which the spokes pattern are barely observable as shown in the angle (degree) vs. magnitude plot next to each image. The observed resolution of 1.2 μm for 1.29 mm and 1.31 mm away from the center and 1.1 μm for others match closely with the theoretical resolution of λNAsys=1.08μm periodicity.
Fig. 5
Fig. 5
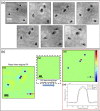
Images of 4.5-μm-diameter microspheres sample. (a) Within the bright-field illumination angular region (NAillum < NAobj) which corresponds to the center 7 mirror elements in Fig. 3, the captured images show fluctuating backgrounds due to coherence artifacts from imperfections in the optical path. (b) Without an additional DPC-deconvolved phase update, the reconstructed phase image shows an uneven background. After the modification, the reconstructed phase is free from the background noise and the resulting phase is also quantitative.
Fig. 6
Fig. 6
Blood smear images, before and after modification in FP algorithm. Without the additional DPC-deconvolved phase update in the reconstruction process, the resulting phase of the sample shows an uneven background signal that also influences the cells’ phase amplitude. After the modification, the background is uniform and the red blood cells show similar phase values. Note, the modification has little or no affect on the amplitude image.
Fig. 7
Fig. 7
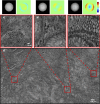
Wide FOV histology image. (a)–(c) show FP reconstructed amplitudes of the sub-regions in the full FOV image in (d). Simultaneous to the sample field reconstruction, FP algorithm also characterizes the pupil function’s amplitude and phase of each sub-region to reconstruct aberration-free high-resolution images.
Fig. 8
Fig. 8
(a–c) DPC transfer functions for 3 pairs of asymmetrical illumination patterns. (d) The spatial frequency extent covered by the DPC-deconvolved phase image. The big circle in the images indicate the 2NA spatial frequency boundary, and the small red circle in (d) indicates NA boundary.

References

    1. Zheng G., Horstmeyer R., Yang C., “Wide-field, high-resolution Fourier ptychographic microscopy,” Nat. Photonics 7(9), 739–745 (2013).10.1038/nphoton.2013.187 - DOI - PMC - PubMed
    1. Ou X., Horstmeyer R., Yang C., Zheng G., “Quantitative phase imaging via Fourier ptychographic microscopy,” Opt. Lett. 38(22), 4845–4848 (2013).10.1364/OL.38.004845 - DOI - PMC - PubMed
    1. Hegerl R., Hoppe W., “Dynamic theory of crystal structure analysis by electron diffraction in the inhomogeneous primary radiation wave field,” Ber. Bunsenges. Phys. Chem. 74(11), 1148–1154 (1970).10.1002/bbpc.19700741112 - DOI
    1. Ou X., Horstmeyer R., Zheng G., Yang C., “High numerical aperture Fourier ptychography: principle, implementation and characterization,” Opt. Express 23(3), 3472–3491 (2015).10.1364/OE.23.003472 - DOI - PMC - PubMed
    1. Chung J., Ou X., Kulkarni R. P., Yang C., “Counting White Blood Cells from a Blood Smear Using Fourier Ptychographic Microscopy,” PloS ONE 10(7), e0133489 (2015).10.1371/journal.pone.0133489 - DOI - PMC - PubMed