. 2016 Nov 17;3(6):ENEURO.0167-16.2016.
doi: 10.1523/ENEURO.0167-16.2016. eCollection 2016 Nov-Dec.

The Memory Trace Supporting Lose-Shift Responding Decays Rapidly after Reward Omission and Is Distinct from Other Learning Mechanisms in Rats

Affiliations

The Memory Trace Supporting Lose-Shift Responding Decays Rapidly after Reward Omission and Is Distinct from Other Learning Mechanisms in Rats

Aaron J Gruber et al. eNeuro. .

Abstract

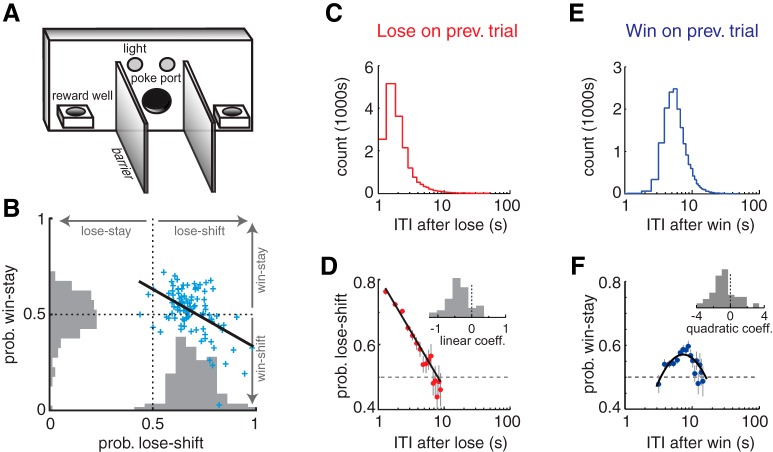
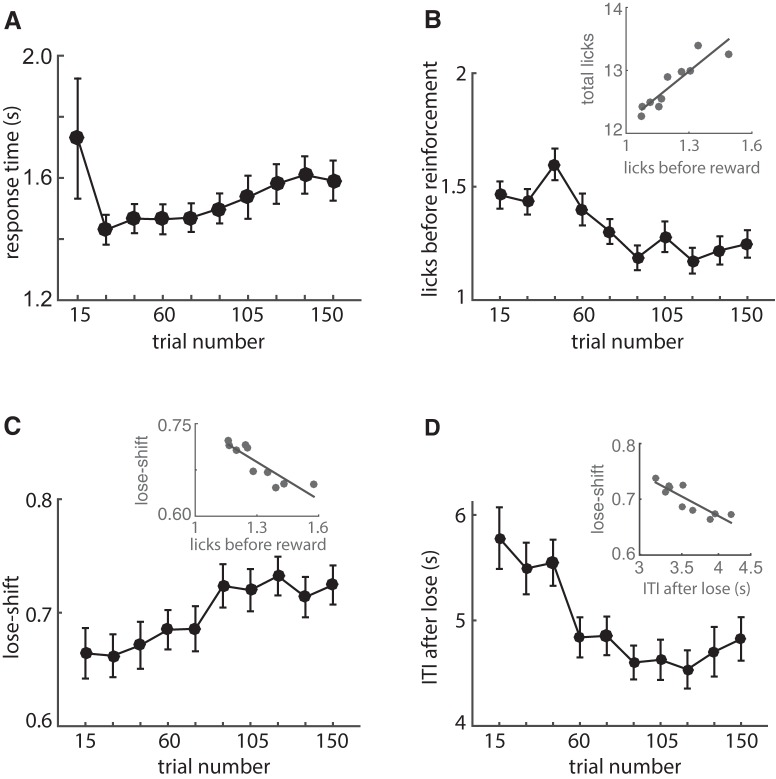
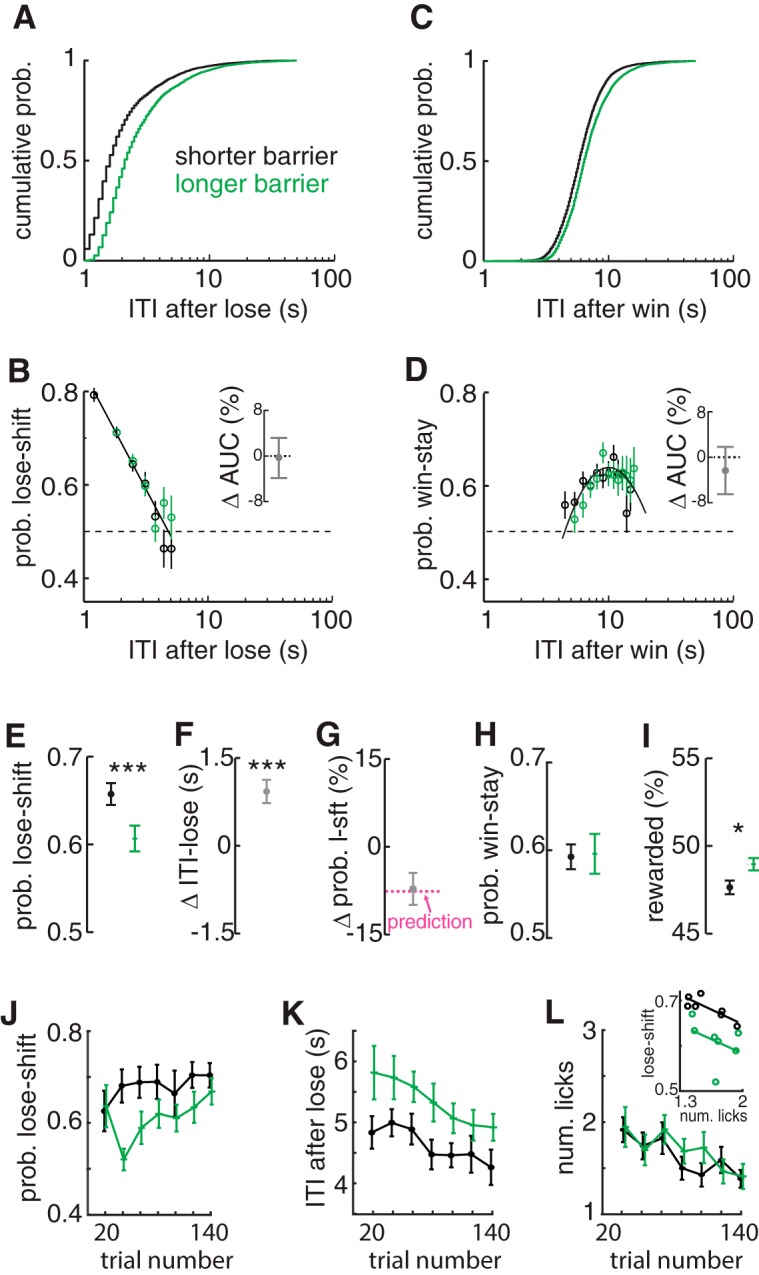
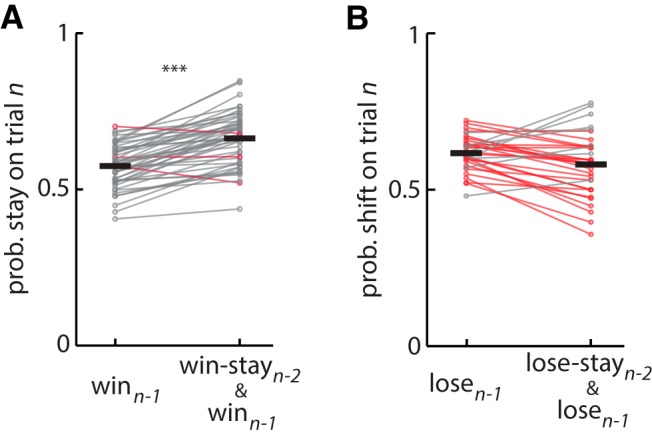
The propensity of animals to shift choices immediately after unexpectedly poor reinforcement outcomes is a pervasive strategy across species and tasks. We report here that the memory supporting such lose-shift responding in rats rapidly decays during the intertrial interval and persists throughout training and testing on a binary choice task, despite being a suboptimal strategy. Lose-shift responding is not positively correlated with the prevalence and temporal dependence of win-stay responding, and it is inconsistent with predictions of reinforcement learning on the task. These data provide further evidence that win-stay and lose-shift are mediated by dissociated neural mechanisms and indicate that lose-shift responding presents a potential confound for the study of choice in the many operant choice tasks with short intertrial intervals. We propose that this immediate lose-shift responding is an intrinsic feature of the brain's choice mechanisms that is engaged as a choice reflex and works in parallel with reinforcement learning and other control mechanisms to guide action selection.

Keywords: WSLS; decay; lose-switch; memory; reinforcement.


Conflict of interest statement

The authors have no conflicts of interest.

Figures

Figure 1.
Figure 1.
Prevalence of win-stay and lose-shift responses. A, Schematic illustration of the behavioral apparatus. B, Scatter plot and population histograms of win-stay and lose-shift responding, showing that these strategies are anticorrelated among subjects. C, Frequency of ITIs after loss trials across the population. D, Probability of lose-shift computed across the population for the bins of ITI in C, revealing a marked log-linear relationship. Individual subjects also exhibit this behavior, as indicated by the nonzero mean of the frequency histogram of linear coefficient terms for fits to each subject’s responses (inset; see text for statistical treatment). E, F, Plots for win-stay analogous to those in C and D reveal a log-parabolic relationship with ITIs in the population and individual subjects. Vertical lines in D and F indicate SEM, and the dashed lines indicate chance levels (Prob = 0.5).
Figure 2.
Figure 2.
Within-session changes of dependent variables. A, Mean response time (from nose-poke to feeder) over 15 consecutive trials and all animals in Fig. 1. Response time increases throughout the session after trial 30, suggesting a progressive decrease in motivation. B, Mean number of licks before reinforcement, which decreases within the session. The number of these anticipatory licks correlates strongly with the total number of licks at each feeder within the session (inset). C, Mean probability of lose-shift, which increases within the session and negatively correlates with licking (inset). D, Mean ITI after loss trials decreases within session. The within-session variance of lose shift correlates strongly with the log of the within-session ITI after losses (inset). Error bars indicate SEM.
Figure 3.
Figure 3.
Invariance of lose-shift and win-stay models to movement times. A, Frequency of population ITIs after losses showing that intervals were increased for long (green) compared with short (dark) barriers. B, Probability of lose-shift computed across the population independently for short (dark) and long (green) barriers. Both conditions were fitted well by the common model (dark solid line). The change in the area under the curve computed independently for each subject between conditions shows no difference (inset), indicating that the mnemonic process underlying lose-shift responding is invariant to the ITI distribution. C, D, Plots of ITI and probability of stay responses after wins, showing that win-stay is also invariant to barrier length. E, Mean lose-shift responding across subjects is decreased by longer barriers. F, Within-subject ITI increases after loss trials under long barriers compared with short barriers. G, Mean within-subject change in the probability of lose-shift due to longer barriers is predicted (magenta dashed line) by the change in ITI based on the log-linear model. H, Mean probability of win-stay computed across animals is not altered by barrier length. I, Long barriers led to more rewarded trials per session because of the reduction in predictable lose-shift responding. J, Mean probability of lose-shift for bins of 20 trials and rats for long and short barriers, showing an increase across sessions for either barrier length. K, Mean ITI after loss for each barrier condition, showing a decrease within the session. L, Mean number of licks prior to reinforcement across the session, showing a decrease within sessions but no effect of barrier length. (L, inset) Plots of lose-shift and licking for each barrier condition, showing that licking is not sufficient to account for variance in lose-shift between barrier conditions. Statistically significant difference among group means: *p < 0.05, ***p < 0.001. Error bars show SEM.
Figure 4.
Figure 4.
Effect of consecutive wins or losses on choice: test for reinforcement learning. A, Plot of probability of a stay response on trial n, after a win (i.e., win-stay; left) or win-stay-win sequence (right) for each rat. The latter is the probability that the rat will chose the same feeder in three consecutive trials given wins on the first two of the set. The data show an increased probability of repeating the choice given two previous wins on the same feeder compared with a win on the previous trial, consistent with RL theory. B, Plot of probability of a switch response on trial n after a loss (lose-shift; left) or after a lose-stay-lose sequence (right). The probability of shifting after two consecutive losses to the same feeder is not greater than the probability of shifting after a loss on the previous trial, which is inconsistent with the predictions of RL theory. In both plots, gray lines indicate a within-subject increase in probability, whereas red lines indicate a decrease. ***Statistical significance of increased probability (p < 0.001) within subjects.
Figure 5.
Figure 5.
Responses during every training session for one cohort. Responses plotted for each rat (symbol-color) and each day of training. Session 1 is the second time the rats were placed into the behavioral box, and reward probability was p = 0.5 for each feeder regardless of previous responses or rewards. A, Number of trials completed in each session. Rats were allowed 90 min to complete up to 150 trials in sessions 1–10, and hallways of increasing lengths were introduced in sessions 3–8. B–D, Plot of the probability of responding to the rightward feeder, probability of lose-shift, and probability of win-stay during the first 16 sessions. The majority of rats showed no side bias, strong lose-shift, and very little win-stay in initial trials. Only a few rats showed initial side bias, and therefore little lose-shift and strong win-stay (blue shading in panels B–D). Lose-shift was invariant over training, whereas win-stay increased (see text). Dark lines indicate median across all subjects for each day.

Similar articles

Cited by

References

    1. Alexander WH, Brown JW (2011) Medial prefrontal cortex as an action-outcome predictor. Nat Neurosci 14:1338–1344. 10.1038/nn.2921 - DOI - PMC - PubMed
    1. Altmann EM, Gray WD (2002) Forgetting to remember: the functional relationship of decay and interference. Psychol Sci 13:27–33. - PubMed
    1. Amodeo DA, Jones JH, Sweeney JA, Ragozzino ME (2012) Differences in BTBR T+ tf/J and C57BL/6J mice on probabilistic reversal learning and stereotyped behaviors. Behav Brain Res 227:64–72. 10.1016/jBbr.2011.10.032 - DOI - PMC - PubMed
    1. Amsel A (1958) The role of frustrative nonreward in noncontinuous reward situations. Psychol Bull 55:102–119. - PubMed
    1. Balleine BW, O’Doherty JP (2010) Human and rodent homologies in action control: corticostriatal determinants of goal-directed and habitual action. Neuropsychopharmacology 35:48–69. 10.1038/npp.2009.131 - DOI - PMC - PubMed

Publication types