. 2017 Apr;18(2):355-369.
doi: 10.1007/s10162-016-0603-7. Epub 2016 Nov 28.

Neural Correlates of the Binaural Masking Level Difference in Human Frequency-Following Responses

Affiliations

Neural Correlates of the Binaural Masking Level Difference in Human Frequency-Following Responses

Christopher G Clinard et al. J Assoc Res Otolaryngol. 2017 Apr.

Abstract

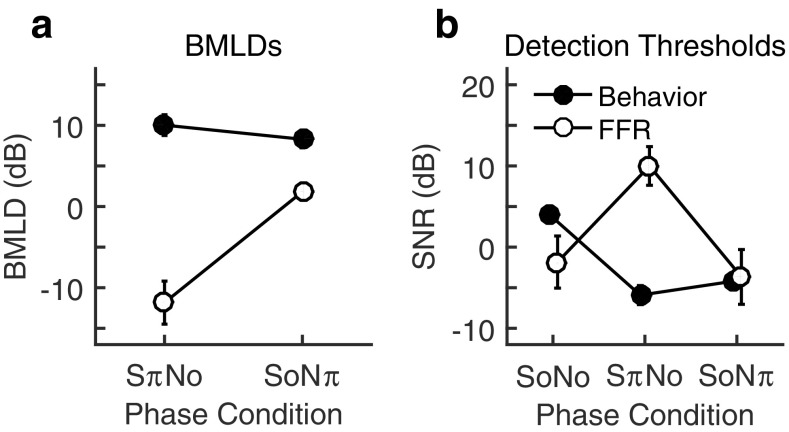
The binaural masking level difference (BMLD) is an auditory phenomenon where binaural tone-in-noise detection is improved when the phase of either signal or noise is inverted in one of the ears (SπNo or SoNπ, respectively), relative to detection when signal and noise are in identical phase at each ear (SoNo). Processing related to BMLDs and interaural time differences has been confirmed in the auditory brainstem of non-human mammals; in the human auditory brainstem, phase-locked neural responses elicited by BMLD stimuli have not been systematically examined across signal-to-noise ratio. Behavioral and physiological testing was performed in three binaural stimulus conditions: SoNo, SπNo, and SoNπ. BMLDs at 500 Hz were obtained from 14 young, normal-hearing adults (ages 21-26). Physiological BMLDs used the frequency-following response (FFR), a scalp-recorded auditory evoked potential dependent on sustained phase-locked neural activity; FFR tone-in-noise detection thresholds were used to calculate physiological BMLDs. FFR BMLDs were significantly smaller (poorer) than behavioral BMLDs, and FFR BMLDs did not reflect a physiological release from masking, on average. Raw FFR amplitude showed substantial reductions in the SπNo condition relative to SoNo and SoNπ conditions, consistent with negative effects of phase summation from left and right ear FFRs. FFR amplitude differences between stimulus conditions (e.g., SoNo amplitude-SπNo amplitude) were significantly predictive of behavioral SπNo BMLDs; individuals with larger amplitude differences had larger (better) behavioral B MLDs and individuals with smaller amplitude differences had smaller (poorer) behavioral B MLDs. These data indicate a role for sustained phase-locked neural activity in BMLDs of humans and are the first to show predictive relationships between behavioral BMLDs and human brainstem responses.

Keywords: auditory; binaural; binaural masking level difference; frequency-following response; neurophonic; phase locking.


Conflict of interest statement

Conflict of Interest

The authors declare that they have no conflict of interest.

Figures

FIG. 1
FIG. 1
Individual data from a 22-year-old participant elicited using SoNo 500 Hz conditions. a Examples of response FFTs at various stimulus SNRs tested for the SoNo condition. FFR amplitude decreased as the acoustic SNR of the stimulus decreased; response was absent at −12 dB SNR. b An FFR waveform that was elicited with a 20 dB SNR.
FIG. 2
FIG. 2
a Binaural masking level differences for behavioral (filled symbols) and physiological (open symbols) data. b Detection thresholds for behavioral (filled symbols) and physiological (open symbols) data. Data points have been slightly shifted along the abscissa to minimize overlapping data points. Errors bars are one standard error. Behavioral data indicate a release from masking, but average FFR data do not reflect a release from masking.
FIG. 3
FIG. 3
Double y-axis plots showing average data and average logistic fits to reconstructed psychometric functions (left axis, filled symbols, solid lines) and normalized FFR amplitude (right axis, open symbols, dashed lines) for each phase condition. ac Data for individual phase conditions. d Average logistic fits are shown for all conditions and demonstrate improved behavioral detection in antiphasic conditions, while normalized FFR amplitude trends are similar across phase conditions. The solid horizontal line at 0.707 represents behavioral threshold from the adaptive task, and the dotted horizontal line at 0.5 represents chance behavioral performance. Error bars are one standard error; conditions with only one data point have error bars equivalent to zero.
FIG. 4
FIG. 4
Bivariate scatterplots of FFR BMLDs and behavioral BMLDs for SπNo (a) and SoNπ (b). Filled symbols indicate an FFR BMLD >0 dB, and open symbols indicate an FFR BMLD ≤0 dB. FFR BMLDs were not predictive of behavioral BMLDs.
FIG. 5
FIG. 5
Binaural masking level differences and detection thresholds for behavioral (filled symbols) and physiological (open symbols) conditions, where FFR detection thresholds were redefined as 0.707 normalized amplitude. Behavioral data shown here are the same as those in Fig. 2. Errors bars are one standard error. FFR detection thresholds do not reflect a release from masking when using this alternate definition of physiological detection threshold.
FIG. 6
FIG. 6
Bivariate scatterplots of FFR BMLDs and behavioral BMLDs for SπNo (a) and SoNπ (b), where FFR BMLDs were based on 0.707 normalized FFR amplitude detection thresholds, similar to the behavioral definition of detection threshold. Filled symbols indicate an FFR BMLD >0 dB, and open symbols indicate an FFR BMLD ≤0 dB. Redefined FFR BMLDs did not predict behavioral BMLDs.
FIG. 7
FIG. 7
Raw FFR amplitudes across stimulus SNR and phase conditions. ac FFR amplitude for each phase condition. Average (filled symbols) and individual data (open symbols) are shown with average logistic fits (bold lines) and fits to individual data (thin, gray lines). d Average fits from all phase conditions. Some SNRs (e.g., SoNo, 14 dB SNR) have only one or a small number of subjects. Error bars are one standard error.
FIG. 8
FIG. 8
Raw FFR amplitude differences between phase conditions as a function of stimulus SNR. ac Average (filled symbol) and individual data (open symbols) for the SoNo–SπNo, SoNo–SoNπ, and SoNπ–SπNo amplitude differences, respectively. d Average amplitude differences are shown for conditions with at least three subjects; data points have been slightly offset along the abscissa to minimize overlapping data points. Error bars are one standard error.
FIG. 9
FIG. 9
Bivariate scatterplots of FFR amplitude differences from 12 dB SNR conditions and behavioral SπNo BMLDs. R 2 values and lines of best fit include participants with at least a 3 dB behavioral BMLD; the open datum point in each panel was excluded from regression analysis. FFR amplitude differences were significantly predictive of behavioral SπNo BMLDs.

References

    1. Aiken SJ, Picton TW. Envelope and spectral frequency-following responses to vowel sounds. Hear Res. 2008;245:35–47. doi: 10.1016/j.heares.2008.08.004. - DOI - PubMed
    1. Ashida G, Funabiki K, Carr CE. Biophysical basis of the sound analog membrane potential that underlies coincidence detection in the barn owl. Front Comput Neurosci. 2013;7:102. - PMC - PubMed
    1. Ashida G, Funabiki K, Carr CE. Theoretical foundations of the sound analog membrane potential that underlies coincidence detection in the barn owl. Front Comput Neurosci. 2013;7:151. - PMC - PubMed
    1. Ashida G, Funabiki K, Kuokkanen PT, Kempter R, Carr CE. Signal-to-noise ratio in the membrane potential of the owl’s auditory coincidence detectors. J Neurophysiol. 2012;108:2837–2845. doi: 10.1152/jn.00366.2012. - DOI - PMC - PubMed
    1. Ballachanda BB, Moushegian G. Frequency-following response: effects of interaural time and intensity differences. J Am Acad Audiol. 2000;11:1–11. - PubMed

LinkOut - more resources