

A method for evaluating the performance of computer-aided detection of pulmonary nodules in lung cancer CT screening: detection limit for nodule size and density
- PMID: 27897029
- PMCID: PMC5685125
- DOI: 10.1259/bjr.20160313
A method for evaluating the performance of computer-aided detection of pulmonary nodules in lung cancer CT screening: detection limit for nodule size and density
Abstract
Objective: We propose the application of virtual nodules to evaluate the performance of computer-aided detection (CAD) of lung nodules in cancer screening using low-dose CT.
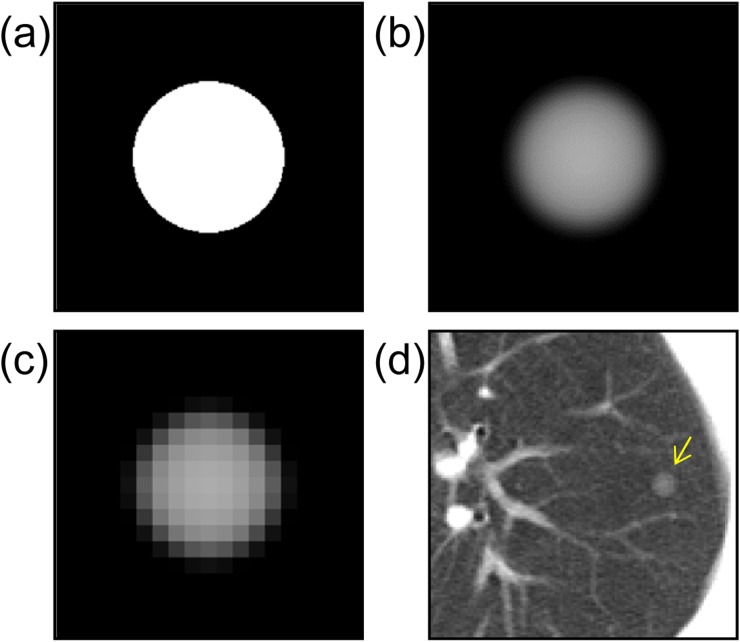
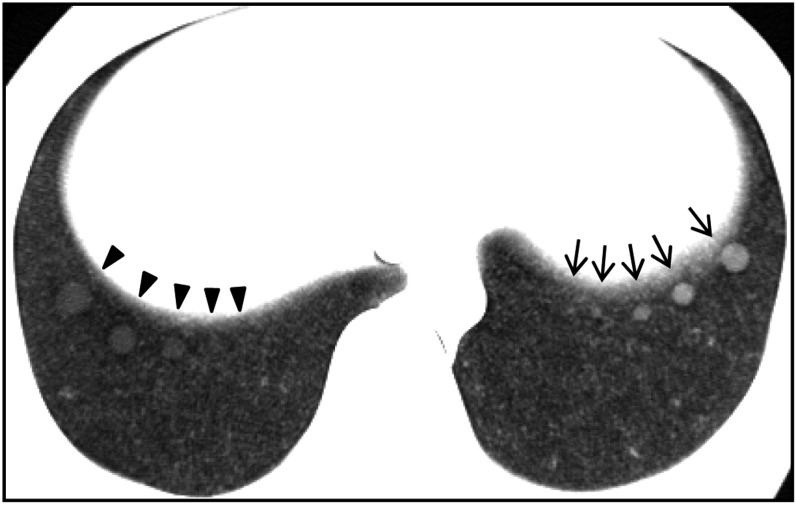
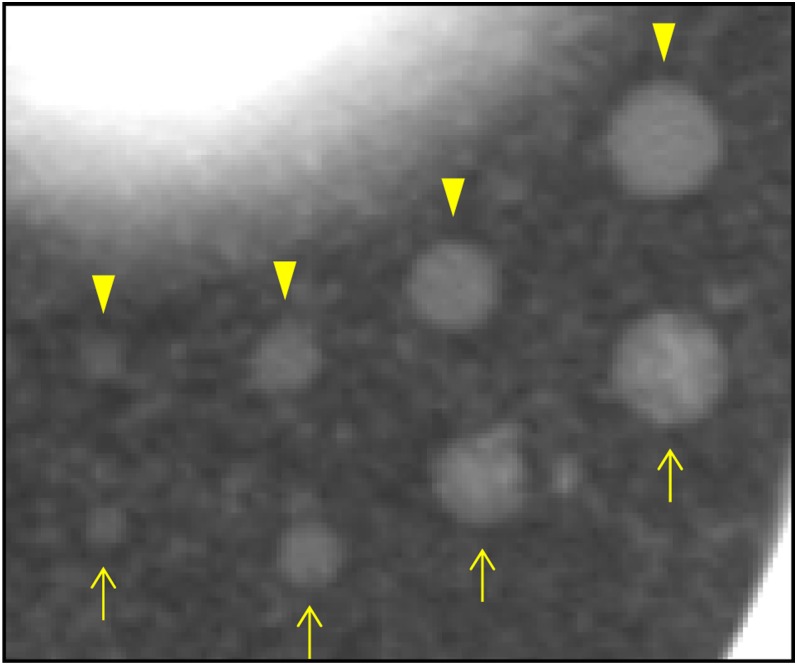
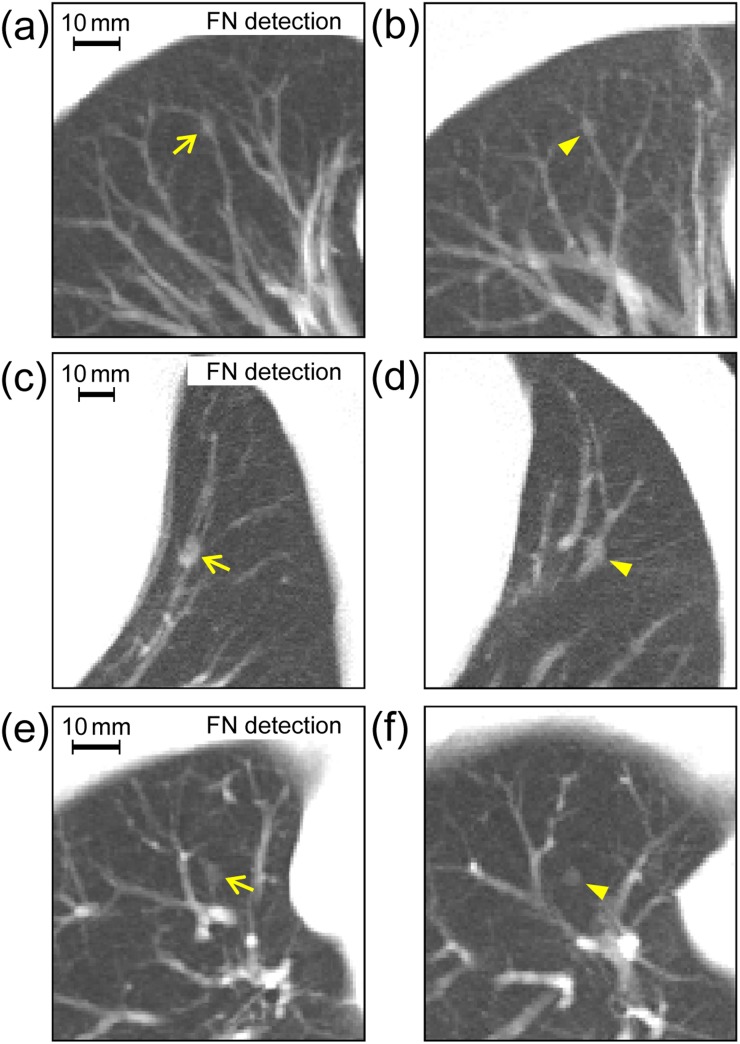
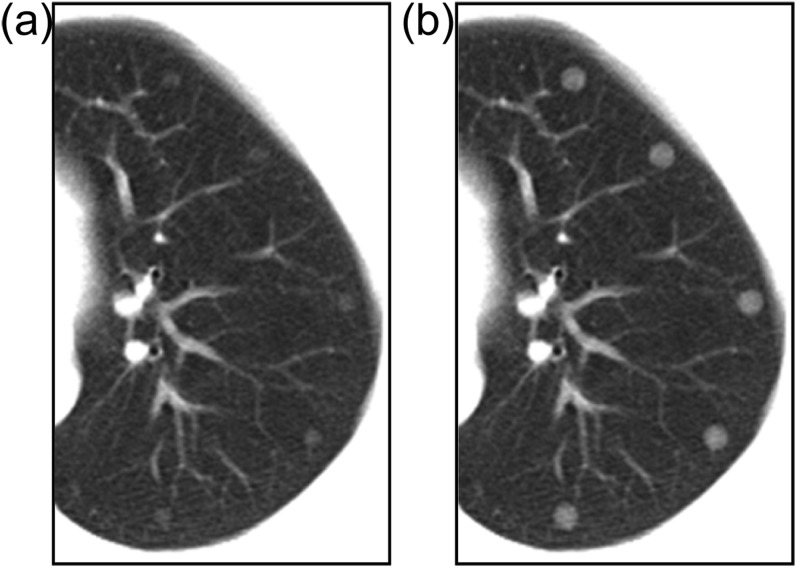
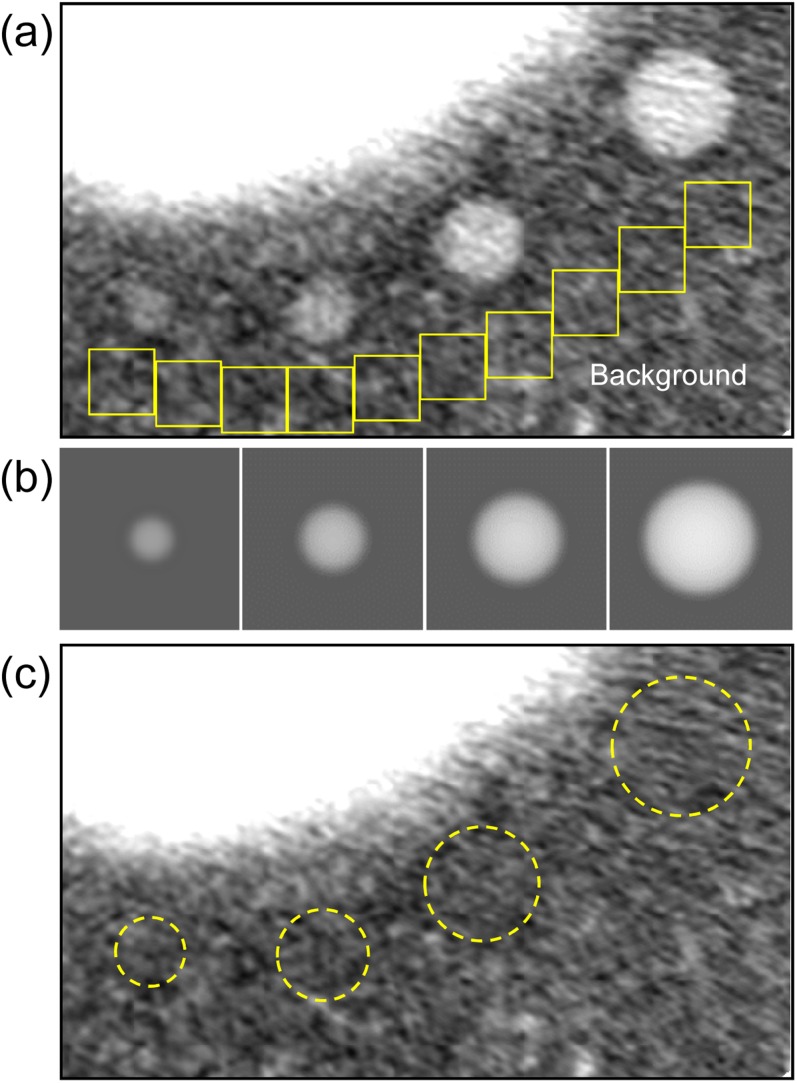
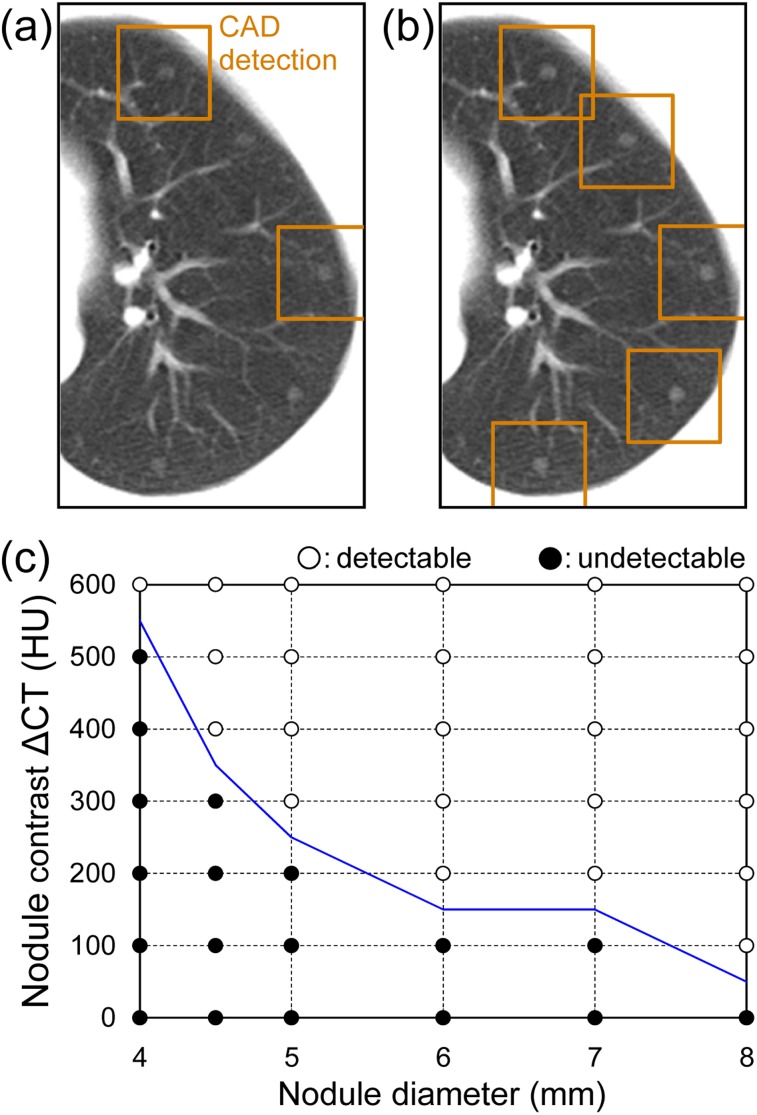
Methods: The virtual nodules were generated based on the spatial resolution measured for a CT system used in an institution providing cancer screening and were fused into clinical lung images obtained at that institution, allowing site specificity. First, we validated virtual nodules as an alternative to artificial nodules inserted into a phantom. In addition, we compared the results of CAD analysis between the real nodules (n = 6) and the corresponding virtual nodules. Subsequently, virtual nodules of various sizes and contrasts between nodule density and background density (ΔCT) were inserted into clinical images (n = 10) and submitted for CAD analysis.
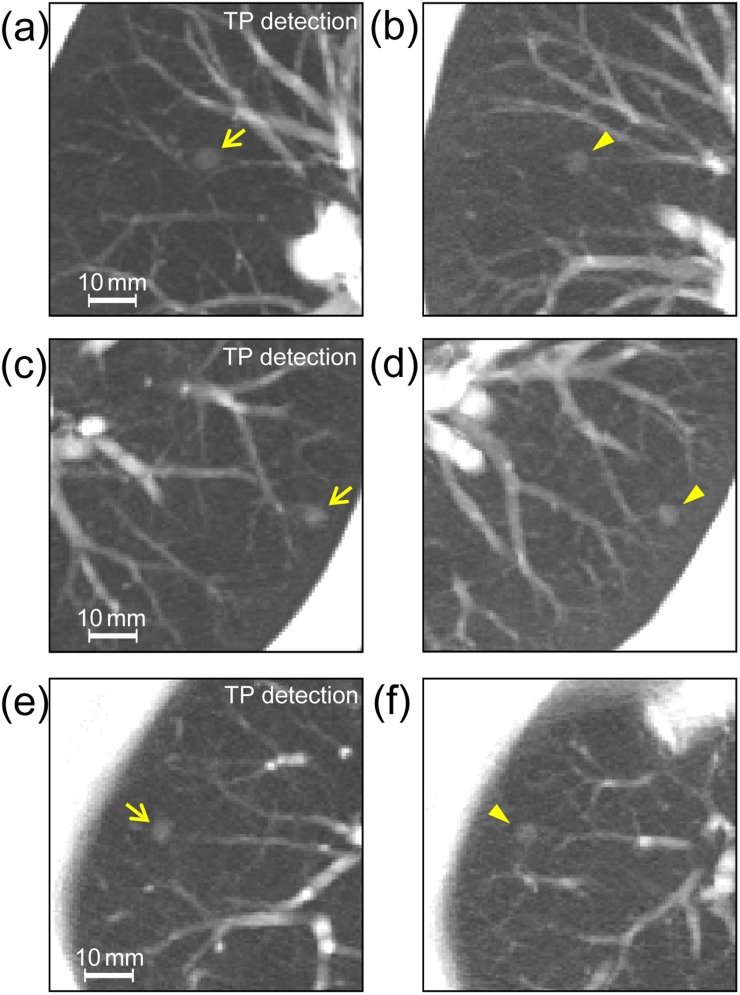
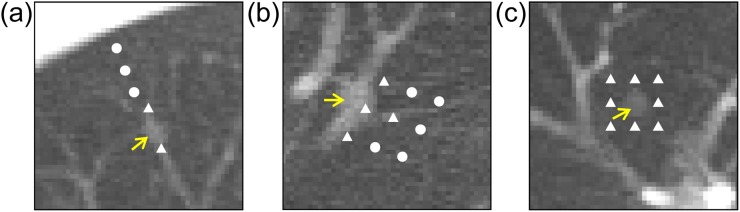
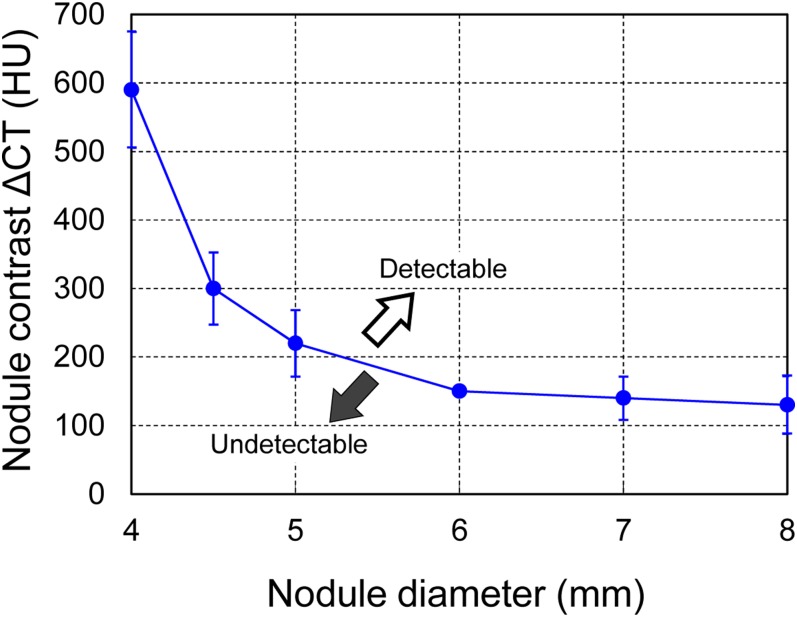
Results: In the validation study, 46 of 48 virtual nodules had the same CAD results as artificial nodules (kappa coefficient = 0.913). Real nodules and the corresponding virtual nodules showed the same CAD results. The detection limits of the tested CAD system were determined in terms of size and density of peripheral lung nodules; we demonstrated that a nodule with a 5-mm diameter was detected when the nodule had a ΔCT > 220 HU.
Conclusion: Virtual nodules are effective in evaluating CAD performance using site-specific scan/reconstruction conditions. Advances in knowledge: Virtual nodules can be an effective means of evaluating site-specific CAD performance. The methodology for guiding the detection limit for nodule size/density might be a useful evaluation strategy.
Figures
Similar articles
-
Computer-aided detection of pulmonary nodules: a comparative study using the public LIDC/IDRI database.Eur Radiol. 2016 Jul;26(7):2139-47. doi: 10.1007/s00330-015-4030-7. Epub 2015 Oct 6. Eur Radiol. 2016. PMID: 26443601 Free PMC article.
-
Computer-aided diagnosis (CAD) of subsolid nodules: Evaluation of a commercial CAD system.Eur J Radiol. 2016 Oct;85(10):1728-1734. doi: 10.1016/j.ejrad.2016.07.011. Epub 2016 Jul 18. Eur J Radiol. 2016. PMID: 27666609
-
Computer-aided detection (CAD) of solid pulmonary nodules in chest x-ray equivalent ultralow dose chest CT - first in-vivo results at dose levels of 0.13mSv.Eur J Radiol. 2016 Dec;85(12):2217-2224. doi: 10.1016/j.ejrad.2016.10.006. Epub 2016 Oct 11. Eur J Radiol. 2016. PMID: 27842670 Clinical Trial.
-
The Added Value of Computer-aided Detection of Small Pulmonary Nodules and Missed Lung Cancers.J Thorac Imaging. 2018 Nov;33(6):390-395. doi: 10.1097/RTI.0000000000000362. J Thorac Imaging. 2018. PMID: 30239461 Review.
-
A review of lung cancer screening and the role of computer-aided detection.Clin Radiol. 2017 Jun;72(6):433-442. doi: 10.1016/j.crad.2017.01.002. Epub 2017 Feb 6. Clin Radiol. 2017. PMID: 28185635 Review.
Cited by
-
Multi-scale detection of pulmonary nodules by integrating attention mechanism.Sci Rep. 2023 Apr 4;13(1):5517. doi: 10.1038/s41598-023-32312-1. Sci Rep. 2023. PMID: 37015969 Free PMC article.
-
Cancer cell population growth kinetics at low densities deviate from the exponential growth model and suggest an Allee effect.PLoS Biol. 2019 Aug 5;17(8):e3000399. doi: 10.1371/journal.pbio.3000399. eCollection 2019 Aug. PLoS Biol. 2019. PMID: 31381560 Free PMC article.
-
Comparative evaluation of conventional and deep learning methods for semi-automated segmentation of pulmonary nodules on CT.Quant Imaging Med Surg. 2021 Jul;11(7):3286-3305. doi: 10.21037/qims-20-1356. Quant Imaging Med Surg. 2021. PMID: 34249654 Free PMC article.
-
[Expert Consensus for Thermal Ablation of Pulmonary Subsolid Nodules (2021 Edition)].Zhongguo Fei Ai Za Zhi. 2021 May 20;24(5):305-322. doi: 10.3779/j.issn.1009-3419.2021.101.14. Epub 2021 Apr 26. Zhongguo Fei Ai Za Zhi. 2021. PMID: 33896152 Free PMC article. Chinese.
-
Computer-Aided Detection of Pulmonary Nodules in Computed Tomography Using ClearReadCT.J Med Syst. 2019 Jan 31;43(3):58. doi: 10.1007/s10916-019-1180-1. J Med Syst. 2019. PMID: 30706143
References
-
- Church TR, Black WC, Aberle DR, Berg CD, Clingan KL, Duan F, et al. ; National Lung Screening Trial Research Team. Results of initial low-dose computed tomographic screening for lung cancer. N Engl J Med 2013; 368: 1980–91. doi: https://doi.org/10.1056/NEJMoa1209120 - DOI - PMC - PubMed
-
- Armato SG, 3rd, Roy AS, Macmahon H, Li F, Doi K, Sone S, et al. . Evaluation of automated lung nodule detection on low-dose computed tomography scans from a lung cancer screening program. Acad Radiol 2005; 12: 337–46. doi: https://doi.org/10.1016/j.acra.2004.10.061 - DOI - PubMed
-
- Zhao Y, de Bock GH, Vliegenthart R, van Klaveren RJ, Wang Y, Bogoni L, et al. . Performance of computer-aided detection of pulmonary nodules in low-dose CT: comparison with double reading by nodule volume. Eur Radiol 2012; 22: 2076–84. doi: https://doi.org/10.1007/s00330-012-2437-y - DOI - PMC - PubMed
-
- Zinovev D, Duo Y, Raicu DS, Furst J, Armato SG. Consensus versus disagreement in imaging research: a case study using the LIDC database. J Digit Imaging 2012; 25: 423–36. doi: https://doi.org/10.1007/s10278-011-9445-3 - DOI - PMC - PubMed
-
- Godoy MC, Kim TJ, White CS, Bogoni L, de Groot P, Florin C, et al. . Benefit of computer-aided detection analysis for the detection of subsolid and solid lung nodules on thin- and thick-section CT. AJR Am J Roentgenol 2013; 200: 74–83. doi: https://doi.org/10.2214/AJR.11.7532 - DOI - PubMed
Publication types
MeSH terms
LinkOut - more resources
Full Text Sources
Other Literature Sources
Medical
Miscellaneous
