. 2017 Feb;95(2):215-223.
doi: 10.1038/icb.2016.83. Epub 2016 Nov 29.

Batf3 selectively determines acquisition of CD8+ dendritic cell phenotype and function

Affiliations

Batf3 selectively determines acquisition of CD8+ dendritic cell phenotype and function

Janin Chandra et al. Immunol Cell Biol. 2017 Feb.

Abstract

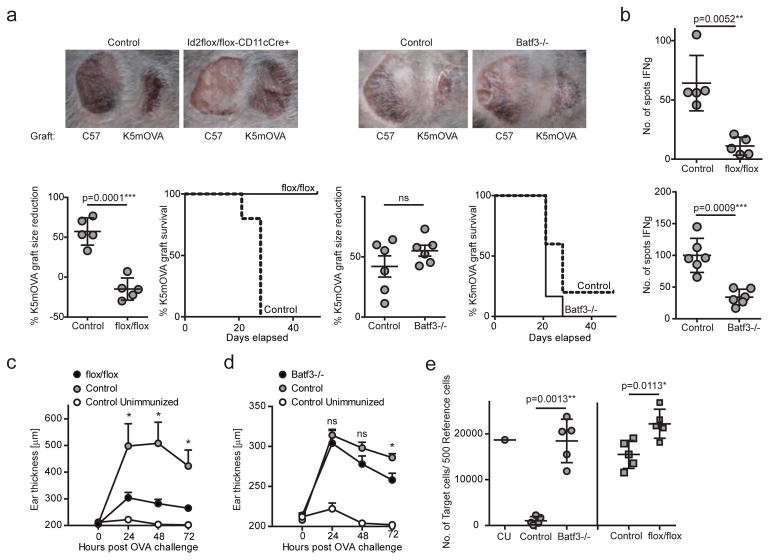
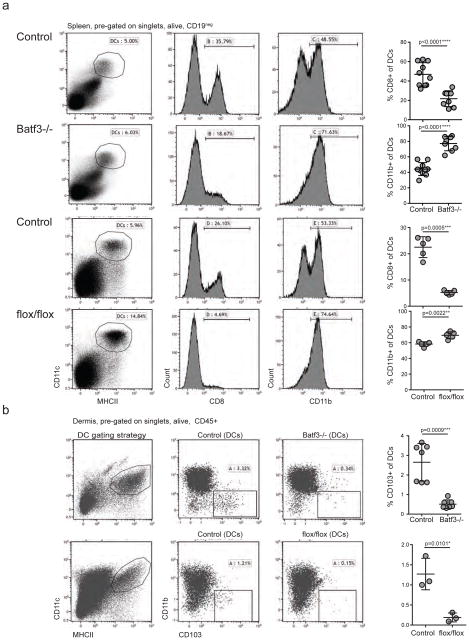
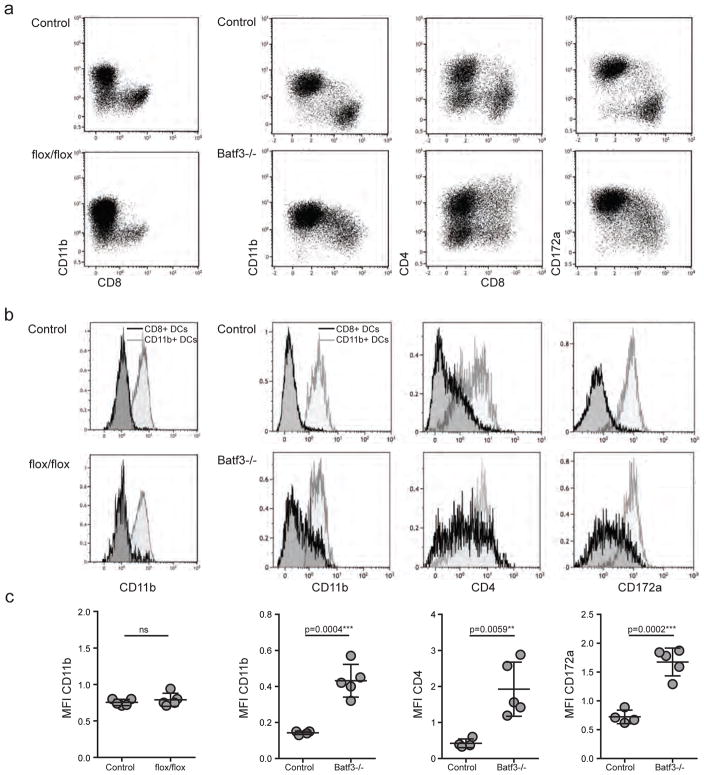
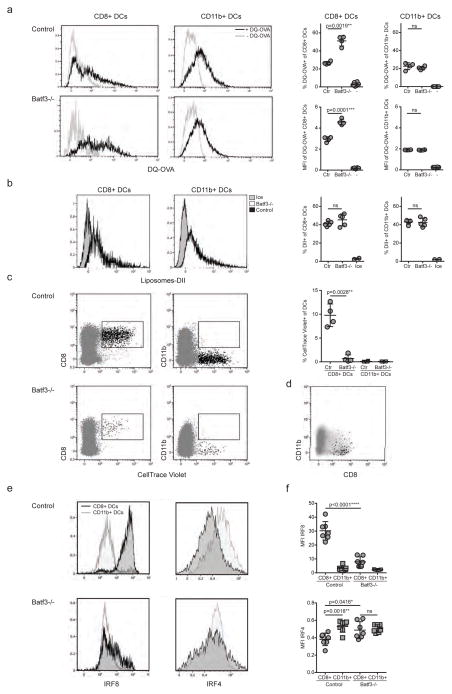
Batf3 is a transcription factor that impacts the development of CD103+ tissue-resident dendritic cells (DCs). However, whether Batf3 is absolutely required for the development of CD8+ DCs remains controversial. Id2 is required for CD8+ DC development. Here we show that bone marrow chimeric mice with a deletion of Id2 in the CD11c compartment lose the ability to reject a skin graft expressing a non-self protein antigen or mount a delayed hypersensitivity response. In contrast, Batf3-/- mice remained competent for skin graft rejection and delayed hypersensitivity, and retained a CD8+ DC population with markers characteristic of the CD11b+ DC lineage, including CD11b, CD4 and CD172α, as well as the key regulator transcription factor IRF4, but lacked IRF8 expression. CD8+ DCs in Batf3-/- mice took up and cleaved protein antigen and larger particles but were unable to phagocytose dying cells, a characteristic feature to the CD8+ DC lineage. These data clarify a requirement for CD8+ lineage DCs to induce effectors of neo-antigen-driven skin graft rejection, and improve our understanding of DC subtype commitment by demonstrating that in the absence of Batf3 CD8+ DCs can change their fate and become CD11b+ DCs.


Conflict of interest statement

The authors declare no competing financial interests.

Figures

Figure 1
Figure 1. Batf3-independent but not Id2-independent CD8+ DCs contribute to neo-antigen driven skin graft rejection and DTH
(a) Ear skin of C57BL/6 (left) and K5mOVA (right) mice was grafted onto Id2flox/flox-CD11cCre+ (flox/flox) and control chimeras or Batf3−/− and control mice. Grafts were assessed and measured weekly for 7 to 8 weeks. Shown are representative photographs of one mouse per group. Size of grafts was depicted using imaging software. Each point represents one animal with indication of mean +/− SD of whole group (n=5–6). Graft survival curves depict loss of grafts defined as necrosis and ulceration. (b) At termination of the grafting assessment, lymph node cells were restimulated with SIINFEKL and IFNγ-producing T cells were counted by ELISPOT. Each point represents one animal with indication of mean +/− SD of whole group (n=5–6). (c–d) Id2flox/flox-CD11cCre+ (flox/flox) and control chimeras (c) or Batf3−/− and control mice (d) were immunized intradermally with OVA and QuilA. Seven days later, mice were challenged with OVA delivered to ear skin. Ear thickness was measured before and up to 72 hours post OVA injection. Each point represents means +/− SEM of whole group (n=10 of two independent pooled experiments for c, n=5 of one independent experiment for d) at 24, 48 and 72 hours post OVA challenge. (e) Id2flox/flox-CD11cCre+ (flox/flox) and control chimeras or Batf3−/− and control mice were immunized intradermally with OVA and QuilA. Seven days later, mice received a 1:40 ratio of CFSE labelled naked reference and SIINFEKL-pulsed target cells delivered intravenously. Spleens were analysed for killing of target cells 18 hours after transfer by flow cytometry. The graph indicates the number of target cells per 500 reference cells. CU: Control Unimmunized. Each point represents one animal with indication of mean +/− SD of whole group (n=5). Shown is one of two independent experiments. For statistics, transgenic mice were compared with controls. *, p<0.05; **, p<0.01; ***, p<0.001; ****, p<0.0001 (unpaired two-tailed t-test).
Figure 2
Figure 2. Batf3−/− mice contain a residual population of CD8+ DCs and increased numbers of CD11b+ DCs
(a) Splenocytes of Batf3−/−, Id2flox/flox-CD11cCre+ chimeras and control mice were analysed by flow cytometry. CD11c+ MHCII+ DCs (pre-gated on live singlets, CD19neg, TCRβneg) were assessed for expression of CD8 and CD11b. Each row of flow cytometry plots stems from one representative mouse per group. Each point in graph represents one animal with indication of mean +/− SD of whole group. (n=5 to 10, pooled from up to 3 independent experiments). (b) Ear skin of Batf3−/−, Id2flox/flox-CD11cCre+ chimeras and control mice was separated into dermis and epidermis. Live singlets, CD45+ cells were assessed for a population of MHCII+ CD11c+ DCs that was further gated onto CD103+ DCs by flow cytometry. In the graph, each point represents one animal with indication of mean +/− SD of whole group. For Batf3−/− mice shown are data pooled from 2 independent experiments (n=7). For Id2flox/flox-CD11cCre+ chimeras shown is one representative from 2 independent experiments, n=3). For statistics, transgenic mice were compared with controls. *, p<0.05; **, p<0.01; ***, p<0.001; ****, p<0.0001 (unpaired two-tailed t-test).
Figure 3
Figure 3. Batf3-independent but not Id2-independent CD8+ DCs express CD11b, CD4 and CD172α
(a) DCs in spleens of Id2flox/flox-CD11cCre+ chimeras (flox/flox) and controls or Batf3−/− and controls were gated as live singlets, CD19neg, TCRβneg, MHCII+ and CD11c+ as depicted in Figure 2. From these cells, expression of CD8 was plotted against CD11b, CD4 and CD172α. Shown are flow cytometry plots for one representative mouse per group. (b) DCs gated as depicted in C were further gated onto CD8+ DCs and CD11b+ DCs according to the gating strategy used in Supplementary Figure 1. Overlay histograms represent expression of CD11b, CD4 and CD172α of CD8+ DCs (black line) and CD11b+ DCs (grey line). (c) The median fluorescent intensity of CD11b, CD4 and CD172α of CD8+ DCs in Id2flox/flox-CD11cCre+ (flox/flox), Batf3−/− and control mice from data shown in C and D was compared. Each point represents one animal with indication of mean +/− SD of whole group (n= 4 to 5, pooled from 2 of 4 independent experiments). For statistics, transgenic mice were compared with controls. *, P<0.05; **, P<0.01; ***, P<0.001; ****, P<0.0001 (unpaired two-tailed t-test).
Figure 4
Figure 4. IRF4-expressing CD8+ DCs in Batf3−/− mice are able to process antigen but lose capacity to take up dying cells
(a) Splenocytes of Batf3−/− and control mice were incubated with DQ-OVA for 3 hours and subsequently analysed by flow cytometry for DQ-OVA processing. CD8+ and CD11b+ dendritic cell subsets were gated as shown in Figure 2. Shown are representative histograms of green fluorescence (DQ-OVA) of treated versus untreated CD8+ and CD11b+ DCs in Batf3−/− and control splenocytes. The percentage and MFI of DQ-OVA+ CD8+ or CD11b+ DCs as well as of untreated samples (−) was compared. Each point represents a sample of one animal with indication of mean +/− SD of whole group (n=4). Shown is one of two independent experiments. (b) Splenocytes of Batf3−/− and control mice were incubated with DiI-labelled liposomes for 90 min and subsequently analysed by flow cytometry for liposome uptake. Shown are representative histograms of red fluorescence (DiI+) of CD8+ and CD11b+ DCs in Batf3−/− and control splenocytes incubated at 37°C or on ice. The percentage of DiI+ cells of CD8+ or CD11b+ DCs was compared. Each point represents a sample of one animal with indication of mean+/− SD of the whole group (n=5). (c–d) CellTrace Violet labelled, UV irradiated dying cells were injected into Batf3−/− and control mice. 3 hours later, splenic CD11b+ and CD8+ DCs were analysed for endocytosis of dying cells. (c) Shown are flow cytometry plots that were pre-gated on DCs as shown in Supplementary Figure 1, then CellTrace Violet was plotted against CD8+ and CD11b+. CellTrace Violet+ cells depict DCs that endocytosed dying cells. In the graph, shown are percentages of CellTrace Violet+ cells of CD8+ and CD11b+ DCs. Each point represents one animal with indication of mean +/− SD of the whole group (representative of three independent experiments, n=4). (d) Whole DCs (grey) and CellTrace Violet+ CD8+ DCs (black) of one representative Batf3−/− mouse from (c) was plotted against CD11b to indicate that CellTrace Violet+ CD8+ DCs are CD11b-. (e–f) Splenocytes of Batf3−/− and control mice were surface stained for DC markers and intracellular stained for IRF4 and IRF8. Splenocytes were pre-gated on live singlets, CD19neg, TCRβneg, MHCII+ and CD11c+, CD8+ or CD11b+ (as depicted in Figure 2). (e) Shown are representative histograms of IRF8 and IRF4 expression of CD8+ (black line) and CD11b+ DCs (grey line) of one mouse per group. (f) Mean fluorescent intensities of IRF4 and IRF8 in CD8+ and CD11b+ DCs are depicted. Each point represents one animal with indication of mean +/− SD of whole group. Shown is data of two pooled independent experiments (n=7). For statistics, transgenic mice were compared with controls. *, P<0.05; **, P<0.01; ***, P<0.001; ****, P<0.0001 (unpaired two-tailed t-test).

Similar articles

Cited by

References

    1. Bedoui S, Whitney PG, Waithman J, Eidsmo L, Wakim L, Caminschi I, et al. Cross-presentation of viral and self antigens by skin-derived CD103+ dendritic cells. Nat Immunol. 2009;10(5):488–95. - PubMed
    1. Chu CC, Ali N, Karagiannis P, Di Meglio P, Skowera A, Napolitano L, et al. Resident CD141 (BDCA3)+ dendritic cells in human skin produce IL-10 and induce regulatory T cells that suppress skin inflammation. J Exp Med. 2012;209(5):935–45. - PMC - PubMed
    1. Demoulin SA, Somja J, Duray A, Guenin S, Roncarati P, Delvenne PO, et al. Cervical (pre)neoplastic microenvironment promotes the emergence of tolerogenic dendritic cells via RANKL secretion. Oncoimmunology. 2015;4(6):e1008334. - PMC - PubMed
    1. Belz GT, Behrens GM, Smith CM, Miller JF, Jones C, Lejon K, et al. The CD8alpha(+) dendritic cell is responsible for inducing peripheral self-tolerance to tissue-associated antigens. J Exp Med. 2002;196(8):1099–104. - PMC - PubMed
    1. Seillet C, Belz GT. Terminal differentiation of dendritic cells. Adv Immunol. 2013;120:185–210. - PubMed

Publication types