. 2016 Nov 29:7:13685.
doi: 10.1038/ncomms13685.

EZH1 and EZH2 promote skeletal growth by repressing inhibitors of chondrocyte proliferation and hypertrophy

Affiliations

EZH1 and EZH2 promote skeletal growth by repressing inhibitors of chondrocyte proliferation and hypertrophy

Julian C Lui et al. Nat Commun. .

Abstract

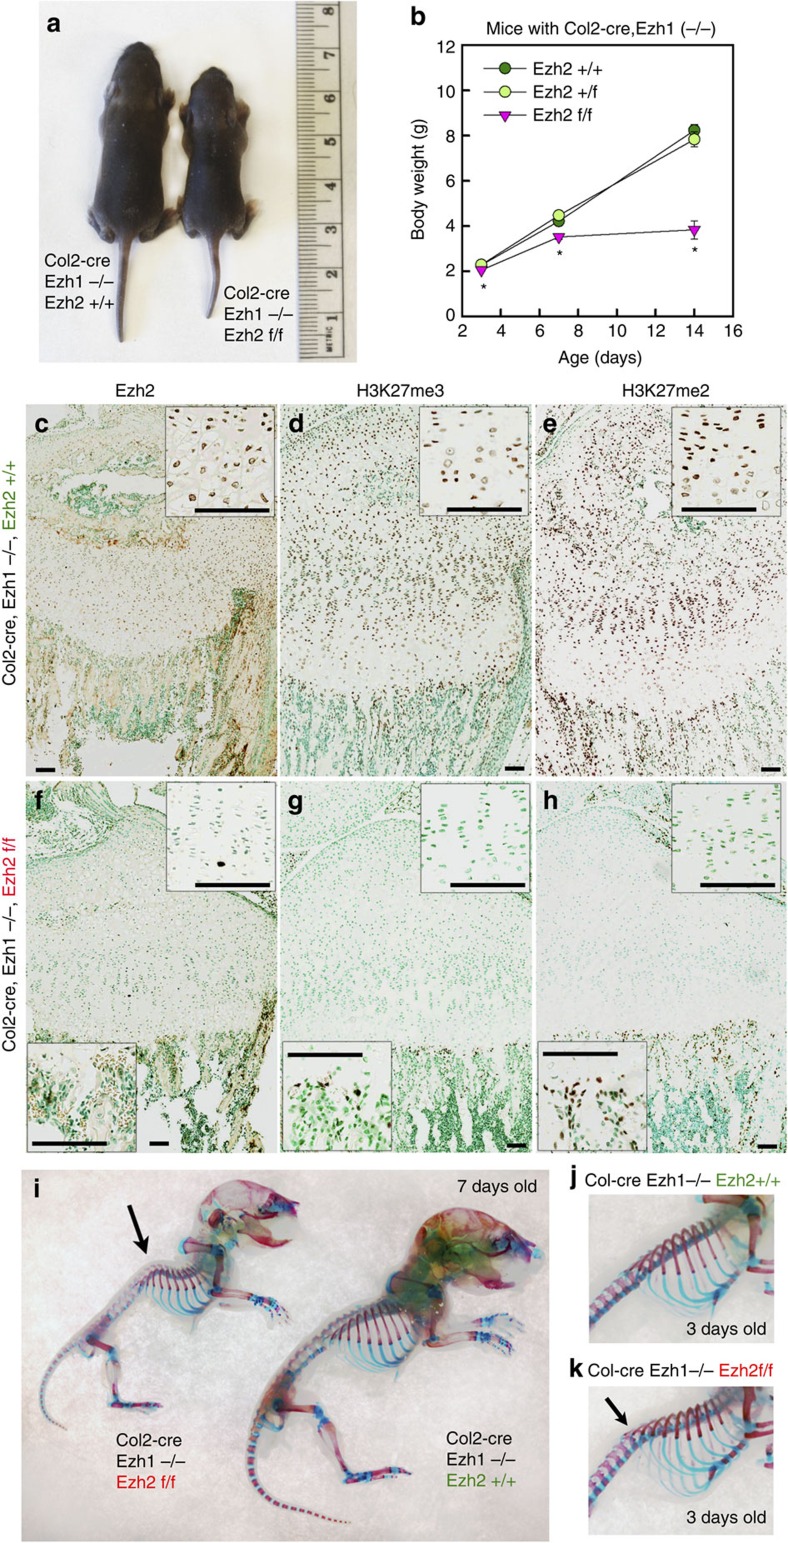
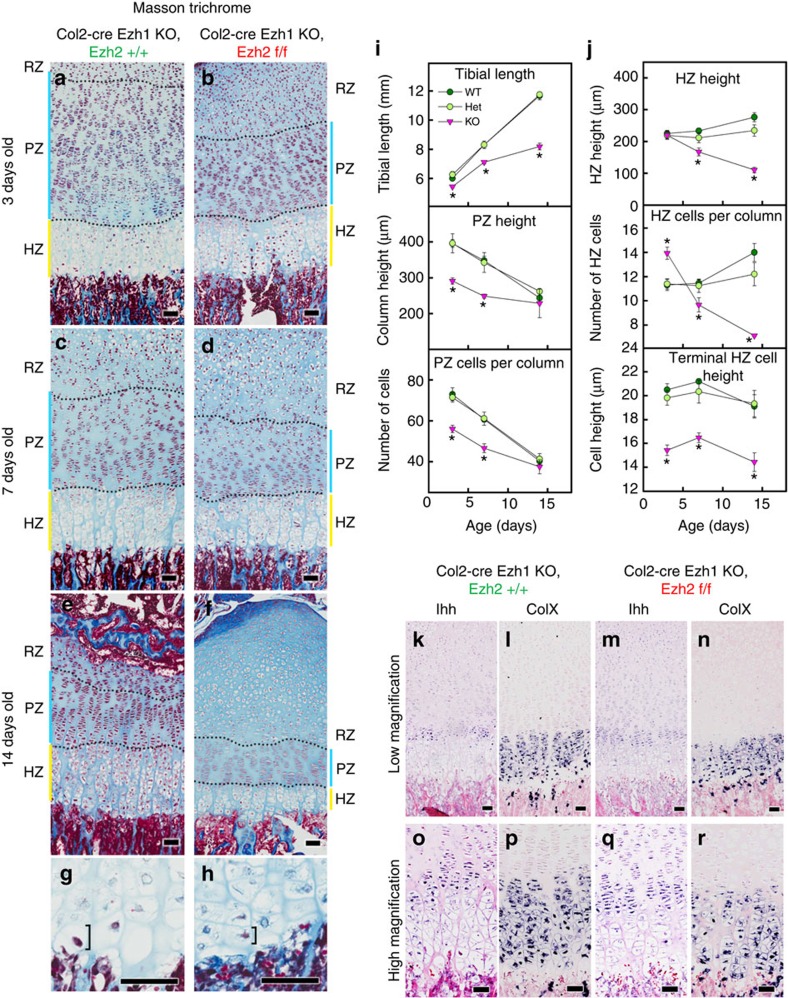
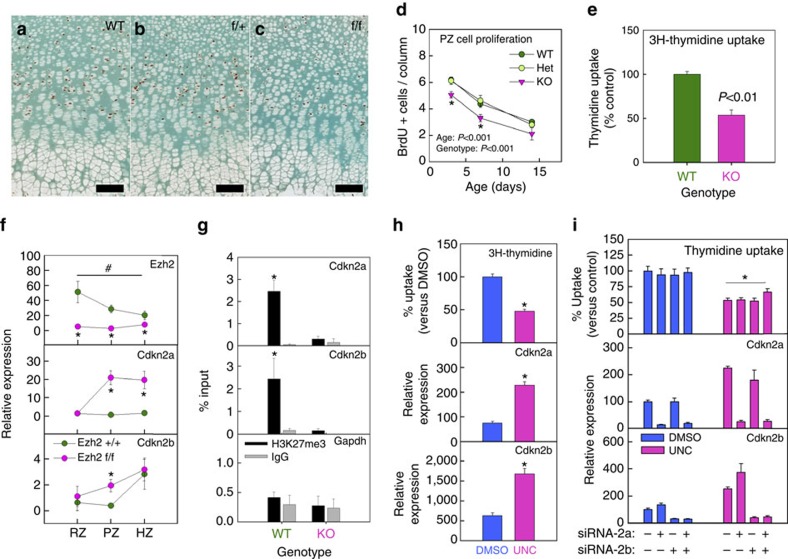
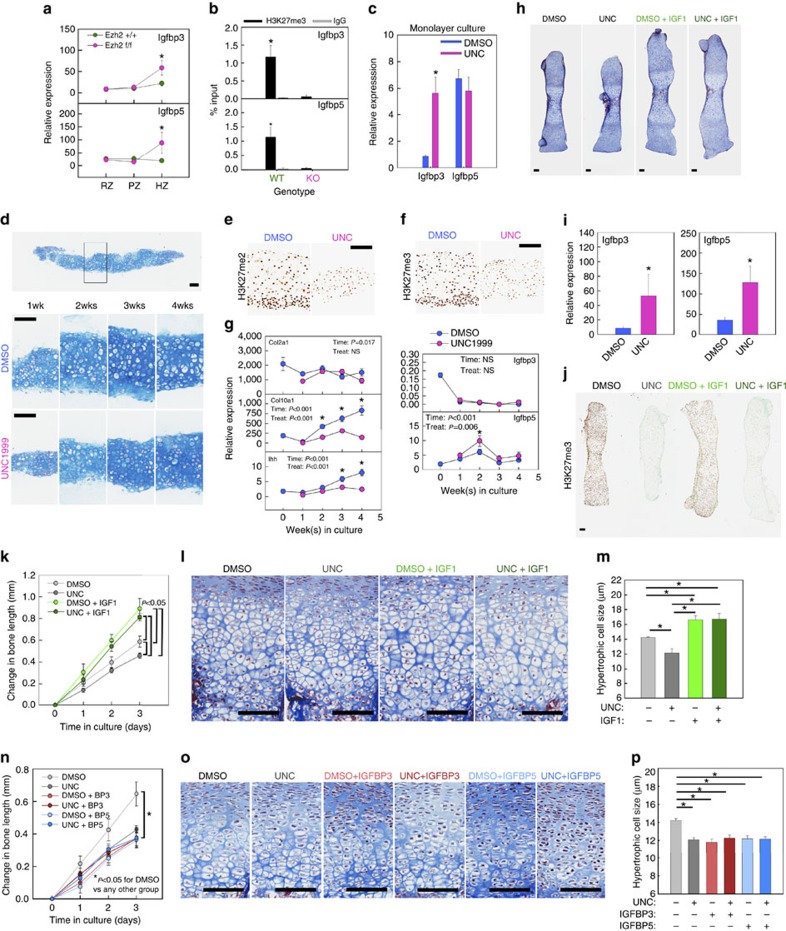
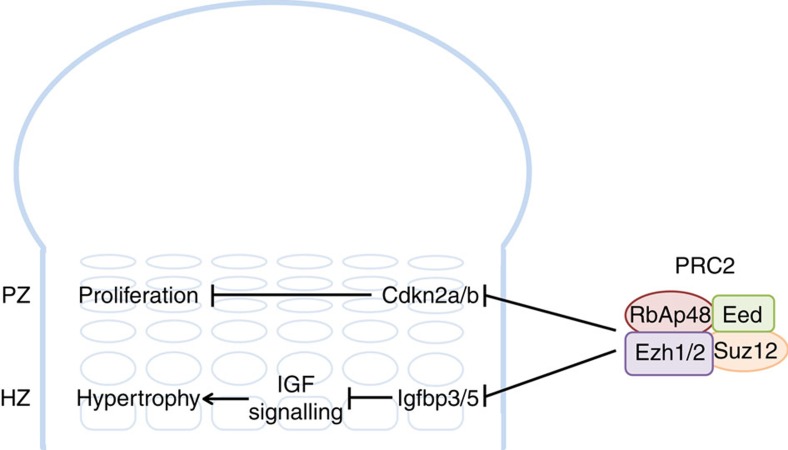
Histone methyltransferases EZH1 and EZH2 catalyse the trimethylation of histone H3 at lysine 27 (H3K27), which serves as an epigenetic signal for chromatin condensation and transcriptional repression. Genome-wide associated studies have implicated EZH2 in the control of height and mutations in EZH2 cause Weaver syndrome, which includes skeletal overgrowth. Here we show that the combined loss of Ezh1 and Ezh2 in chondrocytes severely impairs skeletal growth in mice. Both of the principal processes underlying growth plate chondrogenesis, chondrocyte proliferation and hypertrophy, are compromised. The decrease in chondrocyte proliferation is due in part to derepression of cyclin-dependent kinase inhibitors Ink4a/b, while ineffective chondrocyte hypertrophy is due to the suppression of IGF signalling by the increased expression of IGF-binding proteins. Collectively, our findings reveal a critical role for H3K27 methylation in the regulation of chondrocyte proliferation and hypertrophy in the growth plate, which are the central determinants of skeletal growth.


Conflict of interest statement

The authors declare no competing financial interests.

Figures

Figure 1
Figure 1. Ezh1/2 mice show growth retardation.
(a) One-week-old littermates of Ezh2 wild-type (Col2-cre, Ezh1−/−, Ezh2+/+) and Ezh1/2 knockout (Col2-cre, Ezh1−/−, Ezh2f/f) mice. (b) Growth curve of Ezh2 wild-type, cartilage-specific heterozygotes and cartilage-specific knockout mice, all with Ezh1−/− background. *P<0.05 versus both wild type and heterozygotes within the same age group. (ch) Proximal tibial growth plates of Ezh1−/− 1-week-old mice with cartilage-specific knockout for Ezh2 (d,f,h) or wild type for Ezh2 (c,e,g) immunostained (brown colour) for Ezh2 (c,d), H3K27me3 (e,f) and H3K27me2 (g,h). Higher-magnification images of growth plate chondrocytes and spongiosa osteoblasts (for Ezh2f/f) were included to better illustrate the presence or absence of signal. (ik) Whole-mount staining of Ezh1−/− mice with cartilage-specific knockout for Ezh2 or wild type for Ezh2 7 days (i) and 3 days (j,k) of age, stained for bone (Alizarin red) and cartilage (Alcian blue). Arrow indicates abnormal spinal curvature. Error bars, ±s.e.m. Scale bars, 100 μm.
Figure 2
Figure 2. Quantitative histology of proximal tibial growth plate.
(af) Histological sections of proximal tibias of Ezh1−/− mice with cartilage-specific knockout for Ezh2 (b,d,f) or wild type for Ezh2 (a,c,e) at 3 days (a,b), 1 week (c,d) and 2 weeks (e,f) of age. HZ, hypertrophic zone (yellow bars); PZ, proliferative zone (blue bars); RZ, resting zone. (g,h) Higher magnification of hypertrophic chondrocytes of Ezh1−/− mice that are wild type (g) or with cartilage-specific knockout for Ezh2 (h) at 3 days old to illustrate the difference in terminal hypertrophic cell height (bracket). (i,j) Quantitative histological measurements of tibial length, PZ height and number of cells per proliferative column (i), and HZ height, number of cells per hypertrophic column and terminal hypertrophic cell height (j) in Ezh1−/− mice that are wild type (WT, N=6), heterozygous (Het, N=6) or with cartilage-specific knockout (KO, N=8) for Ezh2. *P<0.05 versus both WT and Het within the same age group. (kr) In situ hybridization of Ihh (k,m,o,q) and ColX (l,n,p,r) of proximal tibias of Ezh1−/− mice with cartilage-specific knockout for Ezh2 (m,n,q,r) or wild type for Ezh2 (k,l,o,p) at 1 week of age. Error bars, ±s.e.m. Scale bars, 50 μm.
Figure 3
Figure 3. Cdkn2a/b upregulation contributed to defects in chondrocyte proliferation.
(ac) BrdU staining of 1-week-old proximal tibial growth plate from Ezh1−/− mice that are wild type (WT) (a), heterozygous (b) or homozygous (c) for cartilage-specific Ezh2 knockout. (d) Number of BrdU-positive cells per proliferative column in proximal tibial growth plates of 3-day-, 1-week- and 2-week-old Ezh1−/− mice that are WT (N=6), heterozygous (HET, N=6) or homozygous (KO, N=8) for cartilage-specific Ezh2 knockout. *P<0.05 versus both WT and Het within the same age group. (e) Tritiated thymidine uptake by monolayer primary chondrocytes, isolated from 1-week-old Ezh1−/− mice that are WT (N=6) or homozygous (KO, N=8) for cartilage-specific Ezh2 knockout (E). (f) Relative expression of Ezh2, Cdkn2a and Cdkn2b in different zones (RZ, PZ and HZ) isolated from proximal tibial growth plates of 3-day-old Ezh1−/− that are WT (Ezh2+/+) or homozygous (Ezh2 fl/fl) for cartilage-specific Ezh2 knockout. Tissue was isolated by LCM and messenger RNA measured by quantitative real-time PCR; #P<0.05 across zones in Ezh2 WT; *P<0.05 between Ezh2 WT and Ezh1/2 knockout within the same zone. (g) Chromatin immunoprecipitation (ChIP) with H3K27me3 antibody (or IgG), followed by real-time PCR to compare levels of histone modification near transcription start site of Cdkn2a, Cdkn2b and Gapdh, between chondrocytes isolated from 1-week-old Ezh1−/− mice that are WT or homozygous (KO) for cartilage-specific Ezh2 knockout. *P<0.05, WT H3K27me3 versus KO H3K27me3. (h) Tritiated thymidine uptake and Cdkn2a and Cdkn2b expression (by real-time PCR), in monolayer primary chondrocytes isolated from 1-week-old WT mice, treated with Ezh1/2 inhibitors (UNC) or DMSO; *P<0.05, N=6. (i) Similar experiment as in h, except that chondrocytes were treated with siRNA against Cdkn2a and/or Cdkn2b (or scrambled siRNA) before Ezh1/2 inhibition; *P<0.05, N=6. Error bars, ±s.e.m. Scale bars, 100 μm.
Figure 4
Figure 4. Igfbp3/5 upregulation contributed to defects in chondrocyte hypertrophy.
(a) Relative expression of Igfbp3 and 5 in different zones (RZ, PZ and HZ) isolated from proximal tibial growth plates of 3-day-old Ezh1/2 or wild-type mice. Tissue was isolated by laser capture microdissection, and messenger RNA levels were measured by real-time PCR; *P<0.05 between Ezh1/2 or wild-type mice within the same zone (N=6). (b) ChIP with H3K27me3 antibody (or IgG), followed by real-time PCR to compare levels of H3K27me3 near transcription start site of Igfbp3 and Igfbp5, in chondrocytes isolated from 1-week-old Ezh1/2 or wild-type mice. *P<0.05 between Ezh1/2 or wild-type mice for H3K27me3 (N=6). (c) Relative expression of Igfbp3 and Igfbp5 in monolayer primary chondrocytes isolated from 1-week-old wild-type mice treated with an Ezh1/2 inhibitor (UNC) or vehicle (DMSO). *P<0.05 (N=6). (d) Top panel: Alcian blue-stained histological section of a chondrocyte pellet cultured for 1 week. Middle and bottom panels: higher magnification of DMSO-treated pellets (middle panel) or UNC-treated pellets (bottom panel) at different time points. (e,f) Histological sections of pellet treated with DMSO or UNC for 1 week, immunostained (brown colour) for H3K27me2 (e) or H3K27me3 (f). (g) Relative expression of Col2a1, Col10a1, Ihh, Igfbp3 and Igfbp5 in chondrocyte pellets treated with DMSO or UNC at different time points. P values, two-way analysis of variance for the effect of time in culture and UNC treatment. *P<0.05 between DMSO and UNC treated at a particular time point (N=6). (h) Histological sections of cultured fetal mouse metatarsal bones treated with DMSO or UNC, with or without IGF-I. (i) Relative expression of Igfbp3 and Igfbp5 in metatarsal whole growth plate from h. *P<0.05. (j) Immunohistochemistry (brown colour) for H3K27me3 of metatarsal bones from h. (km) Change in length (k) histological sections (l), and quantitative measurements of hypertrophic cell size (m) in fetal metatarsal bones treated with DMSO or UNC, with or without Igf1. Statistical comparison was performed on bone length between different treatment groups at the end of treatment (m). (np) Similar to km, except for the treatment with Igfbp3/5 instead of IGF-I. *P<0.05, N=6 (m,p). *P<0.05, DMSO versus all other groups (n). Scale bars, 100 μm.
Figure 5
Figure 5. Microarray of gene expression in growth plates of Ezh1/2 mice.
Expression microarray was performed in RNA isolated from tibial growth plate proliferative or hypertrophic zone of 3-day-old Ezh1/2 or wild-type mice using laser capture microdissection. In both zones, using a cutoff of P<0.001 and fold change>1.3, more genes were upregulated than downregulated in Ezh1/2 mice compared with wild type (a). Overlap of genes commonly upregulated (or commonly downregulated) between two zones in the Ezh1/2 mice were modest (b). Unsupervised two-way hierarchical clustering of the 12 samples from Ezh1/2 mice and wild-type mice (six samples each), using the 280 significant genes in the PZ (top panel) and 243 significant genes in the HZ (bottom panel). Relative expression was depicted by colour maps, with blue representing low expression, and red representing high expression. Scale bar, normalized log2-transformed expression (c). Canonical signalling pathway analysis by Ingenuity Pathway Analysis on the 280 PZ genes (top panel) and 243 HZ genes (bottom panel) (d). A subset of messenger RNAs that were found to be differentially expressed in Ezh1/2 versus wild-type mice were analysed by real-time PCR for confirmation (e). Error bars, ±s.e.m.
Figure 6
Figure 6. PRC2 promotes chondrocyte proliferation and hypertrophy.
Our findings support this working model to explain how PRC2 promotes proliferation and hypertrophy in the growth plate. In the proliferative zone (PZ), PRC2 suppresses expression of Cdk inhibitors Cdkn2a and 2b, to allow normal cell cycle progression and proliferation. In the hypertrophic zone (HZ), PRC2 positively modulates IGF signalling by suppressing the expression of Igfbp3 and 5, therefore promoting chondrocyte hypertrophy.

Similar articles

Cited by

References

    1. Douglas J. et al.. NSD1 mutations are the major cause of Sotos syndrome and occur in some cases of Weaver syndrome but are rare in other overgrowth phenotypes. Am. J. Hum. Genet. 72, 132–143 (2003). - PMC - PubMed
    1. Kurotaki N. et al.. Haploinsufficiency of NSD1 causes Sotos syndrome. Nat. Genet. 30, 365–366 (2002). - PubMed
    1. Luscan A. et al.. Mutations in SETD2 cause a novel overgrowth condition. J. Med. Genet. 51, 512–517 (2014). - PubMed
    1. Tatton-Brown K. et al.. Mutations in the DNA methyltransferase gene DNMT3A cause an overgrowth syndrome with intellectual disability. Nat. Genet. 46, 385–388 (2014). - PMC - PubMed
    1. Cao R. et al.. Role of histone H3 lysine 27 methylation in Polycomb-group silencing. Science 298, 1039–1043 (2002). - PubMed

Publication types

MeSH terms

Substances