. 2016 Nov 29:7:13615.
doi: 10.1038/ncomms13615.

Functional exploration of colorectal cancer genomes using Drosophila

Affiliations

Functional exploration of colorectal cancer genomes using Drosophila

Erdem Bangi et al. Nat Commun. .

Abstract

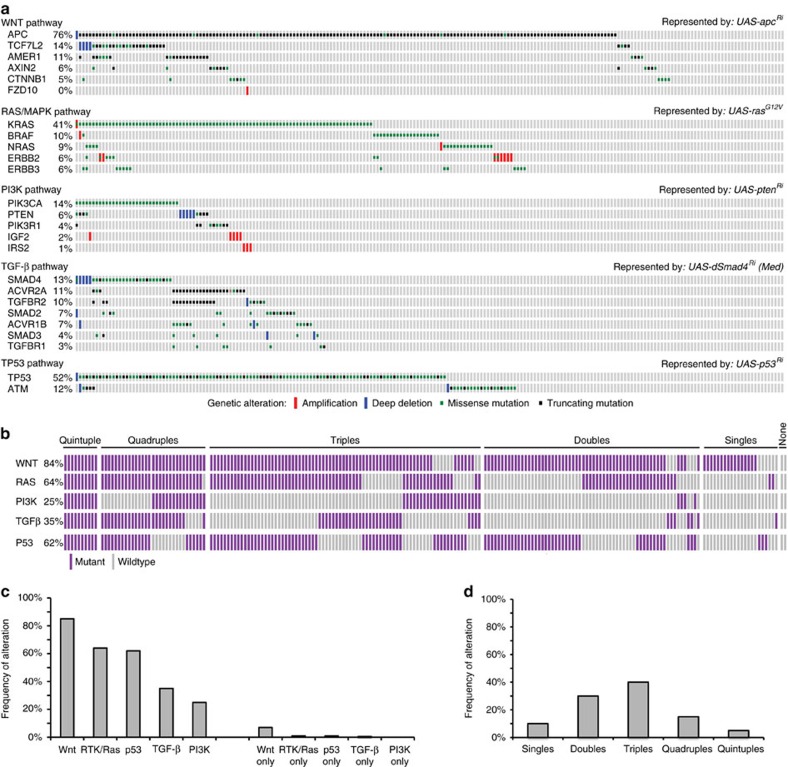
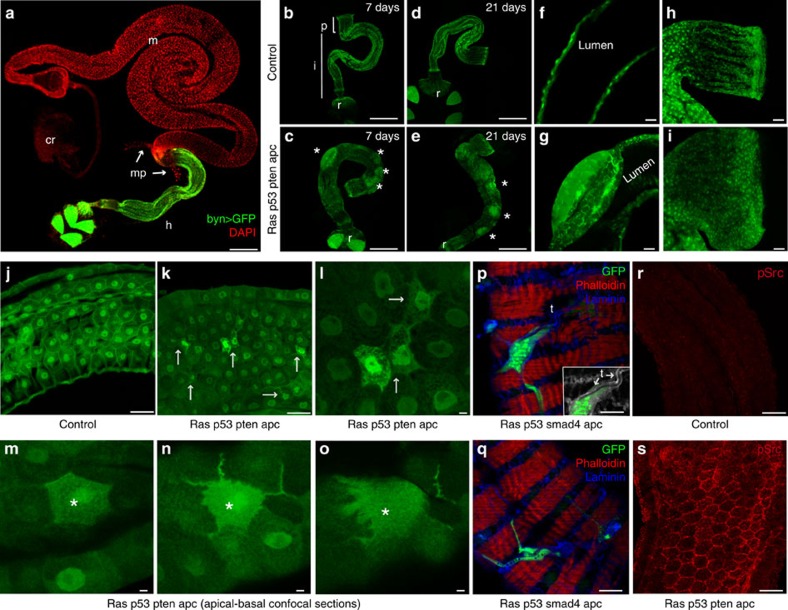
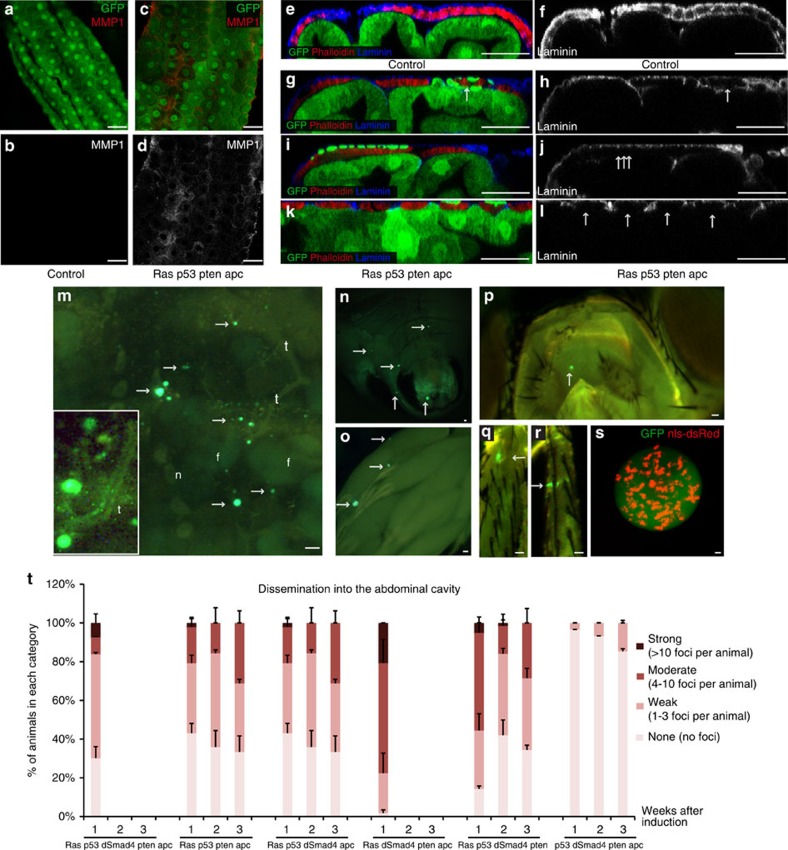
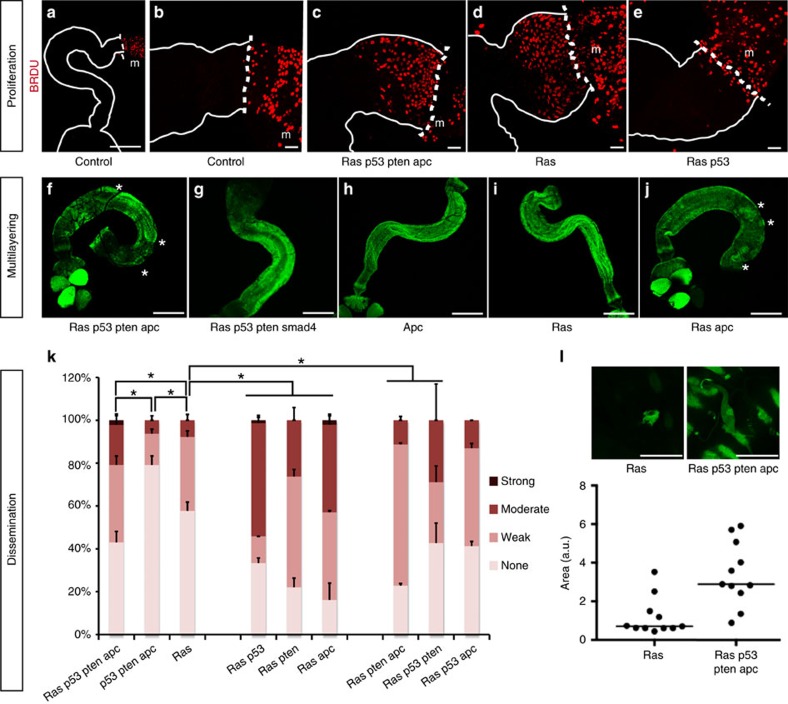
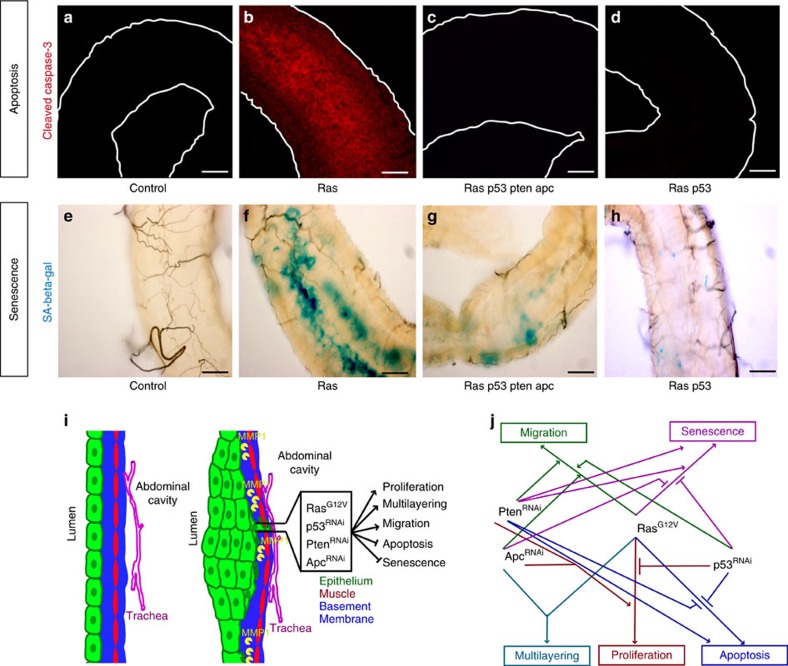
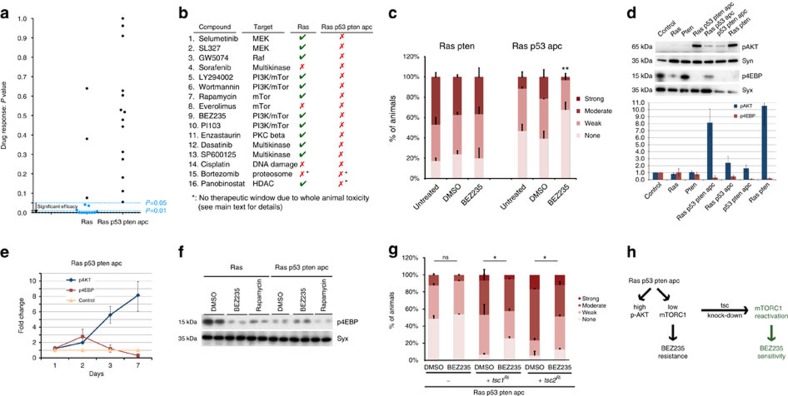
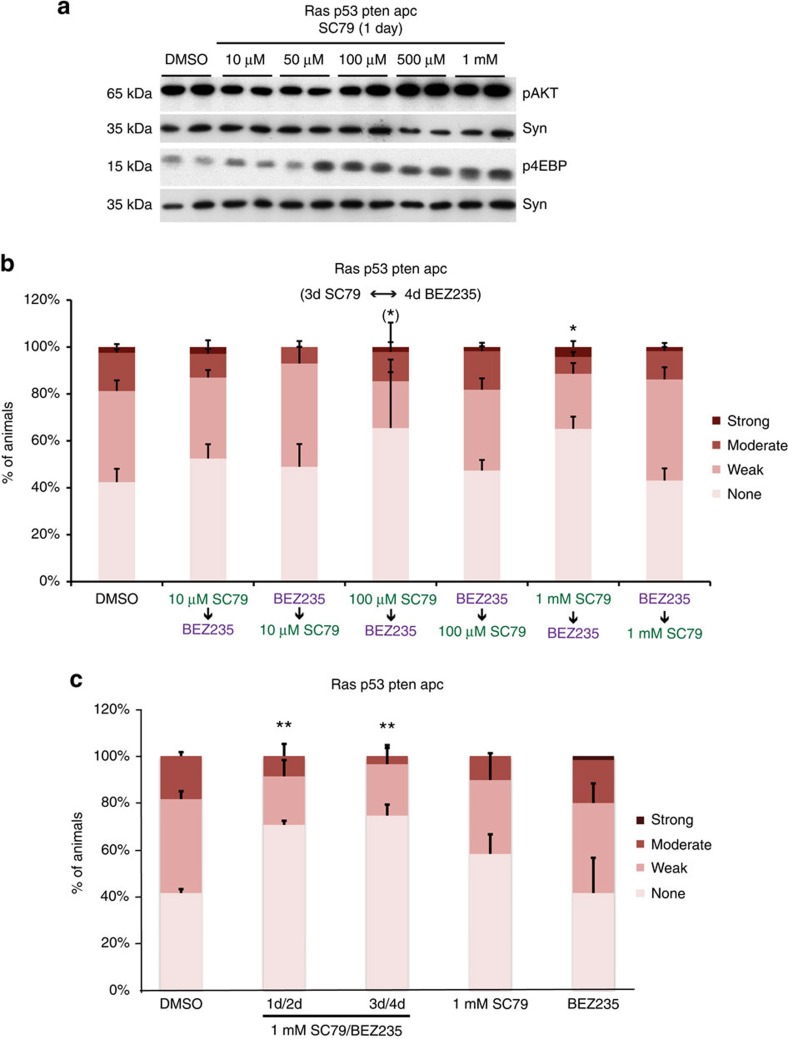
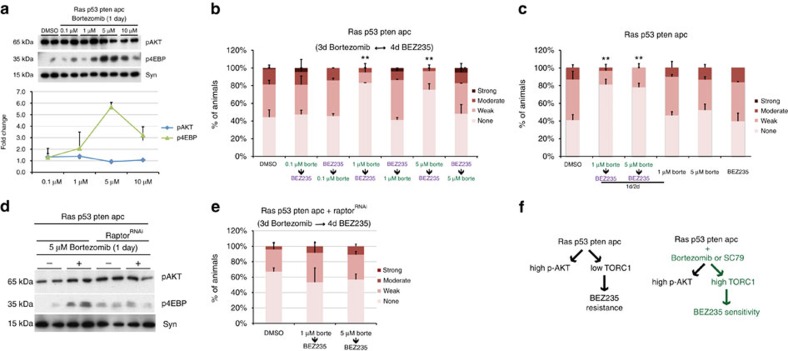
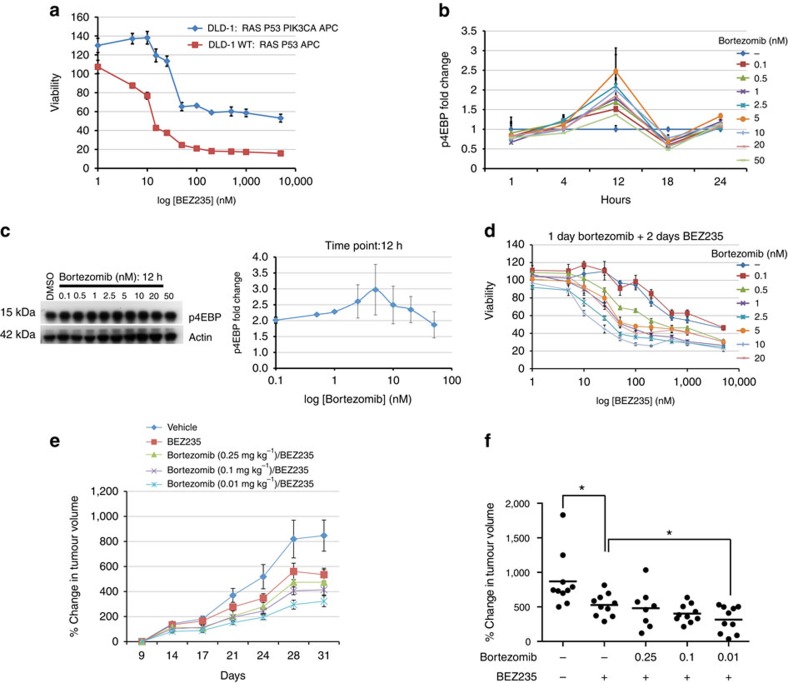
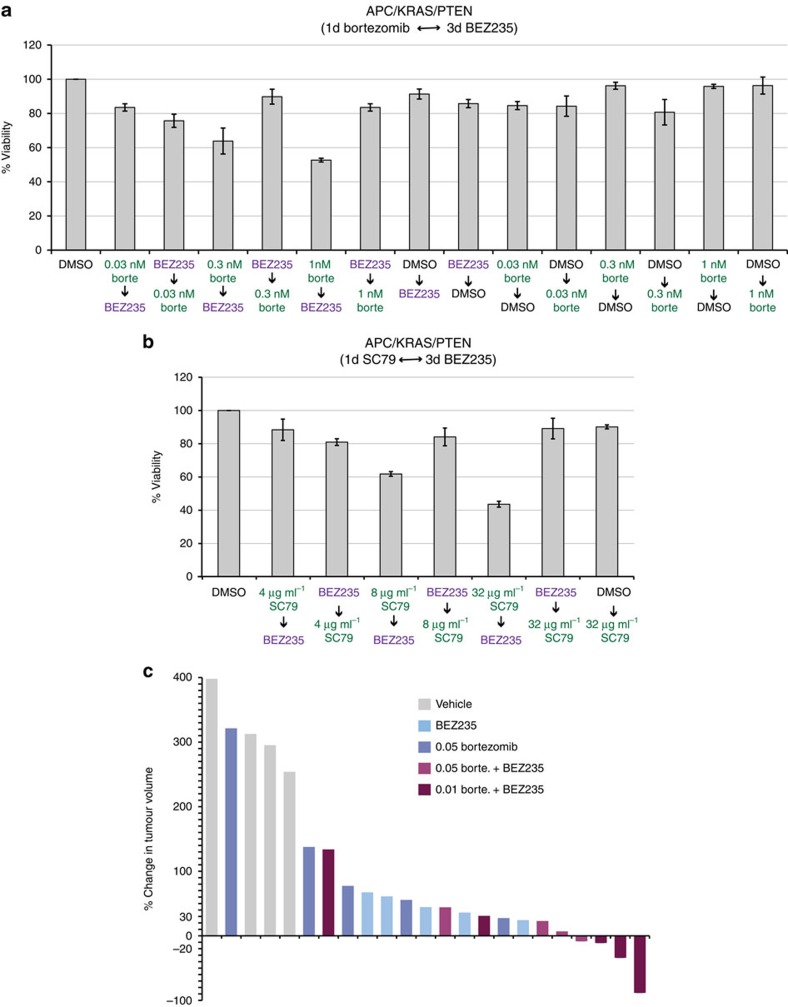
The multigenic nature of human tumours presents a fundamental challenge for cancer drug discovery. Here we use Drosophila to generate 32 multigenic models of colon cancer using patient data from The Cancer Genome Atlas. These models recapitulate key features of human cancer, often as emergent properties of multigenic combinations. Multigenic models such as ras p53 pten apc exhibit emergent resistance to a panel of cancer-relevant drugs. Exploring one drug in detail, we identify a mechanism of resistance for the PI3K pathway inhibitor BEZ235. We use this data to identify a combinatorial therapy that circumvents this resistance through a two-step process of emergent pathway dependence and sensitivity we term 'induced dependence'. This approach is effective in cultured human tumour cells, xenografts and mouse models of colorectal cancer. These data demonstrate how multigenic animal models that reference cancer genomes can provide an effective approach for developing novel targeted therapies.


Figures

Figure 1
Figure 1. Multigenic Drosophila cancer models based on TCGA colorectal cancer genomes.
(a) Population frequencies and distribution of recurrently mutated genes within the TCGA colorectal tumour data set. Each rectangular bar indicates a patient in the population. Drosophila transgenic lines selected to model alteration of each pathway are indicated. (b) Mutation profiles of individual tumours with respect to the five deregulated pathways. Purple bars indicate patients carrying an alteration in a recurrently mutated gene within a pathway; grey bars indicate tumours with no alterations in that pathway. (c) Frequency of alteration of the five pathways in the patient population (left: overall frequency; right: frequency in the absence of additional alterations). (d) Frequency of patients that show alterations in one, two, three, four and five pathways.
Figure 2
Figure 2. Targeting quadruple combinations to the adult hindgut.
(a) The adult Drosophila digestive track. Hindgut cells are visualized with byn>GFP; nuclei are in red. (bi) Control (byn>GFP,dcr2) and rasG12V p53Ri ptenRi apcRi hindguts 7 and 21 days after induction. Asterisks in c and e indicate regions of multilayering. Longitudinal optical sections (f,g) and pylorus regions (h,i) are shown. (jo) Control (j) and rasG12V p53RiptenRi apcRi (ko) ilea; arrows indicate migrating cells. (l) Close-up view view of k. (mo) Apical-to-basal confocal sections of a migrating cell (asterisk). (p,q) Surface views of rasG12V p53Ri smad4Ri apcRi hindguts with cells migrating on top of the muscle layer. (p) Inset: laminin (grey) and GFP channels only to highlight trachea (arrows). (r,s) Phospho-Src staining of control and rasG12V p53Ri ptenRi apcRi hindguts.cr, crop; h, hindgut; i, ileum; m, midgut; mp, malphigian tubules; p, pylorus; r, rectum; t, trachea. Scale bars, 250 mm (ae) and 25 mm (fs).
Figure 3
Figure 3. Dissemination phenotypes induced by four- and five-hit models.
(ad) Mmp1 staining of control and rasG12V p53Ri ptenRi apcRi hindguts. (b,d) Mmp1 channel only. (el) Cross-section views of control and rasG12V p53Ri ptenRi apcRi hindguts. (f,h,j,l) Laminin channel only; arrows indicate reduced/absent laminin staining. (ms) Examples of dissemination phenotype. Arrows indicate GFP-positive foci inside the abdominal cavity (m), underneath the abdomen epidermis (n), ovaries (o), head (p) and legs (q,r) (f, fat body, n, nephrocyte; t, trachea). (m) Inset: close-up view showing close association of GFP foci with tracheal branches. (s) Live confocal image of a multicellular GFP cluster inside the abdominal cavity. Nuclei are visualized by a nuclear dsRed transgene (nls-dsRed). (t) Quantification of dissemination into the abdominal cavity. Each animal is dissected and assigned into one of the following categories based on the number of disseminated foci inside the abdominal cavity: none, no dissemination; weak, 1–3 GFP-positive foci inside the abdominal cavity; moderate, 4–10 GFP-positive foci; strong, >10 GFP-positive foci (n=2 replicates, 20–30 flies per replicate; error bars: s.e.m.). Scale bars, 25 mm.
Figure 4
Figure 4. Follow-up analysis of proliferation, multilayering and dissemination phenotypes.
(ae) Seven-day continuous BrDU labelling (red) of hindguts with indicated genotypes. Whole hindgut (a) or pylorus regions (be) are outlined with solid lines; dashed lines indicate hindgut/midgut boundary (m, midgut). (fj) Whole hindguts of indicated genotypes; asterisks indicate regions of multilayering. (k) Quantification of dissemination one week after induction (n=2 replicates, 25–30 flies per replicate; error bars: s.e.m.; *P<0.01, Fisher's exact test). (l) Top views of rasG12V and rasG12V p53Ri ptenRi apcRi hindguts with migrating cells on top and quantificaton of the migrating cell surface area. Scale bars, 250 mm (a,fj), 25 mm (be,l).
Figure 5
Figure 5. Apoptosis and senescence phenotypes in multigenic models.
Cleaved caspase-3 (ad) and senescence associated (SA) β-gal (eh) staining of hindguts with indicated genotypes. Hindguts outlined by solid lines in ad. (i) Features of cancer recapitulated by our multigenic models. (j) Summary of interactions between individual transgenes for each phenotype. Scale bars, 25 mm.
Figure 6
Figure 6. Drug resistance as an emergent feature of increased genetic complexity.
(a,b) Plot of P-values indicating significance of compound rescue (a) and summary of compound response (b) of rasG12V and rasG12V p53Ri ptenRi apcRi animals. P-values (a) were obtained by comparing the dissemination phenotype after compound feeding to dimethyl sulfoxide (DMSO) fed flies (dissemination plots can be found in Supplementary Fig. 3a,b). Blue dots represent statistically significant results. (c) Quantification of dissemination in rasG12V ptenRi and rasG12V p53Ri apcRi animals treated with BEZ235. (d) Western blot analysis of PI3K pathway output from hindguts with indicated genotypes 7 days after induction of transgenes and quantification. Syn, Syntaxin (loading control). (e) Time-course analysis of PI3K pathway activation status in control and rasG12V p53Ri ptenRi apcRi hindguts. (f) Western blot analysis of the biochemical response by rasG12V and rasG12V p53Ri ptenRi apcRi animals to PI3K pathway inhibitors. (g) Quantification of dissemination in indicated genotypes treated with BEZ235 or DMSO. (h) Schematic illustration of the mechanism of resistance to BEZ235: genetically activating mTORC1 promotes BEZ235 sensitivity. (d,e) Each data point represents the average response of two to five biological replicates with ten hindguts per replicate; error bars: s.e.m. (ac,g) n=2 replicates, 30 flies per replicate; error bars: s.e.m. *P<0.01 and **P<0.05 (Fisher's exact test). Compound doses reflect concentrations in the food. Uncropped gels with molecular markers for d and f can be found in Supplementary Fig. 8a–c.
Figure 7
Figure 7. AKT activator SC79 promotes sensitivity to PI3K pathway inhibition.
(a) Western blot analysis of PI3K signalling pathway output in rasG12V and rasG12V p53Ri ptenRi apcRi hindguts after 1 day feeding of SC79 at indicated doses. Syn, Syntaxin (loading control);ten hindguts per replicate. (b) Quantification of dissemination in rasG12V and rasG12V p53Ri ptenRi apcRi animals after sequential treatment with BEZ235 and indicated doses of SC79. (c) Quantification of dissemination in rasG12V and rasG12V p53Ri ptenRi apcRi animals after two different treatment schedules of SC79/BEZ235 and each drug alone. (b,c) n=2 replicates, 30 flies per replicate; error bars: s.e.m. *P<0.01 and **P<0.05 (Fisher's exact test). (b) *Variable response; not all replicates show significant rescue. Drug doses reflect concentrations in the food. Uncropped gels used to generate panel a can be found in Supplementary Fig. 8d.
Figure 8
Figure 8. Bortezomib promotes sensitivity to PI3K pathway inhibition.
(a) Western blot analysis of PI3K pathway activity in rasG12V p53Ri ptenRi apcRi hindguts after 1 day feeding of bortezomib at indicated doses. Each data point represents the average response of two to five biological replicates with ten hindguts per replicate. Error bars: s.e.m. (b) Quantification of dissemination in rasG12V p53Ri ptenRi apcRi animals after sequential treatment with BEZ235 and indicated doses of bortezomib. (c) Quantification of dissemination in rasG12V p53Ri ptenRi apcRi animals after a 1-day/2-day alternating treatment schedule of bortezomib/BEZ235 and each drug alone. (d) Western blot analysis of PI3K pathway activity in rasG12V p53Ri ptenRi apcRi hindguts with and without raptor knockdown treated with 5 μm bortezomib for 1 day. (e) Quantification of dissemination in rasG12V p53Ri ptenRi apcRi raptorRi animals after sequential treatment with indicated doses of bortezomib followed by BEZ235. (f) Schematic illustration of the mechanism by which the two-step therapy overcomes resistance to BEZ235: elevating mTORC1 activity increases subsequent sensitivity to BEZ235. (b,c,e) n=2 replicates, 30 flies per replicate; error bars: s.e.m. *P<0.01 and **P<0.05 (Fisher's exact test). Drug doses reflect concentrations in the food. Uncropped gels used to generate panels a and d can be found in Supplementary Fig. 8e,f.
Figure 9
Figure 9. Validation of the two-step therapy in colorectal cancer cell lines.
(a) BEZ235 dose–response curve of DLD-1 parental (Ras and PI3K active) versus DLD-1 WT (Ras active, PI3K wild type) cell lines. (b) Time course of mTORC1 activation by bortezomib in DLD-1 cells. Each data point represents the average of two to three western blottings. (c) mTORC1 activation status in response to bortezomib 12 h after treatment. (d) BEZ235 dose –response curve of DLD-1 cells after pretreatment with dimethyl sulfoxide (DMSO; control) or indicated doses of bortezomib for 24 h. (e) Growth rates of DLD-1 xenografts treated with indicated compounds. Data points are normalized to tumour size at the beginning of drug treatment (day 9). (f) Percent change in DLD-1 xenograft tumour volumes at the last day of treatment (day 31; P<0.05, Mann–Whitney test). Error bars: s.e.m. 10 animals. Uncropped gels used to generate c can be found in Supplementary Fig. 8g.
Figure 10
Figure 10. Validation of the two-step therapy in three-dimensional colosphere cultures and allografts.
(a,b) Cell viability of sphere cultures derived from colon tumours of an APC/KRAS/PTEN mouse model of colorectal cancer treated with bortezomib (a) or SC79 (b) followed by BEZ235. (c) Waterfall plot demonstrating the percent change in tumour volumes of allografts derived from cultured APC/KRAS/PTEN colospheres at the end of treatment. (a,b) Error bars represent s.e.m.; n=3 replicates.

Similar articles

Cited by

References

    1. Stratton M. Exploring the genomes of cancer cells: progress and promise. Science 331, 1553–1558 (2011). - PubMed
    1. Vogelstein B. et al.. Cancer genome landscapes. Science 339, 1546–1558 (2013). - PMC - PubMed
    1. Biankin A. V., Piantadosi S. & Hollingsworth S. J. Patient-centric trials for therapeutic development in precision oncology. Nature 526, 361–370 (2015). - PubMed
    1. Mendelsohn J. Personalizing oncology: perspectives and prospects. J. Clin. Oncol. 31, 1904–1911 (2013). - PubMed
    1. Caponigro G. & Sellers W. R. Advances in the preclinical testing of cancer therapeutic hypotheses. Nat. Rev. Drug Discov. 10, 179–187 (2011). - PubMed

Publication types

MeSH terms