

Reducing GABAA-mediated inhibition improves forelimb motor function after focal cortical stroke in mice
- PMID: 27897203
- PMCID: PMC5126677
- DOI: 10.1038/srep37823
Reducing GABAA-mediated inhibition improves forelimb motor function after focal cortical stroke in mice
Abstract
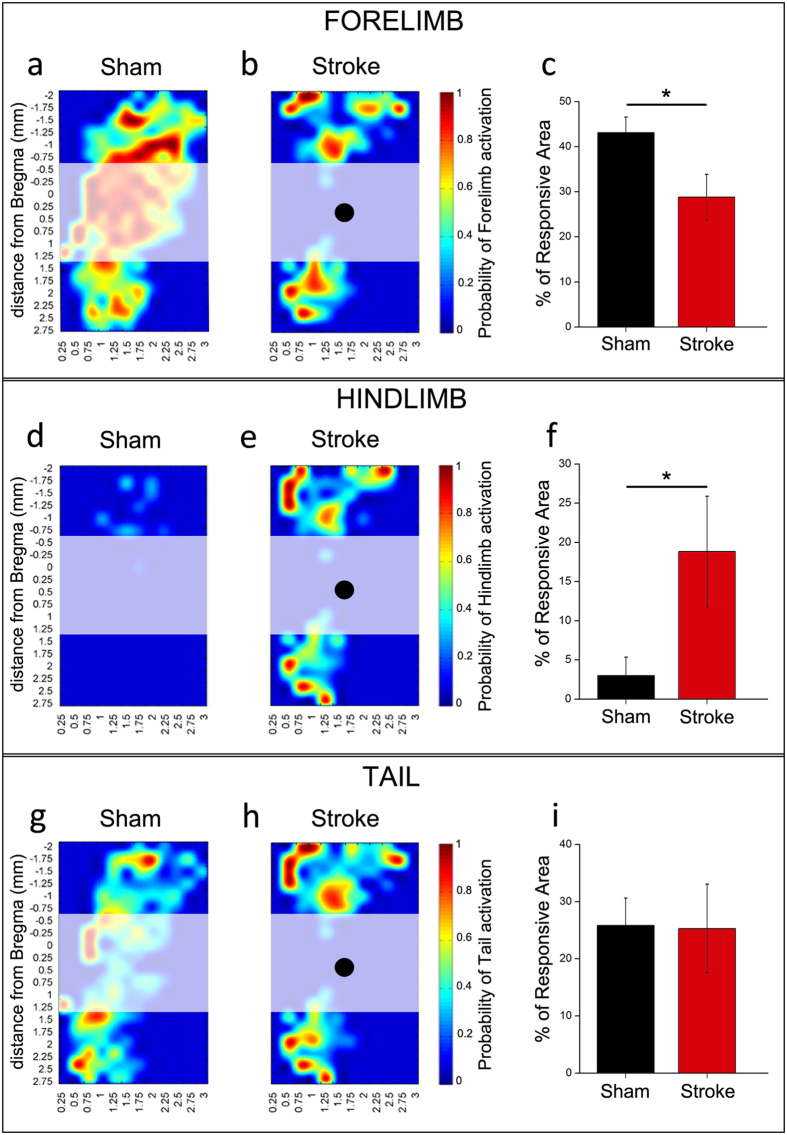
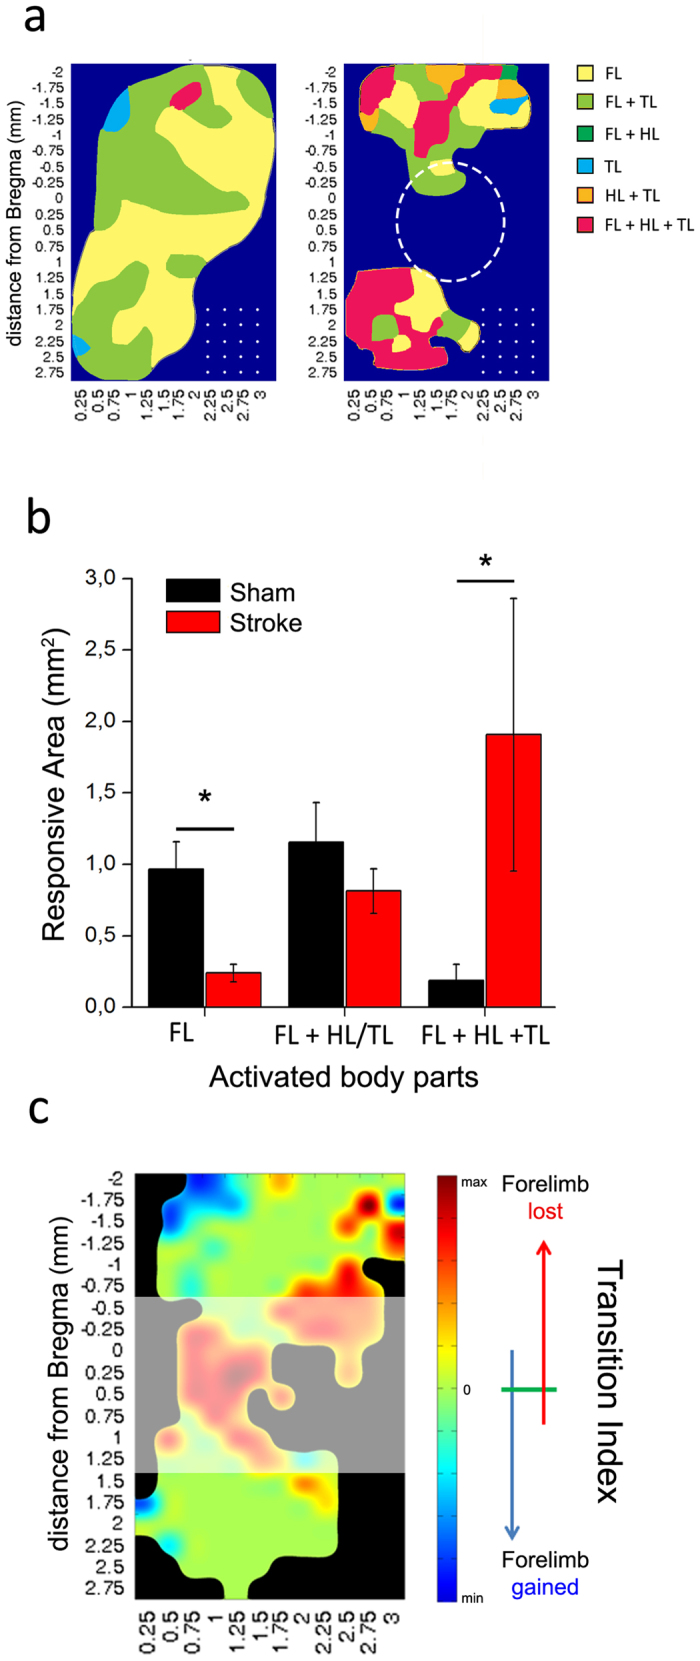
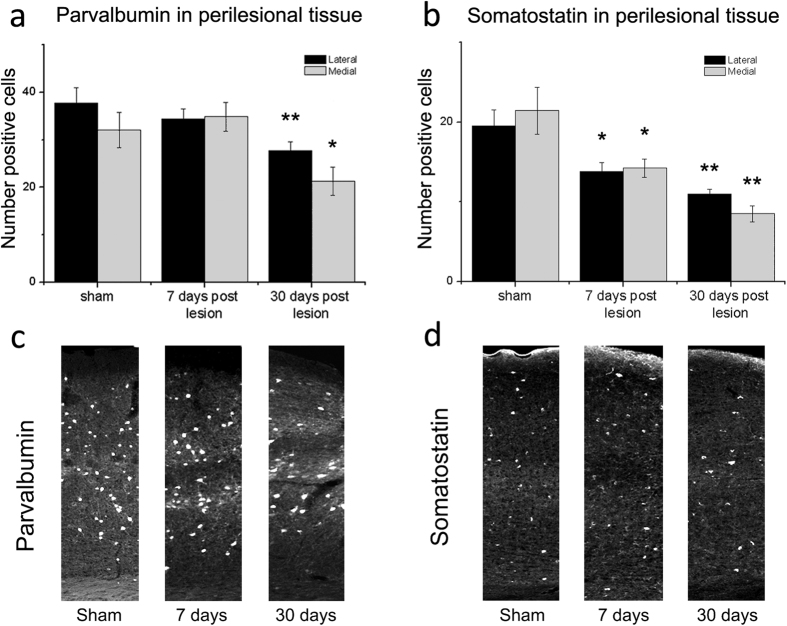
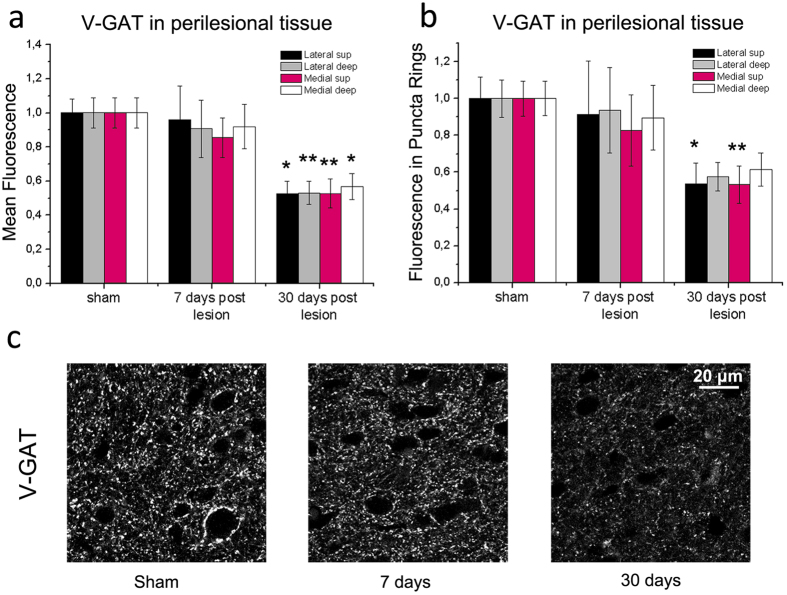
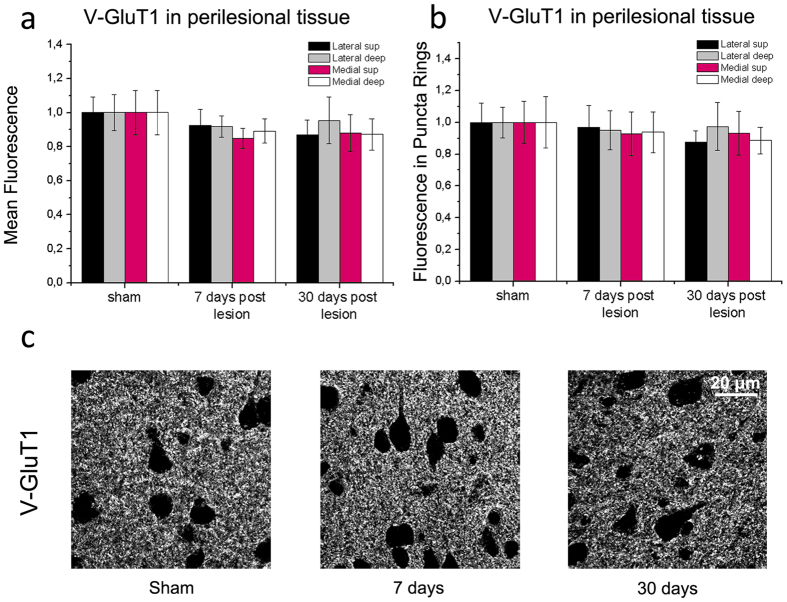
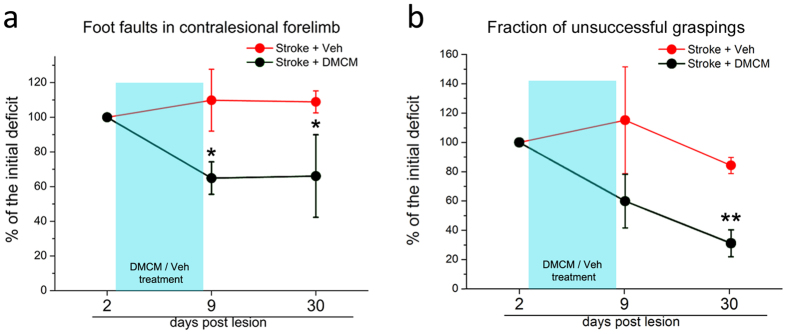
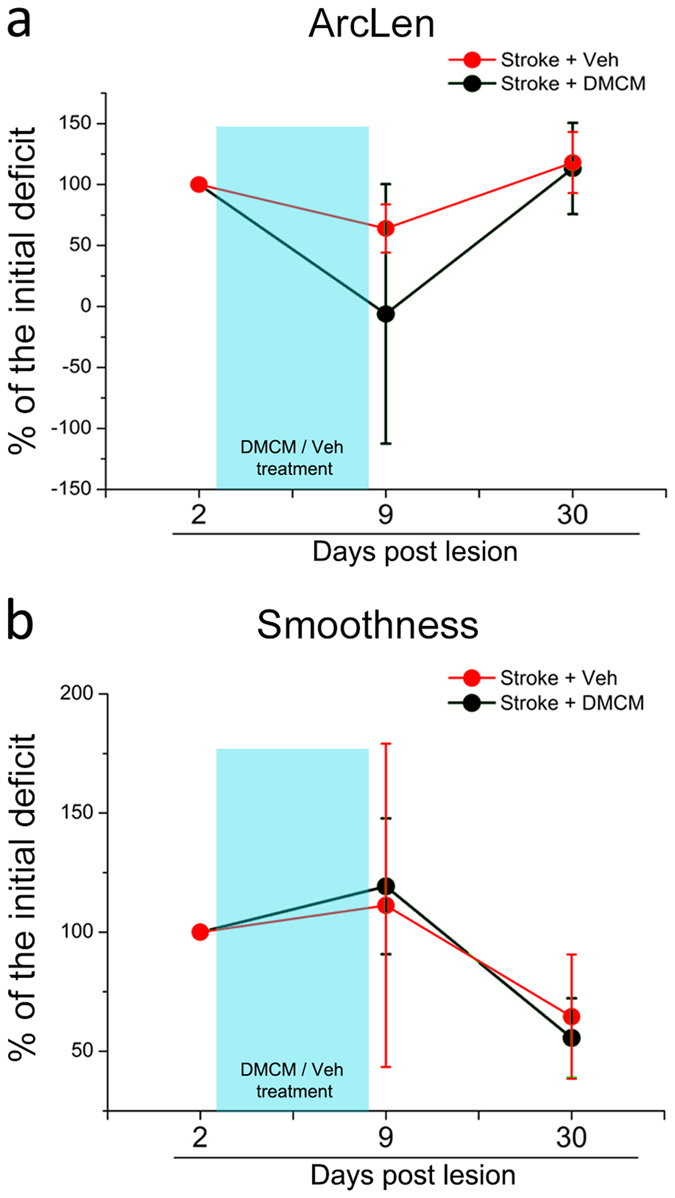
A deeper understanding of post-stroke plasticity is critical to devise more effective pharmacological and rehabilitative treatments. The GABAergic system is one of the key modulators of neuronal plasticity, and plays an important role in the control of "critical periods" during brain development. Here, we report a key role for GABAergic inhibition in functional restoration following ischemia in the adult mouse forelimb motor cortex. After stroke, the majority of cortical sites in peri-infarct areas evoked simultaneous movements of forelimb, hindlimb and tail, consistent with a loss of inhibitory signalling. Accordingly, we found a delayed decrease in several GABAergic markers that accompanied cortical reorganization. To test whether reductions in GABAergic signalling were causally involved in motor improvements, we treated animals during an early post-stroke period with a benzodiazepine inverse agonist, which impairs GABAA receptor function. We found that hampering GABAA signalling led to significant restoration of function in general motor tests (i.e., gridwalk and pellet reaching tasks), with no significant impact on the kinematics of reaching movements. Improvements were persistent as they remained detectable about three weeks after treatment. These data demonstrate a key role for GABAergic inhibition in limiting motor improvements after cortical stroke.
Figures
 (see Methods).
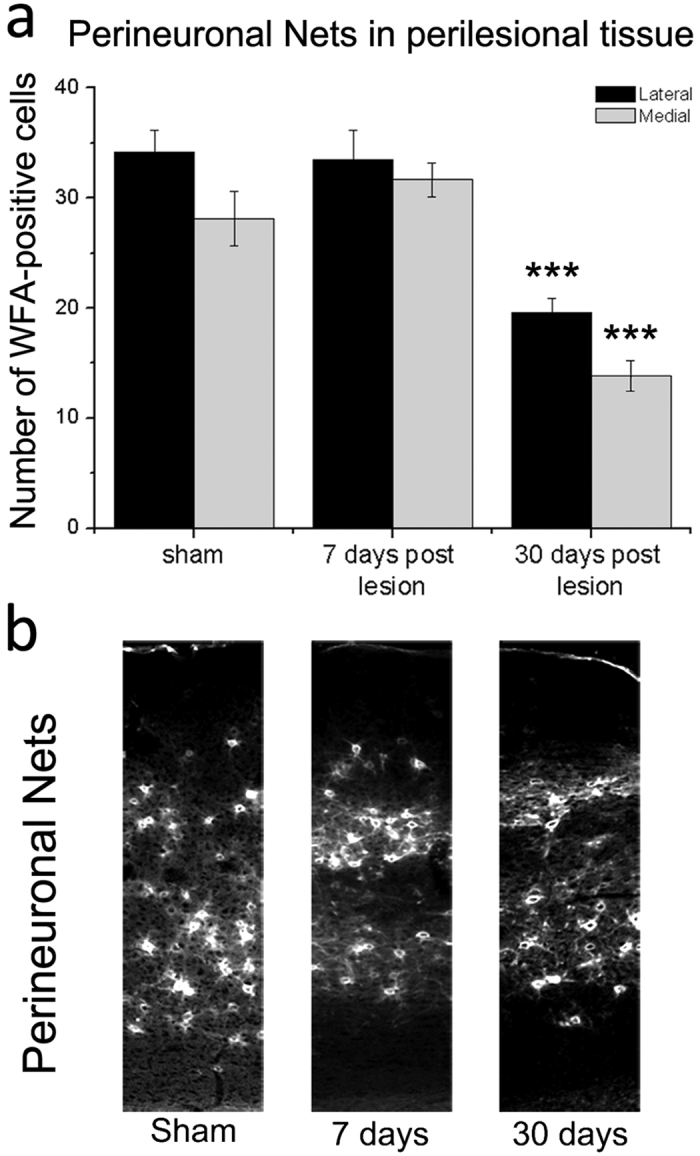
References
-
- Starkey M. L. & Schwab M. E. How Plastic Is the Brain after a Stroke? Neuroscientist 20, 359–371 (2014). - PubMed
-
- Caleo M. Rehabilitation and plasticity following stroke: insights from rodent models. Neuroscience 311, 180–194 (2015). - PubMed
-
- Silasi G. & Murphy T. H. Stroke and the connectome: how connectivity guides therapeutic intervention. Neuron 83, 1354–68 (2014). - PubMed
Publication types
MeSH terms
Substances
LinkOut - more resources
Full Text Sources
Other Literature Sources
