. 2016 Nov 29:6:37644.
doi: 10.1038/srep37644.

Preparation of 6/8/11-Amino/Chloro-Oxoisoaporphine and Group-10 Metal Complexes and Evaluation of Their in Vitro and in Vivo Antitumor Activity

Affiliations

Preparation of 6/8/11-Amino/Chloro-Oxoisoaporphine and Group-10 Metal Complexes and Evaluation of Their in Vitro and in Vivo Antitumor Activity

Qi-Pin Qin et al. Sci Rep. .

Abstract

A series of group-10 metal complexes 1-14 of oxoisoaporphine derivatives were designed and synthesized. 1-14 were more selectively cytotoxic to Hep-G2 cells comparing with normal liver cells. In vitro cytotoxicity results showed that complexes 1-6, 7, 8, 10 and 11, especially 3, were telomerase inhibitors targeting c-myc, telomeric, and bcl-2 G4s and triggered cell senescence and apoptosis; they also caused telomere/DNA damage and S phase arrest. In addition, 1-6 also caused mitochondrial dysfunction. Notably, 3 with 6-amino substituted ligand La exhibited less side effects than 6 with 8-amino substituted ligand Lb and cisplatin, but similar tumor growth inhibition efficacy in BEL-7402 xenograft model. Complex 3 has the potential to be developed as an effective anticancer agent.


Figures

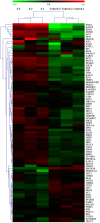
Figure 1
Figure 1. Synthetic routes for group-10 metal(II) complexes 16 of 6-amino-oxoisoaporphine (La) and 8-amino-oxoisoaporphine (Lb).
Reagents and solvents are the following: (a) NiCl2 or PdCl2, ethanol/water (v/v = 20:1) (reflux); (b) cis-Pt(DMSO)2Cl2, ethanol/CH3CN (v/v = 20:1) (reflux).
Figure 2
Figure 2. Synthetic routes for group-10 metal(II) complexes 711 of 8-chloro-oxoisoaporphine (Lc).
Reagents and solvents are the following: (a) cis-Pt(DMSO)2Cl2, ethanol/water (v/v = 20:1) (80 °C); (b) 1,2-ethylenediamine or 1,3-propanediamine, anhydrous ethanol (reflux); (c) cis-Pt(DMSO)2Cl2, methanol/CH3CN (v/v = 20:1) (80 °C); (d) 1,2-ethylenediamine, anhydrous ethanol (reflux).
Figure 3
Figure 3. Synthetic routes for group-10 metal(II) complexes 1214 of 10-chloro-11-amino-oxoisoaporphine (Ld).
Reagents and solvents are the following: NiCl2, PdCl2, or cis-Pt(DMSO)2Cl2, methanol/CH3CN/water (v/v/v = 15:5:1) (reflux).
Figure 4
Figure 4
The ORTEP drawings of La (A), complexes 3 (B), 7 (C) and 10 (D) showing atom labeling.
Figure 5
Figure 5. Hep-G2 cells were treated with cisplatin (10 μM), 1 (8 μM), 2 (15 μM), 3 (5 μM), 4 (18 μM), 5 (28 μM) and 6 (14 μM) at 37 °C for 24 h, respectively.
Figure 6
Figure 6. ΔTm data (°C) of 1.0 μM duplex DNA (F32T + H20M DNA), F21T (HTG21 G4), FMidG4T (Pu39 G4) and FPu18T (c-myc/Pu27 G4) G4s after treated with complexes 1–3 (1.0 μM) evaluated by RT-PCR.
Figure 7
Figure 7. The expression of TRF2, 53BP1, and TRF1 in Hep-G2 cells after treated with complexes 1 (8 μM), 2 (15 μM), 3 (5 μM), 4 (18 μM), 5 (28 μM) and 6 (14 μM) for 24 h was analyzed by Western blot, respectively.
(A,C) TRF2, 53BP1, and TRF1 protein levels in Hep-G2 cells were analyzed by western blot. (B,D) The whole-cell extracts were prepared and analyzed by Western blot analysis using antibodies against TRF2, 53BP1, and TRF1. The same blots were stripped and re-probed with a β-actin antibody to show equal protein loading. Western blot bands from three independent measurements were quantified with Image J. in (B,D).
Figure 8
Figure 8. Senescence induced by complexes 1–6 (0.5 μM) or 0.1% DMSO (control) on Hep-G2 cells for 7 days, and examined by Fluorescence microscope (Nikon Te2000 microscope, 100×) with stained β-galactosidase.
Figure 9
Figure 9. Complexes 1 (8 μM), 2 (15 μM), 3 (5 μM), 4 (18 μM), 5 (28 μM) and 6 (14 μM) effect on hTERT, bcl-2 and c-myc mRNA expression levels in Hep-G2 cells.
Figure 10
Figure 10. Western blot analysis of hTERT, bcl-2, and c-myc in Hep-G2 cells after 24 h incubation with complexes 1 (8 μM), 2 (15 μM), 3 (5 μM), 4 (18 μM), 5 (28 μM) and 6 (14 μM) for 24 h, respectively.
(A,C) hTERT, bcl-2, and c-myc protein levels in Hep-G2 cells were analyzed by western blot. (B,D) The whole-cell extracts were prepared and analyzed by Western blot analysis using antibodies against hTERT, bcl-2, and c-myc. The same blots were stripped and reprobed with a β-actin antibody to show equal protein loading. Western blotting bands from three independent measurements were quantified with Image J. in (B,D).
Figure 11
Figure 11
The successful transfection of 2.0 μg EGFP plasmid vector (A) and c-myc promoter plasmid vector (B) in Hep-G2 cells treatment of complexes 1 (8 μM), 2 (15 μM), 3 (5 μM), 4 (18 μM), 5 (28 μM) and 6 (14 μM) for 24 h was examined by fluorescence microcopy or/and Multimodel Plate Reader with luciferase reporter gene assay kit, respectively.
Figure 12
Figure 12. The influence of complexes 1 (8 μM), 2 (15 μM), 3 (5 μM), 4 (18 μM), 5 (28 μM) and 6 (14 μM) on telomerase activity in Hep-G2 cells for 24 h, respectively.
Figure 13
Figure 13. The different phase percentages of Hep-G2 cell cycle treated with complexes 1 (8 μM), 2 (15 μM), 3 (5 μM), 4 (18 μM), 5 (28 μM), 6 (14 μM), 8 (10 μM) and 11 (6 μM) for 24 h, respectively.
Figure 14
Figure 14. The protein levels of cell cycle protein regulators in Hep-G2 cells after treatment with complexes 1 (8 μM), 2 (15 μM), 3 (5 μM), 4 (18 μM), 5 (28 μM) and 6 (14 μM) for 24 h, respectively.
(A,C) Cell cycle protein regulators protein levels in Hep-G2 cells were analyzed by western blot. (B,D) The whole-cell extracts were prepared and analyzed by Western blot analysis using antibodies against cell cycle protein regulators proteins. The same blots were stripped and reprobed with a β-actin antibody to show equal protein loading. Western blotting bands from three independent measurements were quantified with Image J. in (B,D).
Figure 15
Figure 15. Complexes 1–6 -induced DNA damage in Hep-G2 cells.
Cells were treated with complexes 1 (8 μM), 2 (15 μM), 3 (5 μM), 4 (18 μM), 5 (28 μM) and 6 (14 μM) with the indicated concentrations for 24 h and analyzed by comet assay, respectively. The length of the tail reflects the DNA damage in Hep-G2 cells.
Figure 16
Figure 16. Loss of Δψ in Hep-G2 cells treated with complexes 1 (8 μM), 2 (15 μM), 3 (5 μM), 4 (18 μM), 5 (28 μM) and 6 (14 μM) for 24 h, and the cells was examined by a fluorescence microscope (Nikon Te2000, 200×) with stained by JC-1.
Figure 17
Figure 17. Effect of complexes 1 (8 μM), 2 (15 μM), 3 (5 μM), 4 (18 μM), 5 (28 μM) and 6 (14 μM) on Δψ in Hep-G2 cells, respectively.
After treatment with complexes 1 (8 μM), 2 (15 μM), 3 (5 μM), 4 (18 μM), 5 (28 μM) and 6 (14 μM) for 24 h, the cells was examined by flow-cytometry with Rh 123 staining.
Figure 18
Figure 18. Western blot assay of apoptosis related protein levels in Hep-G2 cells treatmented with complexes 1 (8 μM), 2 (15 μM), 3 (5 μM), 4 (18 μM), 5 (28 μM) and 6 (14 μM) for 24 h, respectively.
(A,C) Apoptosis related proteins protein levels in Hep-G2 cells were analyzed by western blot. (B,D) The whole-cell extracts were prepared and analyzed by Western blot analysis using antibodies against apoptosis related proteins. The same blots were stripped and reprobed with a β-actin antibody to show equal protein loading. Western blotting bands from three independent measurements were quantified with Image J. in (B,D).
Figure 19
Figure 19. ROS generation assay in Hep-G2 cells was examined by a fluorescence microscope (Nikon Te2000, 200×).
(A,E) Control and (B–D,F–H) Complexes 1 (8 μM), 2 (15 μM), 3 (5 μM), 4 (18 μM), 5 (28 μM) and 6 (14 μM) treatment with Hep-G2 cells for 24 h, respectively.
Figure 20
Figure 20. ROS generation assay in Hep-G2 cells was examined by flow cytometry of Hep-G2 cells after treated with complexes 1 (8 μM), 2 (15 μM), 3 (5 μM), 4 (18 μM), 5 (28 μM) and 6 (14 μM), respectively.
Figure 21
Figure 21. Effects of complexes 1 (8 μM), 2 (15 μM), 3 (5 μM), 4 (18 μM), 5 (28 μM) and 6 (14 μM) on Ca2+ activation level in Hep-G2 cells.
Figure 22
Figure 22. Activation of caspase-3/8/9 caused by complexes 1 (8 μM), 2 (15 μM), 3 (5 μM), 4 (18 μM), 5 (28 μM) and 6 (14 μM) in Hep-G2 cells for 24 h.
Figure 23
Figure 23. The morphological changes of apoptotic cell nucleus of Hep-G2 cells induced by complexes 1 (8 μM), 2 (15 μM), 3 (5 μM), 4 (18 μM), 5 (28 μM), and 6 (14 μM) for 24 h, and the Hep-G2 cells were examined by fluorescence microscope (Nikon Te2000, 400×) by staining with Hoechst 33258.
Figure 24
Figure 24. Apoptosis of Hep-G2 cells treated with complexes 1 (8 μM), 2 (15 μM), 3 (5 μM), 4 (18 μM), 5 (28 μM), and 6 (14 μM) for 24 h, respectively, and these cells the Hep-G2 cells were examined by fluorescence microscope (Nikon Te2000, 200×) by stained with AO/EB.
Figure 25
Figure 25. Populations of apoptotic Hep-G2 cells treated with complexes 1–6 were examined by FACS analysis with double staining by Annexin V and PI for visualization.
Figure 26
Figure 26. The mRNA expression level of telomeres/telomerase-related genes in the Hep-G2 cells after treated with complex 3 (5 μM) for 24 h.
Figure 27
Figure 27. The mRNA expression level of telomeres/telomerase-related genes in the Hep-G2 cells after treated with complex 6 (14 μM) for 24 h.
Figure 28
Figure 28
Complex 3 (16, 8 mg/kg/bid) and cisplatin (2 mg/kg/q2d) inhibited the growth of BEL-7402 tumor xenograft in compared with vehicle group, respectively. ***P < 0.01, **P < 0.05, p vs vehicle control.

Similar articles

Cited by

References

    1. Han H. & Hurley L. H. G-Quadruplex DNA: a potential target for anti-cancer drug design. Trends Pharmacol. Sci. 21, 136–142 (2000). - PubMed
    1. Amrane S. et al. Topology of a NDA G-qudruplex structure formed in the HIV-1 promoter: a potential target for anti-HIV drug development. J. Am. Chem. Soc. 136, 5249–5252 (2014). - PubMed
    1. Paritala H. & Firestine S. M. Characterization of insulin ILPR sequences for their ability to adopt a G-quadruplex structure. Nucleos. Nucleot. Nucl. 29, 81–90 (2010). - PubMed
    1. Phan A. T., Kuryavyi V., Gaw H. Y. & Patel D. J. Small-molecule interaction with a five-guanine-tract G-quadruplex structure from the human MYC promoter. Nat. Chem. Biol. 1, 167–173 (2005). - PMC - PubMed
    1. Phan A. T., Kuryavyi V., Burge S., Neidle S. & Patel D. J. Structure of an unprecedented G-quadruplex scaffold in the human c-kit promoter. J. Am. Chem. Soc. 129, 4386–4392 (2007). - PMC - PubMed

Publication types

MeSH terms

LinkOut - more resources