

Genetic Predisposition to an Impaired Metabolism of the Branched-Chain Amino Acids and Risk of Type 2 Diabetes: A Mendelian Randomisation Analysis
- PMID: 27898682
- PMCID: PMC5127513
- DOI: 10.1371/journal.pmed.1002179
Genetic Predisposition to an Impaired Metabolism of the Branched-Chain Amino Acids and Risk of Type 2 Diabetes: A Mendelian Randomisation Analysis
Abstract
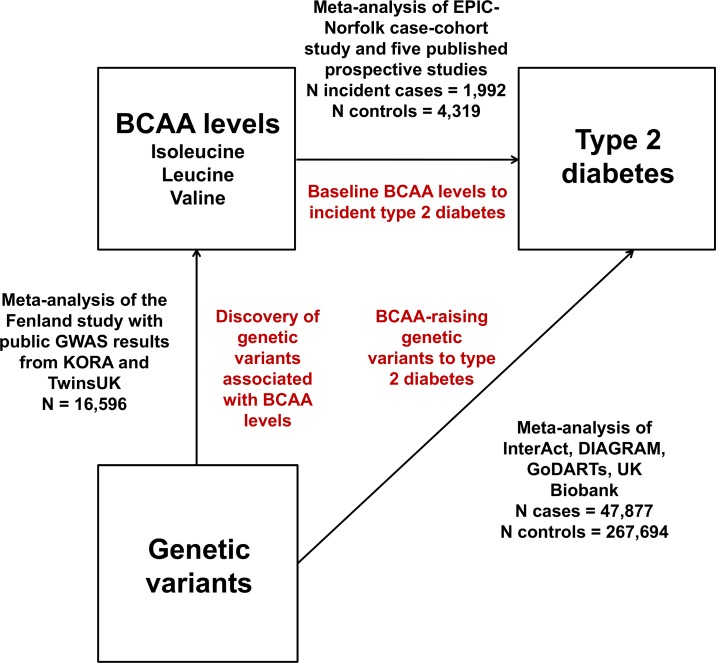
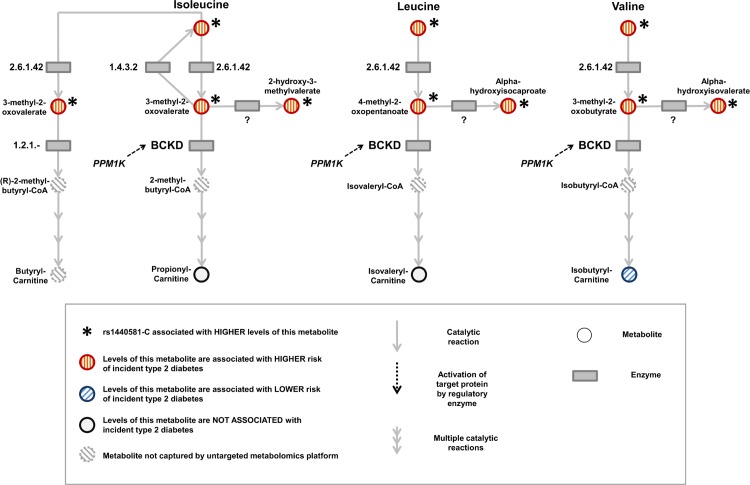
Background: Higher circulating levels of the branched-chain amino acids (BCAAs; i.e., isoleucine, leucine, and valine) are strongly associated with higher type 2 diabetes risk, but it is not known whether this association is causal. We undertook large-scale human genetic analyses to address this question.
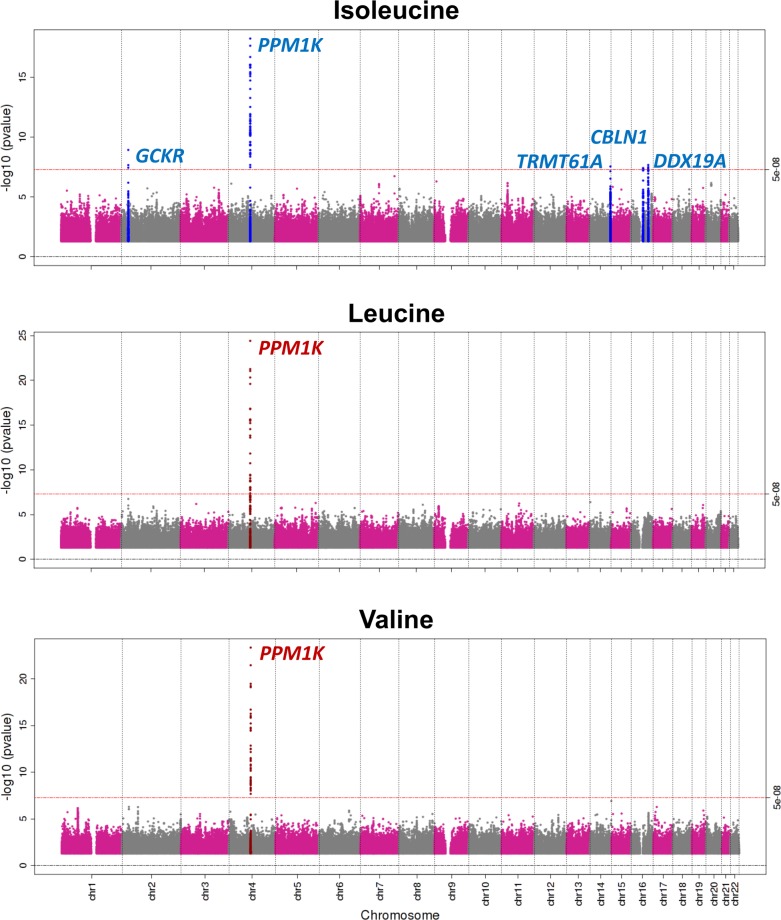
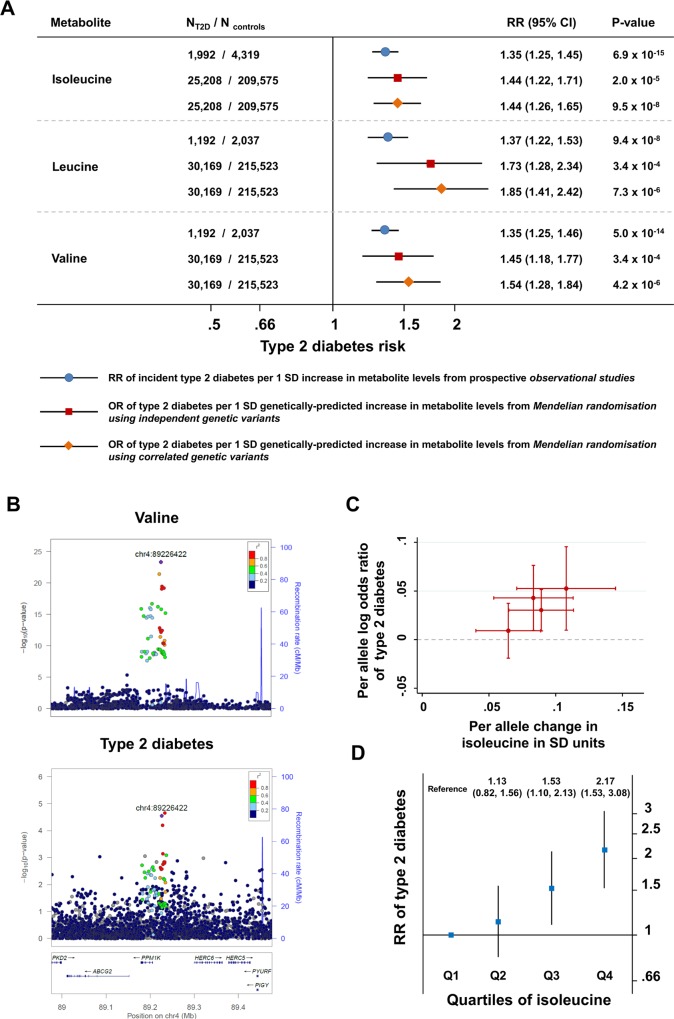
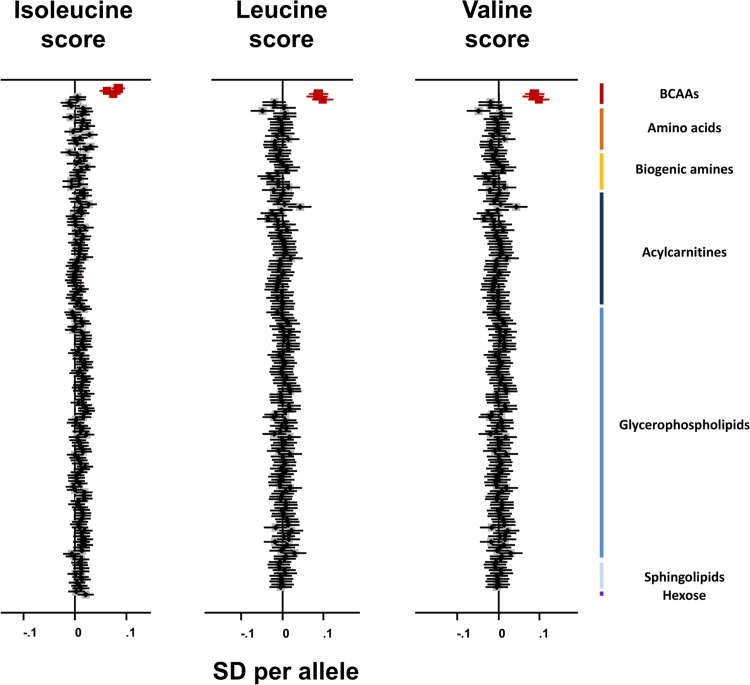
Methods and findings: Genome-wide studies of BCAA levels in 16,596 individuals revealed five genomic regions associated at genome-wide levels of significance (p < 5 × 10⁻⁸). The strongest signal was 21 kb upstream of the PPM1K gene (beta in standard deviations [SDs] of leucine per allele = 0.08, p = 3.9 × 10⁻²⁵), encoding an activator of the mitochondrial branched-chain alpha-ketoacid dehydrogenase (BCKD) responsible for the rate-limiting step in BCAA catabolism. In another analysis, in up to 47,877 cases of type 2 diabetes and 267,694 controls, a genetically predicted difference of 1 SD in amino acid level was associated with an odds ratio for type 2 diabetes of 1.44 (95% CI 1.26-1.65, p = 9.5 × 10⁻⁸) for isoleucine, 1.85 (95% CI 1.41-2.42, p = 7.3 × 10⁻⁶) for leucine, and 1.54 (95% CI 1.28-1.84, p = 4.2 × 10⁻⁶) for valine. Estimates were highly consistent with those from prospective observational studies of the association between BCAA levels and incident type 2 diabetes in a meta-analysis of 1,992 cases and 4,319 non-cases. Metabolome-wide association analyses of BCAA-raising alleles revealed high specificity to the BCAA pathway and an accumulation of metabolites upstream of branched-chain alpha-ketoacid oxidation, consistent with reduced BCKD activity. Limitations of this study are that, while the association of genetic variants appeared highly specific, the possibility of pleiotropic associations cannot be entirely excluded. Similar to other complex phenotypes, genetic scores used in the study captured a limited proportion of the heritability in BCAA levels. Therefore, it is possible that only some of the mechanisms that increase BCAA levels or affect BCAA metabolism are implicated in type 2 diabetes.
Conclusions: Evidence from this large-scale human genetic and metabolomic study is consistent with a causal role of BCAA metabolism in the aetiology of type 2 diabetes.
Conflict of interest statement
CL receives a stipend as a specialty consulting editor for PLOS Medicine and serves on the journal's editorial board. MIM is a member of the Editorial Board of PLOS Medicine. MIM is a member of advisory boards for NovoNordisk and Pfizer. MIM received honoraria for speaking engagements: NovoNordisk, Pfizer, Eli Lilly. MIM receives research funding from: NovoNordisk, Pfizer, Eli Lilly, Takeda, Servier, Sanofi-Aventis, Boehringer Ingelheim, Janssen, Merck, Roche, Astra-Zeneca. EDK is an employee of Metabolon Inc., a fee-for-service metabolomics provider and received salary and stock options as compensation. IB and her spouse own stock in GlaxoSmithKline and Incyte Corporation. SB acts as an occasional paid statistical referee for PLOS Medicine, however had no reviewer role in this paper. The other authors report no conflict of interest relative to this study.
Figures
References
Publication types
MeSH terms
Substances
Grants and funding
- G0800270/MRC_/Medical Research Council/United Kingdom
- MR/N003284/1/MRC_/Medical Research Council/United Kingdom
- MC_EX_MR/L100002/1/MRC_/Medical Research Council/United Kingdom
- G0401527/MRC_/Medical Research Council/United Kingdom
- 090532/WT_/Wellcome Trust/United Kingdom
- MR/K006584/1/MRC_/Medical Research Council/United Kingdom
- 098381/WT_/Wellcome Trust/United Kingdom
- MR/P01836X/1/MRC_/Medical Research Council/United Kingdom
- G1000143/MRC_/Medical Research Council/United Kingdom
- MC_UU_12012/5/MRC_/Medical Research Council/United Kingdom
- MC_UU_12015/1/MRC_/Medical Research Council/United Kingdom
- MC_UU_00002/7/MRC_/Medical Research Council/United Kingdom
- 107064/WT_/Wellcome Trust/United Kingdom
- 14136/CRUK_/Cancer Research UK/United Kingdom
- MC_UP_A090_1006/MRC_/Medical Research Council/United Kingdom
- MC_PC_13030/MRC_/Medical Research Council/United Kingdom
- MR/P011705/1/MRC_/Medical Research Council/United Kingdom
- RG/10/12/28456/BHF_/British Heart Foundation/United Kingdom
LinkOut - more resources
Full Text Sources
Other Literature Sources
Medical
