

Stable Host Gene Expression in the Gut of Adult Drosophila melanogaster with Different Bacterial Mono-Associations
- PMID: 27898741
- PMCID: PMC5127555
- DOI: 10.1371/journal.pone.0167357
Stable Host Gene Expression in the Gut of Adult Drosophila melanogaster with Different Bacterial Mono-Associations
Abstract
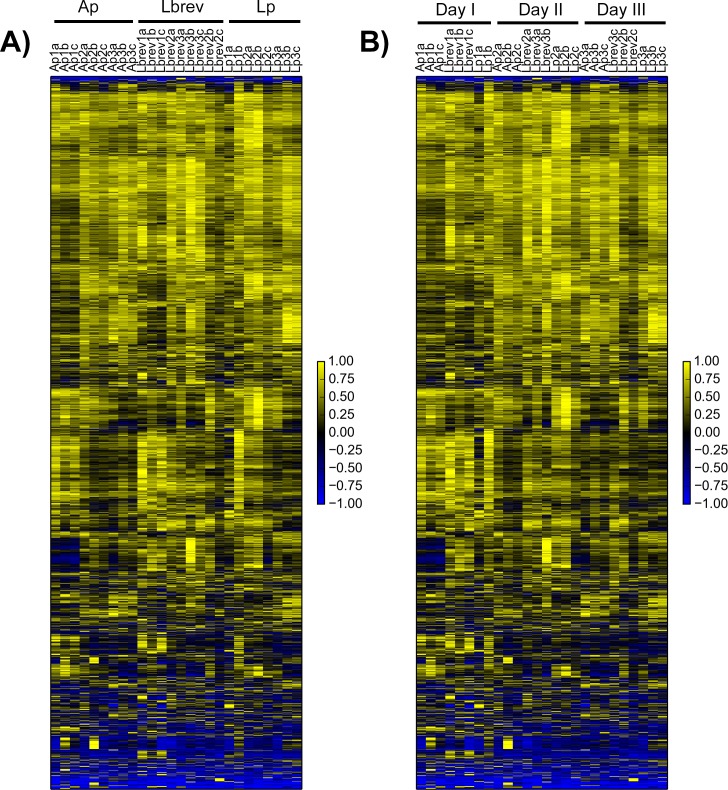
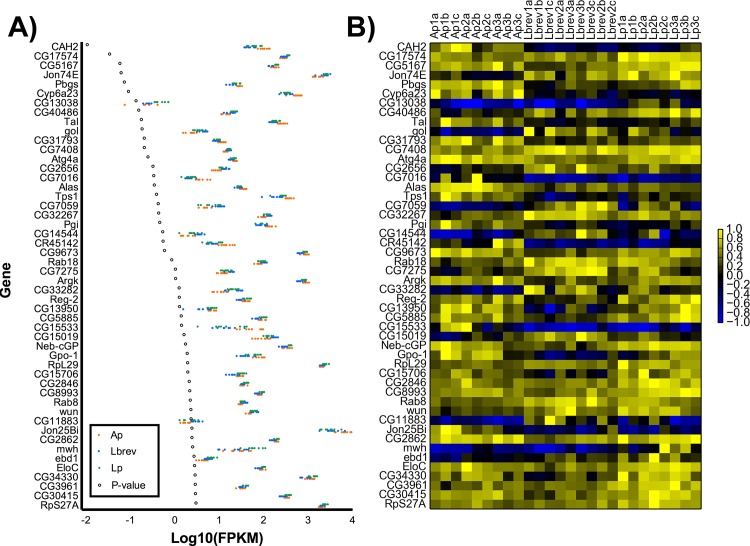
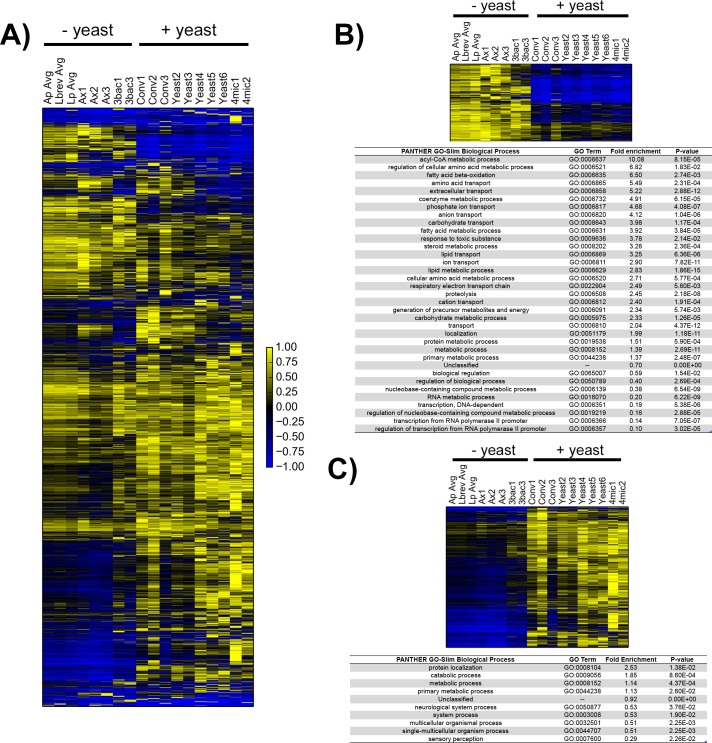
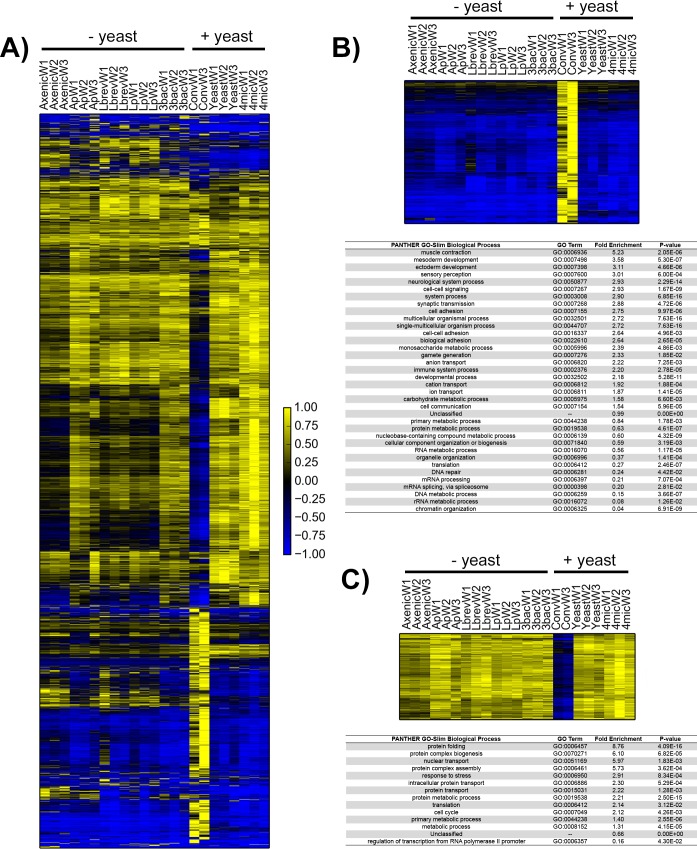
There is growing evidence that the microbes found in the digestive tracts of animals influence host biology, but we still do not understand how they accomplish this. Here, we evaluated how different microbial species commonly associated with laboratory-reared Drosophila melanogaster impact host biology at the level of gene expression in the dissected adult gut and in the entire adult organism. We observed that guts from animals associated from the embryonic stage with either zero, one or three bacterial species demonstrated indistinguishable transcriptional profiles. Additionally, we found that the gut transcriptional profiles of animals reared in the presence of the yeast Saccharomyces cerevisiae alone or in combination with bacteria could recapitulate those of conventionally-reared animals. In contrast, we found whole body transcriptional profiles of conventionally-reared animals were distinct from all of the treatments tested. Our data suggest that adult flies are insensitive to the ingestion of the bacteria found in their gut, but that prior to adulthood, different microbes impact the host in ways that lead to global transcriptional differences observable across the whole adult body.
Conflict of interest statement
MBE is a founder and member of the board of directors of PLOS. This does not alter the authors' adherence to PLOS ONE policies on sharing data and materials.
Figures
Similar articles
-
Microbiota-induced changes in drosophila melanogaster host gene expression and gut morphology.mBio. 2014 May 27;5(3):e01117-14. doi: 10.1128/mBio.01117-14. mBio. 2014. PMID: 24865556 Free PMC article.
-
How gut transcriptional function of Drosophila melanogaster varies with the presence and composition of the gut microbiota.Mol Ecol. 2018 Apr;27(8):1848-1859. doi: 10.1111/mec.14413. Epub 2017 Dec 2. Mol Ecol. 2018. PMID: 29113026
-
Drosophila Genotype Influences Commensal Bacterial Levels.PLoS One. 2017 Jan 17;12(1):e0170332. doi: 10.1371/journal.pone.0170332. eCollection 2017. PLoS One. 2017. PMID: 28095502 Free PMC article.
-
Friend, foe or food? Recognition and the role of antimicrobial peptides in gut immunity and Drosophila-microbe interactions.Philos Trans R Soc Lond B Biol Sci. 2016 May 26;371(1695):20150295. doi: 10.1098/rstb.2015.0295. Philos Trans R Soc Lond B Biol Sci. 2016. PMID: 27160597 Free PMC article. Review.
-
Gut-associated microbes of Drosophila melanogaster.Gut Microbes. 2012 Jul-Aug;3(4):307-21. doi: 10.4161/gmic.19896. Epub 2012 May 10. Gut Microbes. 2012. PMID: 22572876 Free PMC article. Review.
Cited by
-
Differential gene expression in Drosophila melanogaster and D. nigrosparsa infected with the same Wolbachia strain.Sci Rep. 2021 May 31;11(1):11336. doi: 10.1038/s41598-021-90857-5. Sci Rep. 2021. PMID: 34059765 Free PMC article.
-
Interactions between the microbiome and mating influence the female's transcriptional profile in Drosophila melanogaster.Sci Rep. 2020 Oct 23;10(1):18168. doi: 10.1038/s41598-020-75156-9. Sci Rep. 2020. PMID: 33097776 Free PMC article.
-
Robust manipulation of the behavior of Drosophila melanogaster by a fungal pathogen in the laboratory.Elife. 2018 Jul 26;7:e34414. doi: 10.7554/eLife.34414. Elife. 2018. PMID: 30047862 Free PMC article.
-
The relationship between the gut microbiome and host gene expression: a review.Hum Genet. 2021 May;140(5):747-760. doi: 10.1007/s00439-020-02237-0. Epub 2020 Nov 22. Hum Genet. 2021. PMID: 33221945 Free PMC article. Review.
-
Microbiome-by-ethanol interactions impact Drosophila melanogaster fitness, physiology, and behavior.iScience. 2022 Feb 28;25(4):104000. doi: 10.1016/j.isci.2022.104000. eCollection 2022 Apr 15. iScience. 2022. PMID: 35313693 Free PMC article.
References
MeSH terms
Substances
Grants and funding
LinkOut - more resources
Full Text Sources
Other Literature Sources
Molecular Biology Databases
