

Time-to-event versus ten-year-absolute-risk in cardiovascular risk prevention - does it make a difference? Results from the Optimizing-Risk-Communication (OptRisk) randomized-controlled trial
- PMID: 27899103
- PMCID: PMC5129612
- DOI: 10.1186/s12911-016-0393-1
Time-to-event versus ten-year-absolute-risk in cardiovascular risk prevention - does it make a difference? Results from the Optimizing-Risk-Communication (OptRisk) randomized-controlled trial
Abstract
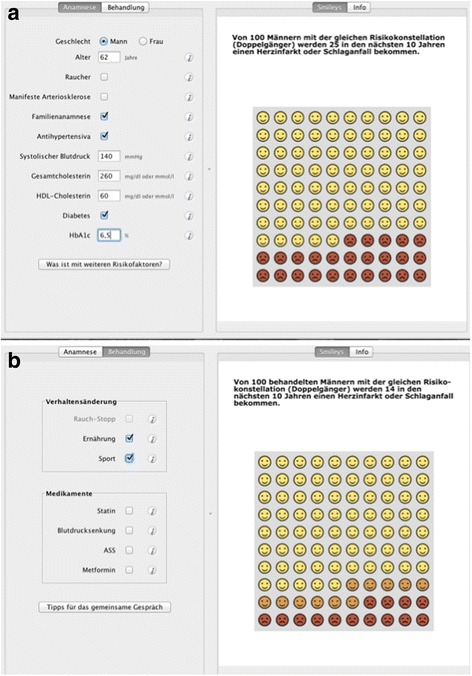
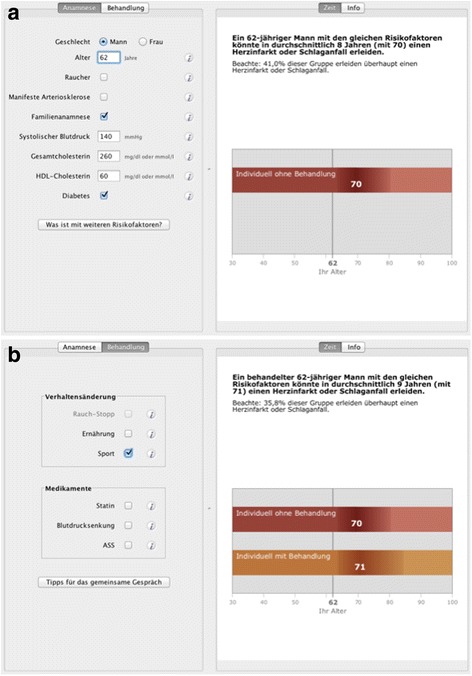
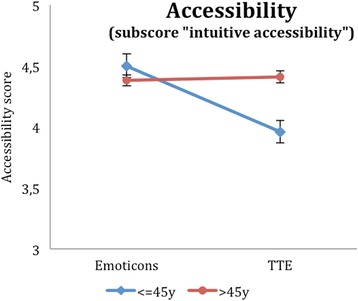
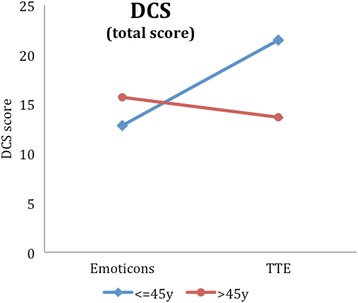
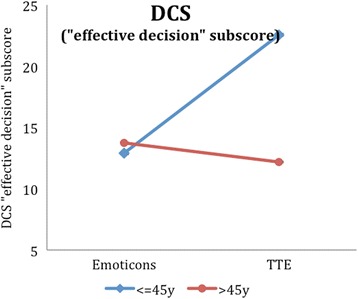
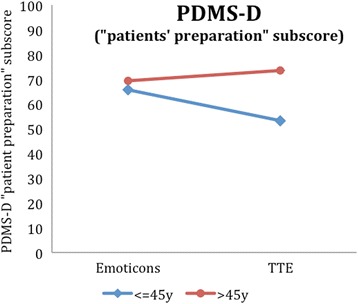
Background: The concept of shared-decision-making is a well-established approach to increase the participation of patients in medical decisions. Using lifetime risk or time-to-event (TTE) formats has been increasingly suggested as they might have advantages, e.g. in younger patients, to better show consequences of unhealthy behaviour. In this study, the most-popular ten-year risk illustration in the decision-aid-software arribaTM (emoticons), is compared within a randomised trial to a new-developed TTE illustration, which is based on a Markov model.
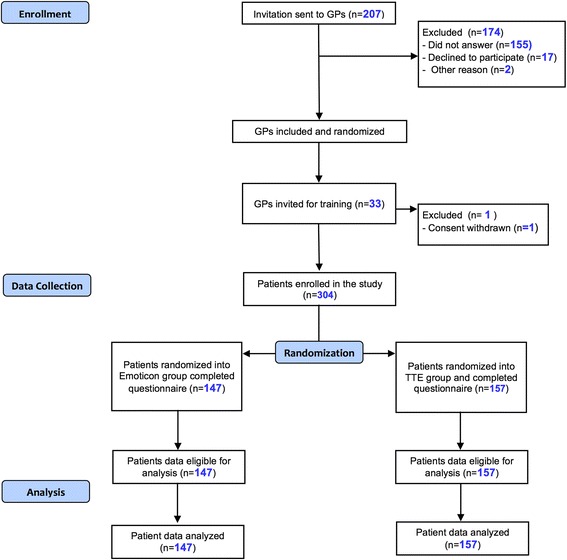
Methods: Thirty-two General Practitioners (GPs) took part in the study. A total of 304 patients were recruited and counseled by their GPs with arribaTM, and randomized to either the emoticons or the TTE illustration, followed by a patient questionnaire to figure out the degree of shared-decision-making (PEF-FB9, German questionnaire to measure the participation in the shared decision-making process, primary outcome), as well as the decisional conflict, perceived risk, accessibility and the degree of information, which are all secondary outcomes.
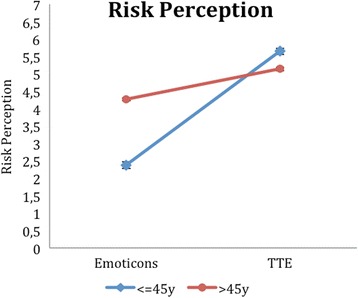
Results: Regarding our primary outcome PEF-FB9 the new TTE illustration is not inferior compared to the well-established emoticons taking the whole study population into account. Furthermore, the non-inferiority of the innovative TTE could be confirmed for all secondary outcome variables. The explorative analysis indicates even advantages in younger patients (below 46 years of age).
Conclusion: The TTE format seems to be as useful as the well-established emoticons. For certain patient populations, especially younger patients, the TTE may be even superior to demonstrate a cardiovascular risk at early stages. Our results suggest that time-to-event illustrations should be considered for current decision support tools covering cardiovascular prevention.
Trial registration: The study was registered at the German Clinical Trials Register and at the WHO International Clinical Trials Register Platform ( ICTRP, ID DRKS00004933 ); registered 2 February 2016 (retrospectively registered).
Keywords: Accessibility; ArribaTM; Cardiovascular disease; Decision-aid; Decisional conflict; Lifetime risk; Randomized-controlled trial; Risk-assessment; Shared decision-making; Ten-year-prognosis; Time-to-event.
Figures
Similar articles
-
The Optimizing-Risk-Communication (OptRisk) randomized trial - impact of decision-aid-based consultation on adherence and perception of cardiovascular risk.Patient Prefer Adherence. 2019 Mar 27;13:441-452. doi: 10.2147/PPA.S197545. eCollection 2019. Patient Prefer Adherence. 2019. PMID: 30988601 Free PMC article.
-
The effect of a new lifetime-cardiovascular-risk display on patients' motivation to participate in shared decision-making.BMC Fam Pract. 2018 Jun 9;19(1):84. doi: 10.1186/s12875-018-0766-x. BMC Fam Pract. 2018. PMID: 29885661 Free PMC article.
-
Effect of the statin choice encounter decision aid in Spanish patients with type 2 diabetes: A randomized trial.Patient Educ Couns. 2016 Feb;99(2):295-9. doi: 10.1016/j.pec.2015.08.032. Epub 2015 Sep 1. Patient Educ Couns. 2016. PMID: 26343571 Clinical Trial.
-
Reduction of the long-term use of proton pump inhibitors by a patient-oriented electronic decision support tool (arriba-PPI): study protocol for a randomized controlled trial.Trials. 2019 Nov 21;20(1):636. doi: 10.1186/s13063-019-3728-2. Trials. 2019. PMID: 31752978 Free PMC article.
-
Absolute cardiovascular disease risk and shared decision making in primary care: a randomized controlled trial.Ann Fam Med. 2008 May-Jun;6(3):218-27. doi: 10.1370/afm.854. Ann Fam Med. 2008. PMID: 18474884 Free PMC article. Clinical Trial.
Cited by
-
GSK-3β, FYN, and DYRK1A: Master Regulators in Neurodegenerative Pathways.Int J Mol Sci. 2021 Aug 23;22(16):9098. doi: 10.3390/ijms22169098. Int J Mol Sci. 2021. PMID: 34445804 Free PMC article. Review.
-
Sex and gender considerations in implementation interventions to promote shared decision making: A secondary analysis of a Cochrane systematic review.PLoS One. 2020 Oct 8;15(10):e0240371. doi: 10.1371/journal.pone.0240371. eCollection 2020. PLoS One. 2020. PMID: 33031475 Free PMC article.
-
Are shared decision making studies well enough described to be replicated? Secondary analysis of a Cochrane systematic review.PLoS One. 2022 Mar 16;17(3):e0265401. doi: 10.1371/journal.pone.0265401. eCollection 2022. PLoS One. 2022. PMID: 35294494 Free PMC article.
-
A systematic review of shared decision making training programs for general practitioners.BMC Med Educ. 2024 May 29;24(1):592. doi: 10.1186/s12909-024-05557-1. BMC Med Educ. 2024. PMID: 38811922 Free PMC article.
-
The impact of perception bias for cardiovascular disease risk on physical activity and dietary habits.Int J Nurs Sci. 2024 Oct 13;11(5):505-512. doi: 10.1016/j.ijnss.2024.10.011. eCollection 2024 Nov. Int J Nurs Sci. 2024. PMID: 39698132 Free PMC article.
References
-
- Härter M. Editorial: Partizipative Entscheidungsfindung (Shared Decision Making) – ein von Patienten, Ärzten und der Gesundheitspolitik geforderter Ansatz setzt sich durch. Z Evid Qual Gesundhwesen. 2004;98:89–92. - PubMed
-
- Härter M, Loh A, Spies C. Gemeinsam entscheiden - erfolgreich behandeln. Köln: Deutscher Ärzteverlag; 2005.
Publication types
MeSH terms
Associated data
LinkOut - more resources
Full Text Sources
Other Literature Sources
