Review
. 2016 Nov 30;18(1):89.
doi: 10.1186/s12968-016-0308-4.

Cardiac T1 Mapping and Extracellular Volume (ECV) in clinical practice: a comprehensive review

Affiliations
Review

Cardiac T1 Mapping and Extracellular Volume (ECV) in clinical practice: a comprehensive review

Philip Haaf et al. J Cardiovasc Magn Reson. .

Abstract

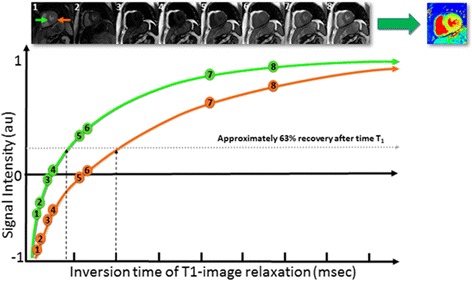
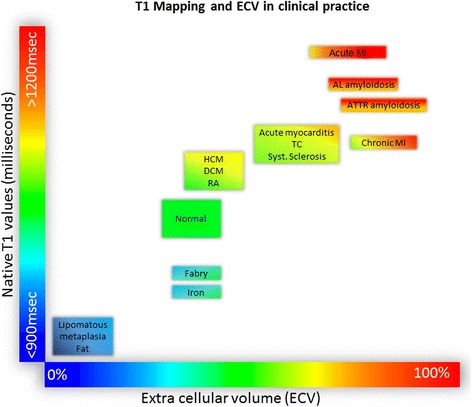
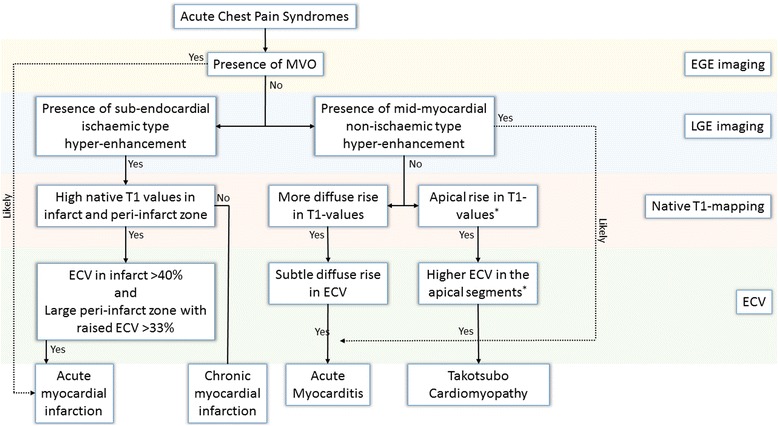
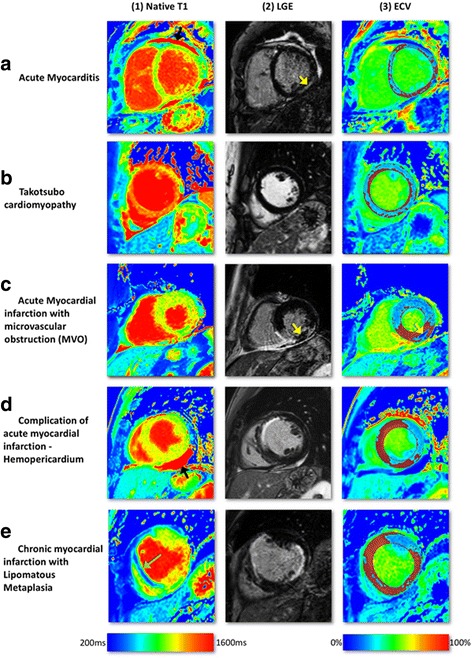
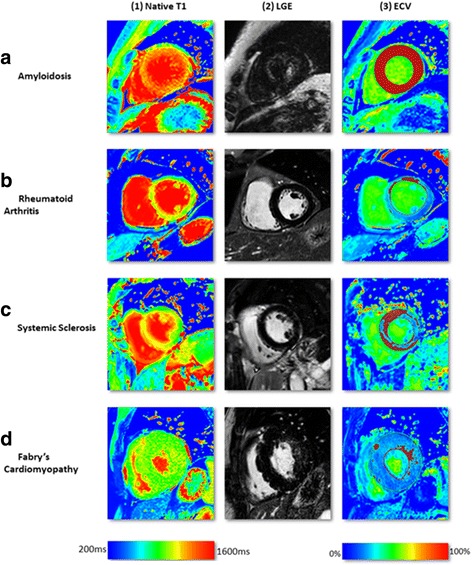
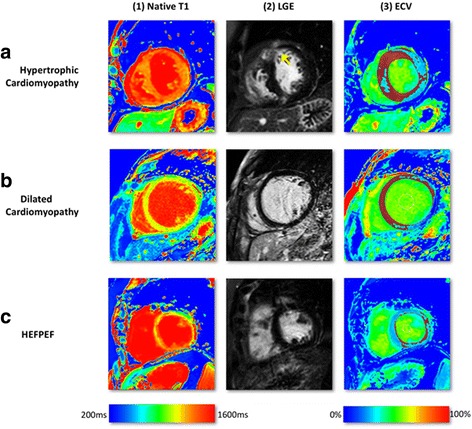
Cardiovascular Magnetic Resonance is increasingly used to differentiate the aetiology of cardiomyopathies. Late Gadolinium Enhancement (LGE) is the reference standard for non-invasive imaging of myocardial scar and focal fibrosis and is valuable in the differential diagnosis of ischaemic versus non-ischaemic cardiomyopathy. Diffuse fibrosis may go undetected on LGE imaging. Tissue characterisation with parametric mapping methods has the potential to detect and quantify both focal and diffuse alterations in myocardial structure not assessable by LGE. Native and post-contrast T1 mapping in particular has shown promise as a novel biomarker to support diagnostic, therapeutic and prognostic decision making in ischaemic and non-ischaemic cardiomyopathies as well as in patients with acute chest pain syndromes. Furthermore, changes in the myocardium over time may be assessed longitudinally with this non-invasive tissue characterisation method.

Keywords: Acute chest pain syndromes; Cardiomyopathy; Diffuse myocardial fibrosis; ECV; T1 mapping.


Figures

Fig. 1
Fig. 1
Modified Look-Locker Inversion Recovery (MOLLI) scheme for T1-mapping in the heart. This protocol employs two inversions to acquire eight images over 11 heart beats, referred to here as 5(3)3, which means five images are acquired over consecutive cardiac cycles followed by a three heart beat gap and then three images are acquired over consecutive cardiac cycles. 5s(3s)3s MOLLI schemes would acquire images for a duration of 5s followed by a gap of 3s and a second acquisition train lasting 3s, further minimizing heart rate dependency of the results. For illustrative purpose, the orange arrow and relaxation curve refer to an area of myocardial infarction and elevated native T1 values. The green arrow and relaxation curve refer to an area of normal septal myocardium and normal native T1 values. Images are sorted by inversion times
Fig. 2
Fig. 2
Tissue characterisation using native T1 and extracellular volume fraction (ECV). Absolute values for native T1 depend greatly on field strength (1.5 T or 3 T), pulse sequence (MOLLI or ShMOLLI), scanner manufacturer and rules of measurements. For the purpose of comparability, only studies using 1.5 T scanners were considered in this figure. Figure adapted from Martin Ugander (SCMR 2014)
Fig. 3
Fig. 3
Acute chest pain syndromes algorithm using multi-parametric tissue characterisation. ECV denotes extra-cellular volume, LGE Late Gadolinium Enhancement, and MVO microvascular obstruction. . *This holds true for classical type 1 Takotsubo Cardiomyopathy
Fig. 4
Fig. 4
Multi-parametric tissue characterisation at mid-slice in acute chest pain syndromes. On ECV-maps, red areas represent ECV greater than 30%. T1-mapping was done using a modified Look-Locker Inversion Recovery (MOLLI) pulse sequence on 1.5 Tesla Ingenia, Philips, Best, The Netherlands. a Acute myocarditis with higher native T1-values in the infero-lateral wall of the left ventricle (a1) consistent with LGE in the mid inferior-lateral wall (a2, yellow arrow). The ECV map (a3) demonstrates diffusely increased extra-cellular space. b Takotsubo Cardiomyopathy (TC) with diffusely high native T1 values (b1), no evidence of focal LGE (b2) and diffusely increased ECV (b3). c Acute re-perfused ST-elevation myocardial infarction affecting the inferior wall. Native T1-vales are raised in the area of risk (>1000ms) and also in the remote myocardium. On LGE imaging, inferior infarction with an area of microvascular obstruction can be seen (yellow arrow, c2). ECV is raised in the infarct zone but low in the MVO as this area does not take up any contract (yellow arrow, c3). d Anterior wall ST-elevation myocardial infarction with rupture of the left ventricle free wall (not seen in these images) resulting in haemo-pericardium. The pericardial haemorrhage has high native T1 values (black arrow, d1), high signal on LGE and low ECV values (d3). e Chronic MI in the antero-septal wall. There is an area of reduced native T1 values in the septum (green arrow, e1) which corresponds to lipomatous metaplasia transformation in previous antero-septal infarct. There is also an acute infarction in the lateral wall with some peri-infarct oedema seen on native T1. Abbreviations: AMI, acute myocardial infarction; ECV, extra-cellular volume; MI, myocardial infarction; LGE, Late Gadolinium Enhancement; TC, Takotsubo Cardiomyopathy
Fig. 5
Fig. 5
Multi-parametric tissue characterisation at mid-slice in diseases involving myocardium. On ECV-maps, red areas represent ECV greater than 30%. T1-mapping was done using a modified Look-Locker Inversion Recovery (MOLLI) pulse sequence on 1.5 Tesla Ingenia, Philips, Best, The Netherlands. a Biopsy proven cardiac amyloidosis. T1 maps show diffuse rise in native-T1 values (a1). On LGE-imaging, there is low contrast-noise ratio (CNR) between the blood pool and the myocardium (a2). ECV-maps demonstrate diffuse rise in extra-cellular space in the whole myocardium. b Established rheumatoid arthritis demonstrating some rise in native T1 (b1) and ECV (b3) with normal signal distribution on LGE-imaging (b2). c Established Systemic Sclerosis demonstrating rise in native T1 values predominantly in the septum (c1) and more widespread increase in ECV (c3). There is no evidence of any scar or fibrosis on LGE-imaging. d Bio-chemical diagnosis of Fabry’s disease: Native T1 (e1) demonstrates pseudo-normalization due to the effects of replacement fibrosis exceeding the fatty-related T1 decrease. LGE (e2) demonstrates fibrosis of the lateral wall in consistence with the ECV map (e3). Abbreviations: ECV, extra-cellular volume; LGE, Late Gadolinium Enhancement
Fig. 6
Fig. 6
Multi-parametric tissue characterisation at mid-slice in cardiomyopathies. On ECV-maps, red areas represent ECV greater than 30%. T1-mapping was done using a modified Look-Locker Inversion Recovery (MOLLI) pulse sequence on 1.5 Tesla Ingenia, Philips, Best, The Netherlands. a HCM showing diffuse and heterogeneous LGE in the anterior wall (yellow arrow, a2). Native T1 was diffusely raised, exceeding the hypertrophied segments (a1). ECV-maps demonstrate higher ECV in and around the diffuse LGE (a3). b DCM with no LGE enhancement (b2) but raised native T1 values in the septum (1000–1200ms) (b1) and raised ECV (b3). c HFpEF Native-T1 values were significantly raised through-out (>1000ms) with no presence of scar on LGE-imaging (c2). ECV maps demonstrated patchy rise in extra-cellular space (c3). Abbreviations: DCM, dilated cardiomyopathy; ECV, extra-cellular volume; HFpEF, heart failure with preserved ejection fraction; HCM, hypertrophic cardiomyopathy; LGE, Late Gadolinium Enhancement

References

    1. Hundley WG, Bluemke DA, Finn JP, Flamm SD, Fogel MA, Friedrich MG, Ho VB, Jerosch-Herold M, Kramer CM, Manning WJ, Patel M, Pohost GM, Stillman AE, White RD, Woodard PK. ACCF/ACR/AHA/NASCI/SCMR 2010 expert consensus document on cardiovascular magnetic resonance: a report of the american college of cardiology foundation task force on expert consensus documents. J Am Coll Cardiol. 2010;55:2614–62. doi: 10.1016/j.jacc.2009.11.011. - DOI - PMC - PubMed
    1. Parsai C, O’Hanlon R, Prasad SK, Mohiaddin RH. Diagnostic and prognostic value of cardiovascular magnetic resonance in non-ischaemic cardiomyopathies. J Cardiovasc Magn Reson. 2012;14:54. doi: 10.1186/1532-429X-14-54. - DOI - PMC - PubMed
    1. Kim RJ, Wu E, Rafael A, Chen EL, Parker MA, Simonetti O, Klocke FJ, Bonow RO, Judd RM. The use of contrast-enhanced magnetic resonance imaging to identify reversible myocardial dysfunction. N Engl J Med. 2000;343:1445–53. doi: 10.1056/NEJM200011163432003. - DOI - PubMed
    1. Gulati A, Jabbour A, Ismail TF, Guha K, Khwaja J, Raza S, Morarji K, Brown TD, Ismail NA, Dweck MR, Di Pietro E, Roughton M, Wage R, Daryani Y, O’Hanlon R, Sheppard MN, Alpendurada F, Lyon AR, Cook SA, Cowie MR, Assomull RG, Pennell DJ, Prasad SK. Association of fibrosis with mortality and sudden cardiac death in patients with nonischemic dilated cardiomyopathy. JAMA. 2013;309:896–908. doi: 10.1001/jama.2013.1363. - DOI - PubMed
    1. Look DC, Locker DR. Time saving in measurement of NMR and EPR relaxation times. Rev Sci Instrum. 1970;41:250–1. doi: 10.1063/1.1684482. - DOI