. 2017 Feb 2;129(5):619-629.
doi: 10.1182/blood-2016-09-741835. Epub 2016 Nov 29.

Widespread and dynamic translational control of red blood cell development

Affiliations

Widespread and dynamic translational control of red blood cell development

Juan R Alvarez-Dominguez et al. Blood. .

Abstract

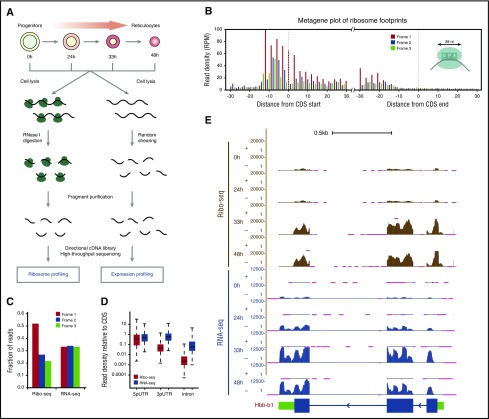
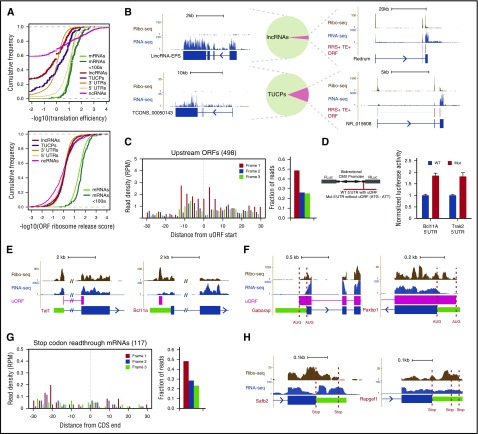
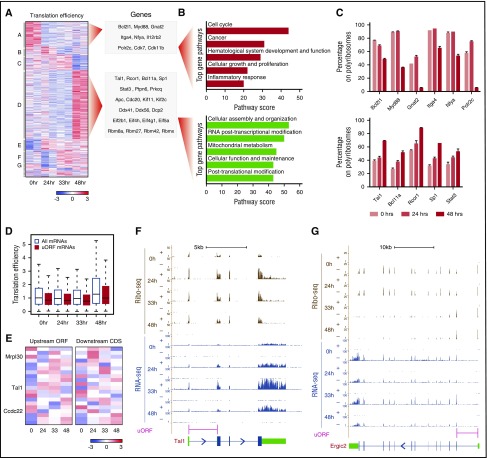
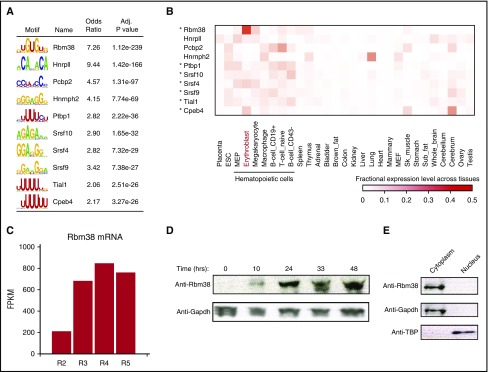
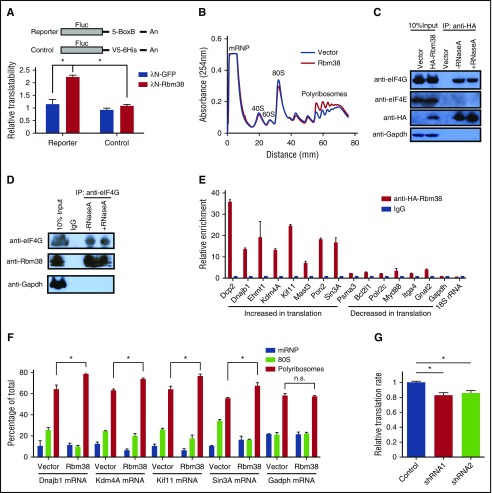
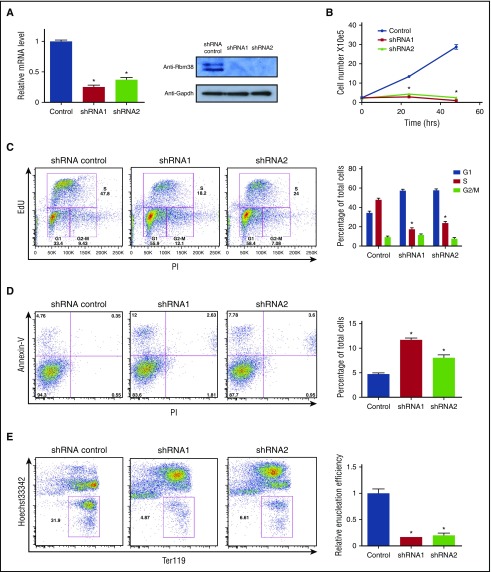
Cell development requires tight yet dynamic control of protein production. Here, we use parallel RNA and ribosome profiling to study translational regulatory dynamics during murine terminal erythropoiesis. Our results uncover pervasive translational control of protein synthesis, with widespread alternative translation initiation and termination, robust discrimination of long noncoding from micropeptide-encoding RNAs, and dynamic use of upstream open reading frames. Further, we identify hundreds of messenger RNAs (mRNAs) whose translation efficiency is dynamically controlled during erythropoiesis and that enrich for target sites of RNA-binding proteins that are specific to hematopoietic cells, thus unraveling potential regulators of erythroid translational programs. A major such program involves enhanced decoding of specific mRNAs that are depleted in terminally differentiating/enucleating cells with decreasing transcriptional capacity. We find that RBM38, an erythroid-specific RNA-binding protein previously implicated in splicing, interacts with the general translation initiation factor eIF4G and promotes translation of a subset of these irreplaceable mRNAs. Inhibition of RBM38 compromises translation in erythroblasts and impairs their maturation, highlighting a key function for this protein during erythropoiesis. These findings thus reveal critical roles for dynamic translational control in supporting specialized mammalian cell formation.


Figures

Figure 1.
Figure 1.
Global translation profiling during red blood cell development. (A) Workflow for parallel ribosome and RNA profiling during erythropoiesis. (B) Ribosome footprints (RFPs) delineate known CDSs. Metagene plot shows the rise and fall in 28-nt RFP density (reads per million mapped reads, RPM) near starts and ends of annotated CDSs, respectively. The 12-nt and 15-nt offsets from starts and ends reflect distances from RFP 5′ termini to the ribosome P- and A-site codons at translation initiation and termination, respectively (see inset). (C) Subcodon resolution of ribosome footprints. Note that 3-nt codon periodicity relative to the known CDS is seen for 28-nt RFPs but not RNA-seq reads. (D) Ribosome footprints are highly specific to coding regions. Boxplots show density of Ribo-seq and RNA-seq reads at UTRs or introns relative to that of the associated CDS. (E) Ribosome and RNA profiling of the locus encoding the β-globin–major chain (Hbb-b1). Tracks display Ribo-seq and RNA-seq signal as density of mapped strand-specific reads. The gene model with CDS (blue) and UTR (green) regions is shown at the bottom. Kb, kilobases; RNase I, ribonuclease I.
Figure 2.
Figure 2.
Evidence for RNA translatability, regulatory uORFs, and alternatively translated mRNAs. (A) (Top) The translation efficiency (TE) of lncRNAs and TUCPs distinguishes their translatability from that of 5′UTRs or CDSs of any size. (Bottom) The ribosome release score (RRS) across all possible ORFs separates lncRNAs and TUCPs from translated CDSs of any size. (B) Most erythroid lncRNAs and TUCPs show no evidence of translation. An empirical criterion for productive translation (supplemental Methods) classifies most lncRNAs and TUCPS, such as lincRNA-EPS and TCONS_00050143 (left panels), as noncoding. Others, such as Redrum and NR_015608 (right panels), are predicted to possess translated ORFs (depicted in red). (C) Translation of 5′UTR initiating ORFs. RFPs delineate the starts of high-confidence uORFs and exhibit 3-nt codon periodicity, evidencing their translation. (D) Validation of regulatory uORFs. Transient reporter assays (left, reporter design) evidence uORF-mediated translational control of the Bcl11A and Trak2 mRNAs (right). (E) Examples of uORFs in the Tal1 (left) and Bcl11a (right) mRNAs. (F) Examples of N-terminally extended proteins. Dashed lines mark annotated and upstream start codons. (G) Stop-codon-readthrough mRNA translation. RFPs continuing past known CDSs maintain 3-nt codon periodicity, evidencing readthrough translation. (H) Examples of C-terminally extended proteins, SAFB2 and RAPGEF1 (Rap guanine nucleotide exchange factor 1). Dashed lines mark annotated and next in-frame stop codons. CMV, cytomegalovirus; Fluc, firefly luciferase; Gabarap, GABA(A) receptor–associated protein; Mut, mutant allele; Rluc, Renilla luciferase; WT, wild-type allele.
Figure 3.
Figure 3.
Widespread and dynamic translation efficiency control during erythropoiesis. (A) Translation efficiency of 762 genes differentially regulated (empirical P < .05) during erythropoiesis. Heatmap displays mean row-centered log2 TE values at 0, 24, 33, and 48 hours of ex vivo culture. Letters A through G at the left designate clusters; example genes are listed at the right. (B) Top gene pathways (P < .05, Fisher’s exact test) identified among genes that are translationally downregulated (Cluster A, top panel) or upregulated (Cluster D, bottom panel) during terminal differentiation. (C) Validation of translational repression (top) and activation (bottom) of mRNAs from Clusters A and D during differentiation. (D) Upstream ORFs consistently suppress translation through the stages of erythropoiesis. (E) Translation efficiency of 20 uORF and downstream CDS pairs differentially regulated (empirical P < .05) during erythropoiesis. Heatmaps display mean row-centered log2 TE values. (F-G) Ribosome and RNA profiling of Tal1 (F) and Ergic2 (G). Tal1 is translationally induced with differentiation and has a concordant uORF translation pattern, whereas Ergic2 is repressed and shows an opposite uORF pattern. Gene models with CDS (blue), UTR (green), and uORF (pink) regions are shown at the bottom.
Figure 4.
Figure 4.
Global discovery of erythroid translation regulators. (A) RNA-binding protein motifs enriched within the 3′UTRs of genes translationally regulated during differentiation. The 10 most enriched motifs of erythroid-expressed RBPs are shown along with enrichment statistics (see supplemental Methods). (B) Relative abundance of RBPs from (A) (rows) across 29 primary mouse cell and tissue types profiled by RNA-seq for the ENCODE consortium (columns). Heatmap displays, for each RBP in each cell or tissue type, its fractional expression level out of the total expression across all cell and tissue types examined. Asterisks mark hematopoietic cell–enriched (P < .05, Kolmogorov-Smirnov test) RBPs. (C) Rbm38 is highly induced during terminal erythroid differentiation. Primary differentiating erythroid cells were sorted (R2-R5 fractions) based on cell surface markers, and mRNA expression was quantified as fragments per kilobase of exon per million mapped fragments (FPKM). (D) RBM38 is highly induced during terminal erythropoiesis in ex vivo culture. Primary erythroid precursors were differentiated in culture, and protein levels were examined by western blot analysis at the indicated time points. (E) RBM38 is cytoplasmic. Primary erythroblasts were fractionated into cytoplasmic and nuclear components, and protein levels were measured by western blot. Adj., adjusted; Anti-TBP, antibody to TATA box–binding protein. IgG, immunoglobulin G; RNaseA, ribonuclease A; Sk, skeletal.
Figure 5.
Figure 5.
RBM38 interacts with eIF4G and promotes target mRNA translation. (A) RBM38 can stimulate translation. 3′UTR tethering reporter assays (top, reporter design) provide evidence of the capacity of RBM38 to significantly enhance translation of an intronless reporter. (B) RBM38 overexpression promotes polyribosome formation, as evidenced by polysome profiling. (C-D) Specific and RNA-independent interaction between RBM38 and eIF4G. HA-tagged RBM38 was immunoprecipitated from MEL cells (C), and endogenous eIF4G was immunoprecipitated from primary fetal liver erythroblasts (D). The samples were resolved by SDS-PAGE followed by western blotting for the indicated proteins. (E) Validation of RBM38-mediated translational activation of target mRNAs. Selected mRNAs translationally activated or repressed with differentiation were tested for specific immunoprecipitation by an antibody against HA-RBM38. (F) RBM38 overexpression promotes translation of endogenous mRNA targets. The distribution of target or control mRNAs across a polysome gradient was determined in both the presence and the absence of RBM38 expression. (G) Global translation is compromised in RBM38-depleted erythroblasts. Erythroblasts transduced with different shRNA-expressing retroviruses were pulse-labeled with a methionine analog (HPG) and then subjected to a Click-iT assay to determine its rate of incorporation into polypeptides in TER119+ CD71+ erythroblasts (n = 3). mRNP, messenger ribonucleoprotein. *P < .05, Student t test.
Figure 6.
Figure 6.
RBM38 is required for terminal erythropoiesis. (A) RBM38 knockdown in ex vivo–differentiated erythroblasts. (B) RBM38 inhibition blocks proliferation during terminal erythroid differentiation. Growth curves show the number of live ex vivo–TER119+ CD71+ erythroblasts differentiated erythroid cells treated with Rbm38-targeting or non-targeting shRNAs. (C) RBM38-depleted cells accumulate in the G1 cell cycle phase. Plots show the results of DNA staining with propidium iodide (PI) and with a thymidine analog (EdU) in shRNA-transduced cells. The proportion of cells at each cell cycle phase is shown in the bar graph at the right. (D) Elevated apoptosis of RBM38-depleted cells after 24 hours of ex vivo differentiation. Plots display DNA content (PI staining) versus apoptotic status (annexin-V staining) of shRNA-transduced cells. Apoptotic cell fractions are shown in the bar graph at the right. (E) RBM38 inhibition impairs red cell enucleation. Plots display the level of the differentiation surface marker TER119 (fluorescent immunolabeling) versus DNA content (Hoechst staining) of shRNA-transduced live cells after 48 hours of ex vivo culture. Gates mark enucleated reticulocytes. Relative enucleation efficiencies are shown in the bar graph at the right. *P < .05, Student t test.

Comment in

  • Decoding erythropoiesis.
    Warren AJ. Warren AJ. Blood. 2017 Feb 2;129(5):544-545. doi: 10.1182/blood-2016-12-755538. Blood. 2017. PMID: 28153837 Free PMC article.

References

    1. Kong J, Lasko P. Translational control in cellular and developmental processes. Nat Rev Genet. 2012;13(6):383-394. - PubMed
    1. Baranov PV, Atkins JF, Yordanova MM. Augmented genetic decoding: global, local and temporal alterations of decoding processes and codon meaning. Nat Rev Genet. 2015;16(9):517-529. - PubMed
    1. Namy O, Rousset JP, Napthine S, Brierley I. Reprogrammed genetic decoding in cellular gene expression. Mol Cell. 2004;13(2):157-168. - PubMed
    1. Brar GA, Weissman JS. Ribosome profiling reveals the what, when, where and how of protein synthesis. Nat Rev Mol Cell Biol. 2015;16(11):651-664. - PMC - PubMed
    1. McCann KL, Baserga SJ. Genetics. Mysterious ribosomopathies. Science. 2013;341(6148):849-850. - PMC - PubMed

Publication types

MeSH terms