. 2016 Dec 12;213(13):3007-3024.
doi: 10.1084/jem.20160712. Epub 2016 Nov 29.

Early generated B1 B cells with restricted BCRs become chronic lymphocytic leukemia with continued c-Myc and low Bmf expression

Affiliations

Early generated B1 B cells with restricted BCRs become chronic lymphocytic leukemia with continued c-Myc and low Bmf expression

Kyoko Hayakawa et al. J Exp Med. .

Abstract

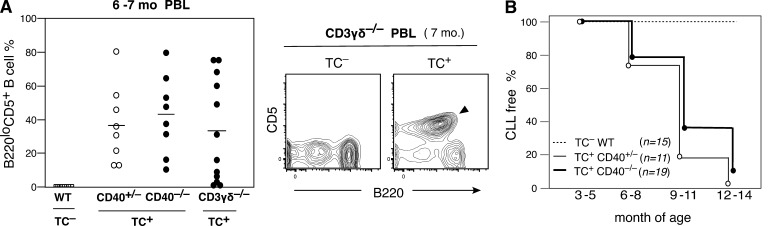
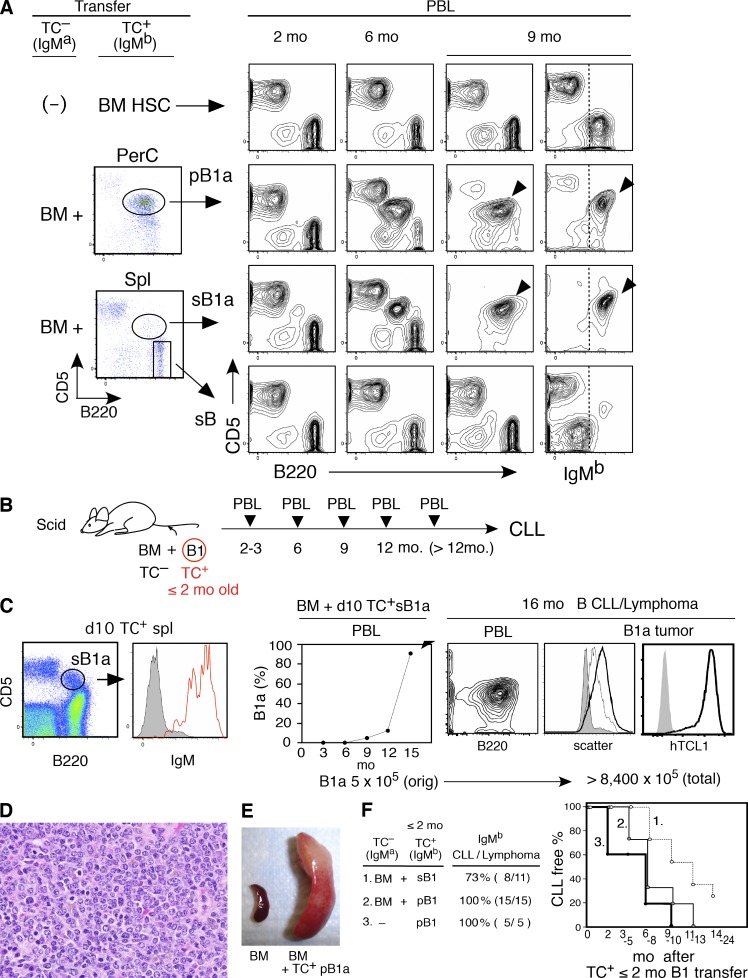
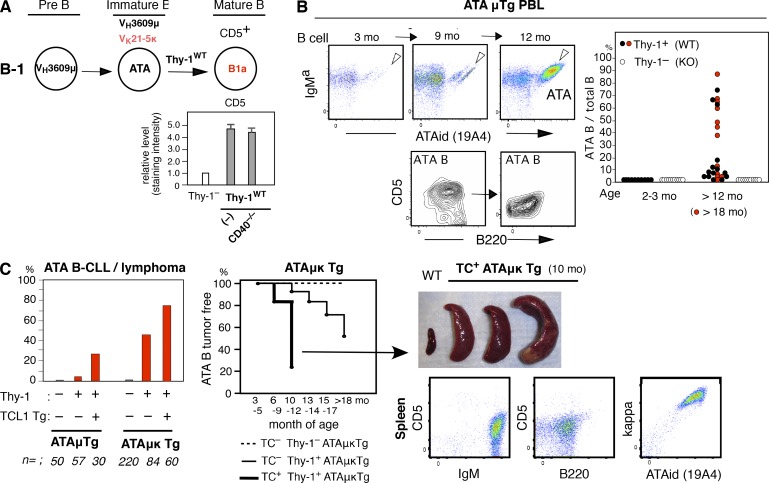
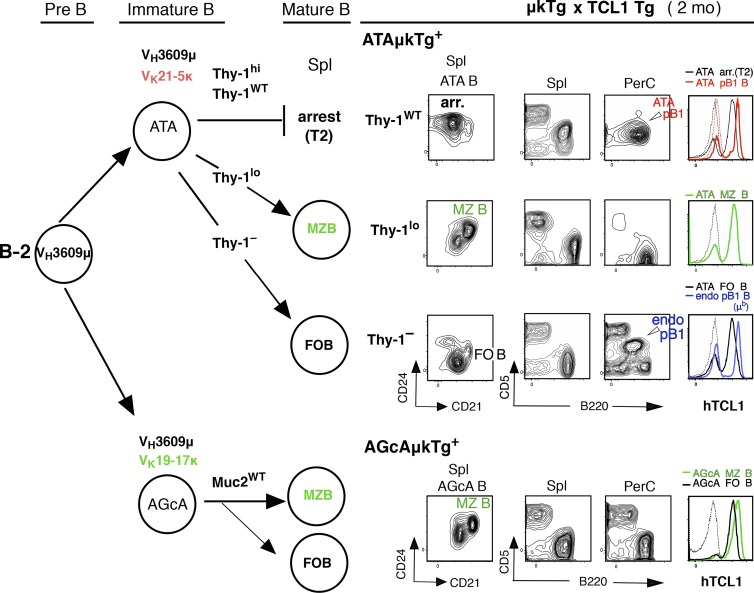
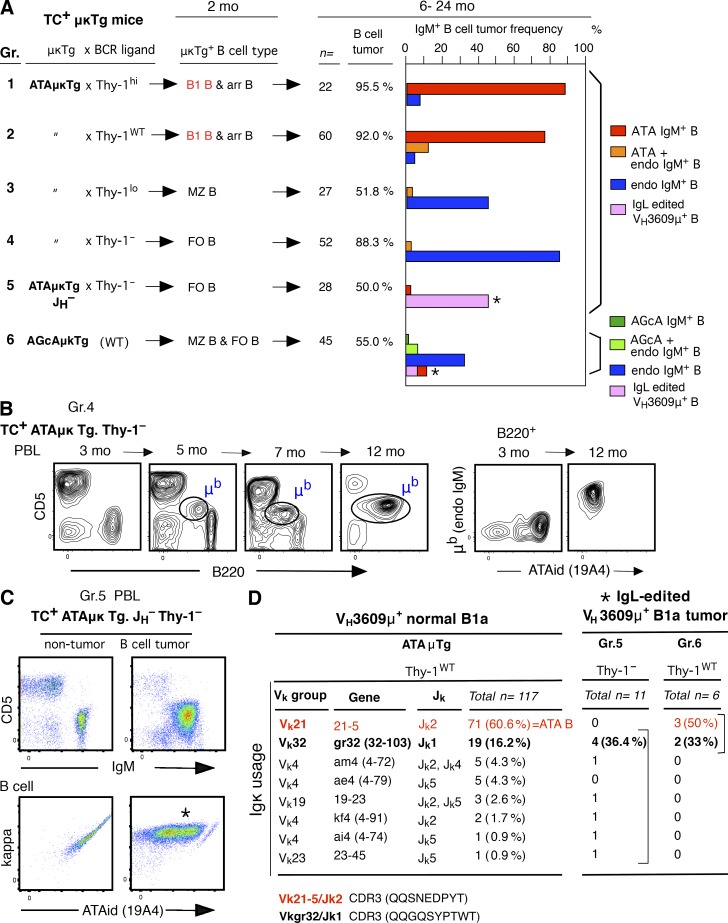
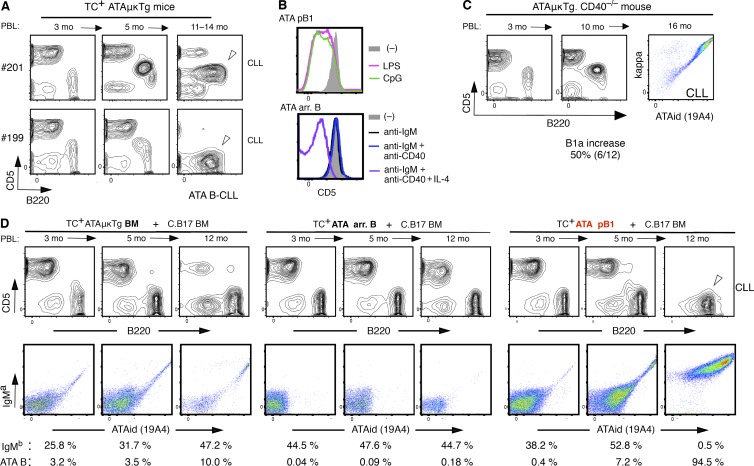
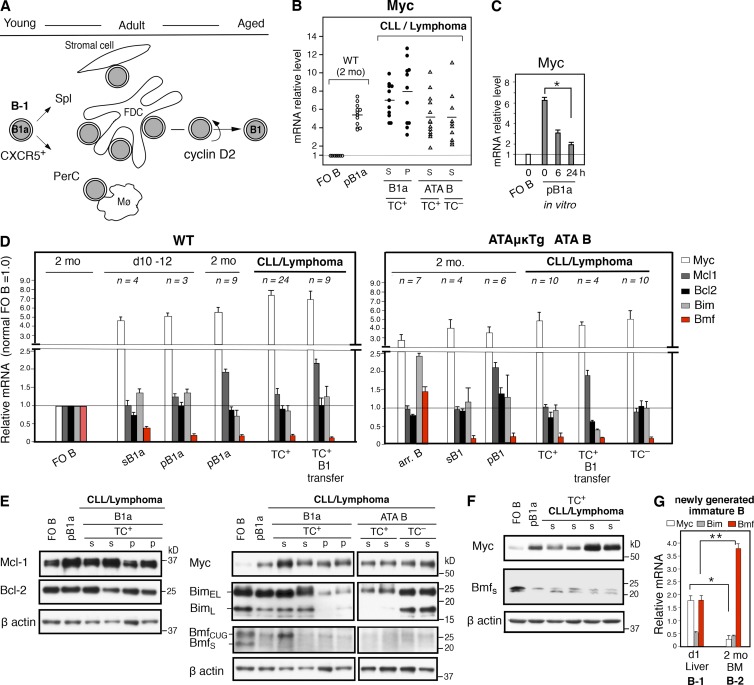
In mice, generation of autoreactive CD5+ B cells occurs as a consequence of BCR signaling induced by (self)-ligand exposure from fetal/neonatal B-1 B cell development. A fraction of these cells self-renew and persist as a minor B1 B cell subset throughout life. Here, we show that transfer of early generated B1 B cells from Eμ-TCL1 transgenic mice resulted in chronic lymphocytic leukemia (CLL) with a biased repertoire, including stereotyped BCRs. Thus, B1 B cells bearing restricted BCRs can become CLL during aging. Increased anti-thymocyte/Thy-1 autoreactive (ATA) BCR cells in the B1 B cell subset by transgenic expression yielded spontaneous ATA B-CLL/lymphoma incidence, enhanced by TCL1 transgenesis. In contrast, ATA B-CLL did not develop from other B cell subsets, even when the identical ATA BCR was expressed on a Thy-1 low/null background. Thus, both a specific BCR and B1 B cell context were important for CLL progression. Neonatal B1 B cells and their CLL progeny in aged mice continued to express moderately up-regulated c-Myc and down-regulated proapoptotic Bmf, unlike most mature B cells in the adult. Thus, there is a genetic predisposition inherent in B-1 development generating restricted BCRs and self-renewal capacity, with both features contributing to potential for progression to CLL.


Figures

Figure 1.
Figure 1.
T cell–independent CLL in Eμ-TCL1 Tg mice. (A) Increase in CD5+B220lo B cell frequency in PBL of both CD40+/− and CD40−/− TC+/− littermates (C.B17 background) and CD3γδ−/− TC+/− mice (C.B17 and C57BL/6 mixed background), compared with WT (C.B17), at 6–7 mo. Mean is indicated by a bar. (right) B220loCD5+ B CLL in a 7-mo-old TC+/−CD3γδ−/− mouse (marked) compared with a TC−/− littermate. (B) Incidence of CLL over time. No strong reduction of CLL incidence occurred in CD40−/− background.
Figure 2.
Figure 2.
CLL development from early generated B-1–derived B cells. (A) Comparison of CLL incidence in C.B17.scid recipients transferred with BM HSC, B1a, and non-B1a B cells purified from 2 mo TC+ C.B17 mice. pB1a and sB1a (each 5 × 10⁵/recipient), and non-B1a spleen B cells (sB; 3 × 10⁶/recipient) were cotransferred with TC BALB/c BM. 2 mo after transfer, PBL showed similar numbers of B and T cells (top, using TC+ HSC alone were all IgMb, others were predominantly IgMa). Increase in B220loCD5+ B cells of IgMb B1a and CLL development are marked. PerC, peritoneal cavity. Representative of six transfer cases using 2–3-mo-old mice. TC+ mice together with TC mice. (B) Cotransfer of purified B1 B cells from ≤2-mo-old TC+C.B17 mice with TC BALB/c BM into C.B17.scid mice, monitoring PBL after transfer. (C) Transfer of B1a cells from 10-d-old TC+/− mice and development of CLL. 106 purified sB1a B cells (5 × 10⁵ TC+) from 12 10-d-old (TC+/− x CB17)F1 mice were transferred together with 5 × 10⁶ TC BM cells into CB.17. mice. (left) Surface IgM expression of sB1a cells. (right) Frequency of B1a cells in PBL of recipient after adoptive transfer (middle). Characteristic mouse CLL CD5+B220+ phenotype and lymphomatous spleen B cells (thick black line) compared with original transferred B1a cells (thin black line and CD5B220+ B cells (gray). Expression of hTCL1 Tg in this CLL is visualized by cytoplasmic staining (gray, second step control). Total leukemia B cell number indicated as a sum of IgMb+ B cells in PBL (2 × 10⁸), spleen (4.6 × 10⁸), and peritoneal cavity (1.8 × 10⁸), as compared with the size of the initial TC+ inoculum. Representative of 15 cases with CLL/lymphoma generation by ≤2-mo-old mice. TC+ B1 B cell transfer. (D) H&E staining of spleen section with CLL/lymphoma of day 10 B1a cell origin. (E) Splenomegaly 8 mo after TC+ pB1a transferred together with TC BM cells, compared with a recipient of TC BM alone. (F) Summary of CLL/lymphoma incidence by purified B1 B cell transfer from ≤2-mo-old TC+ mice.
Figure 3.
Figure 3.
Increased incidence of MBL/CLL/lymphoma in B1 B cells with ATA BCR. (A) Self-Thy-1 antigen-dependent CD5 induction by ATA B cells through B-1 development does not involve CD40 signal. Comparative CD5 level by mature (AA4) ATA B cells (ATAid+) in PerC in 2-mo-old ATAμκTg mice in Thy-1−/− versus WT (Thy-1+/+) and CD40−/− (n = 5; mean ± SE). (B) Increased ATA B cell frequency in PBL B cells in aging ATAμTg mice. (left) ATA B increased case (marked) as MBL at 12 mo, with further B220 reduction. CD5 reduction also occurred in around half the cases of increased ATA B cells. (C) ATA B-CLL/lymphoma incidence in ATAμTg and ATAμκTg mice with or without TCL1 Tg (left). Incidence over time by ATA μκTg mice (middle). (right) Splenomegaly by TC+ATAμκTg mice (>90% cases) together with CLL (top), and representative total spleen cell data analysis (bottom).
Figure 4.
Figure 4.
hTCL1 expression by all B cell subsets. (left) Summary of generation of different B cell subsets in spleen through B-2 development from BM; ATA B cell subset generation in ATAμκTg mice by different levels of self-Thy-1 antigen exposure, and AGcA B cell subsets (dominantly autoreactive to mucin 2) in AGcAμκTg mice, expressing different light chain from ATA BCR. (right) 2-mo-old TC+ ATAμκTg (with different Thy-1 levels) and AGcAμκTg mice. CD21/CD24 staining of ATA B or AGcA B cells in spleen (both constituting the dominant B cells among total B cells) to show arrested, MZ B, or FO B dominance, and B220/CD5 staining of total (lymphocyte) spleen and PerC. AA4 (CD93) and CD23 staining was also included to confirm each subset. Marked cell subsets for cytoplasmic hTCL1 staining analysis. CD21hiCD24med; MZ B, CD21medCD24lo; FO B. Thin dotted lines in hTCL1 staining are the data from TC μκTg+ littermates as controls. Representative data of two to three samples each.
Figure 5.
Figure 5.
CLL/lymphoma incidence predominantly arises from B1 B cells. (A) Summary of IgM+ B cell tumor (CLL/lymphoma) incidence and frequency of tumor IgM with either original μκTg BCR, endogenous IgM (IgMb), or IgMb coexpressed with original μκTg BCR. In ATAμκTg.JH Thy-1, also in AGcA μκTg mice, IgL edited B cell tumor occurred together with original VH3609μ IgH expression (*). (B) Representative case of endogenous IgM (IgMb) increase as B220loCD5+ B cells in PBL of TC+ATAμκTg.Thy-1 mice (Gr. 4). As shown on right, original B220+CD5 cells at 3 mo in PBL were circulating FO B cells with IgMa+ ATA BCR, which did not develop B cell tumor. (C) TC+ATAμκTg.JHThy-1 mouse PBL at the same 14 mo, without or with B cell tumor development. The edited IgL by this tumor B cells (*) was Vk19-23, together with VH3609μ IgH. (D) Edited IgL in VH3609μ+ B tumors resemble normal mouse VH3609μ+ B1a Igκ. (left) Igκ single-cell sequence data by VH3609μ+ B cells (VH3609id)+kappa+ in 2–3-mo-old ATAμTg mouse pB1a. Summary of data from four mice (107 shown of the total 117 κ listed). (right) Igκ list of IgL-edited VH3609μ+ B1a (CD5+) tumors. 9/11 of Gr5 and 5/6 of Gr 6 edited Igκ were similar to normal mouse VH3609μ+ B1a, including identical CDR3 use by Vκ21/Jκ2 and Vκ32/Jκ1, the most frequently expressed by VH3609μ+ B1a (CDR3 amino acids are shown).
Figure 6.
Figure 6.
ATA B-CLL generation from mature B1 B cells than arrested B cells. (A) CD5 down-regulation occurrance at CLL stage in TC+ATAμκTg mice. CD5+ and CD5 CLL (marked) found in two littermates, both with splenomegaly. CD5 down-regulation also occurred in TC ATA B cells as shown in Fig. 3 B. (B) 3 d after stimulation of ATA B cells in peritoneal cavity (pB1) and arrested B cells in spleen of ATAμκTg mice. Cell proliferation by LPS and CpG with CD5 down-regulation. Increased viability and proliferation by anti-IgM + anti-CD40 + IL-4 stimulation by arrested ATA B cells. Similar outcome by two experiments. (C) Data from one representative mouse with spontaneous CLL generation in ATAμκTg.CD40−/− mice (6/12 cases). (D) Cotransfer of HSC enriched BM, arrested ATA B in spleen (arr. B), or ATA B in PerC (pB1) from TC+ATAμκTg (IgMa) mice, together with C.B17 mouse BM. Percentage of C.B17-derived B cells (IgMb) and ATA B in PBL are shown. ATA B-CLL generated by pB1 transfer is marked. Representative of five recipients each.
Figure 7.
Figure 7.
Continued up-regulated c-Myc and down-regulated Bmf by B1 B cells to become CLL. (A) CXCR5 up-regulated B1a cell migration, interaction, and renewal/maintenance from young to aged, with cyclin D2 dependence. (B) Myc mRNA levels by B1 B cells at normal and tumor stage, including TC ATA B cell tumors, relative to FO B cells. Mean percentages indicated in lines. S, spleen; p, peritoneal cavity. (C) Reduction of Myc mRNA by normal mouse (C.B17) B1a during 24-h culture. After plating in a 96-well U-plate for culture (with 10% FCS), the immediately harvested samples before 37°C incubation was defined as 0 h. FO B Myc mRNA levels were similar before and after culture (as 1.0). n = 4; mean ± SE; *, P = 0.0007. (D) Myc, Mcl-1, Bcl-2, Bim, and Bmf mRNA levels by B1 B cells at TC nontumor and TC+ (and TC) tumor stage relative to 2-mo-old FO B cells. (left) WT (C.B17 mice). (right) ATA B cells in ATAμκTg mice, including arrested ATA B cells in spleen. Values are mean ± SE. (E) Western blot of samples of FO B and pB1a cells in 2-mo-old WT mice together with TC+ CLL/lymphomas stained for Myc, Mcl-1, Bcl-2, Bim, Bmf, and β-actin. Another set of WT/ATA B cell tumors was assembled to compare Myc, Bim, Bmf, and β-actin. WT FO B and pB1a sample data were similar to WT data on left (not depicted). Representative data of two to three experiments. (F) Western blot using rabbit anti-Bmf, in comparison with Myc. (G) Myc, Bim, and Bmf mRNA levels in immature B cells (CD19+B220+AA4+IgM+IgD) in day 1 liver and 2 mo BM. 2-mo-old spleen FO B cells in 1.0. C.B17 mouse. n = 4; mean ± SE; *, P = 0.016; **, P = 0.001.

References

    1. Ansel K.M., Harris R.B., and Cyster J.G.. 2002. CXCL13 is required for B1 cell homing, natural antibody production, and body cavity immunity. Immunity. 16:67–76. 10.1016/S1074-7613(01)00257-6 - DOI - PubMed
    1. Bichi R., Shinton S.A., Martin E.S., Koval A., Calin G.A., Cesari R., Russo G., Hardy R.R., and Croce C.M.. 2002. Human chronic lymphocytic leukemia modeled in mouse by targeted TCL1 expression. Proc. Natl. Acad. Sci. USA. 99:6955–6960. 10.1073/pnas.102181599 - DOI - PMC - PubMed
    1. Bouillet P., Metcalf D., Huang D.C., Tarlinton D.M., Kay T.W., Köntgen F., Adams J.M., and Strasser A.. 1999. Proapoptotic Bcl-2 relative Bim required for certain apoptotic responses, leukocyte homeostasis, and to preclude autoimmunity. Science. 286:1735–1738. 10.1126/science.286.5445.1735 - DOI - PubMed
    1. Bouillet P., Purton J.F., Godfrey D.I., Zhang L.C., Coultas L., Puthalakath H., Pellegrini M., Cory S., Adams J.M., and Strasser A.. 2002. BH3-only Bcl-2 family member Bim is required for apoptosis of autoreactive thymocytes. Nature. 415:922–926. 10.1038/415922a - DOI - PubMed
    1. Bürkle A., Niedermeier M., Schmitt-Gräff A., Wierda W.G., Keating M.J., and Burger J.A.. 2007. Overexpression of the CXCR5 chemokine receptor, and its ligand, CXCL13 in B-cell chronic lymphocytic leukemia. Blood. 110:3316–3325. 10.1182/blood-2007-05-089409 - DOI - PubMed

Publication types

MeSH terms

Substances