. 2017 Jan 9;45(1):39-53.
doi: 10.1093/nar/gkw1002. Epub 2016 Nov 28.

Alignment-free $d_2^*$ oligonucleotide frequency dissimilarity measure improves prediction of hosts from metagenomically-derived viral sequences

Affiliations

Alignment-free $d_2^*$ oligonucleotide frequency dissimilarity measure improves prediction of hosts from metagenomically-derived viral sequences

Nathan A Ahlgren et al. Nucleic Acids Res. .

Abstract

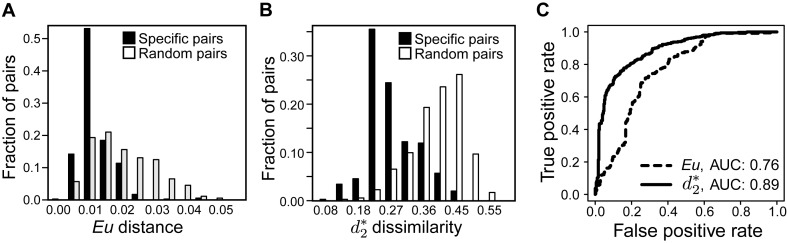
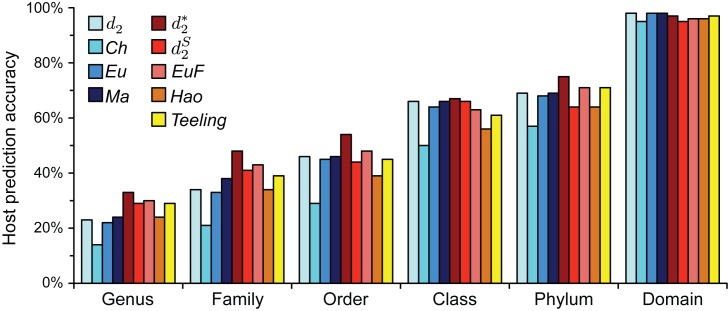
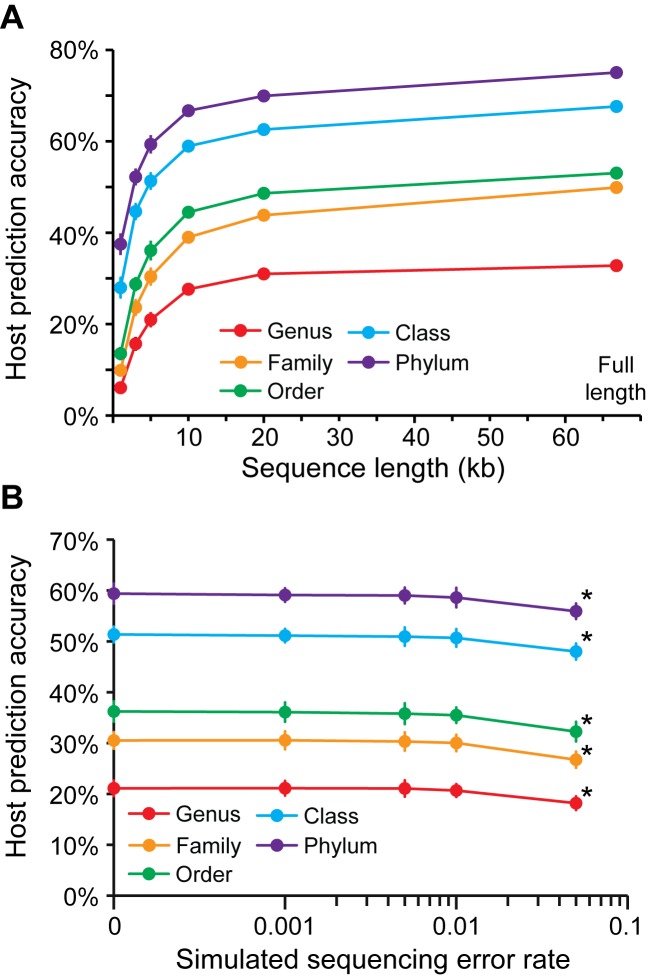
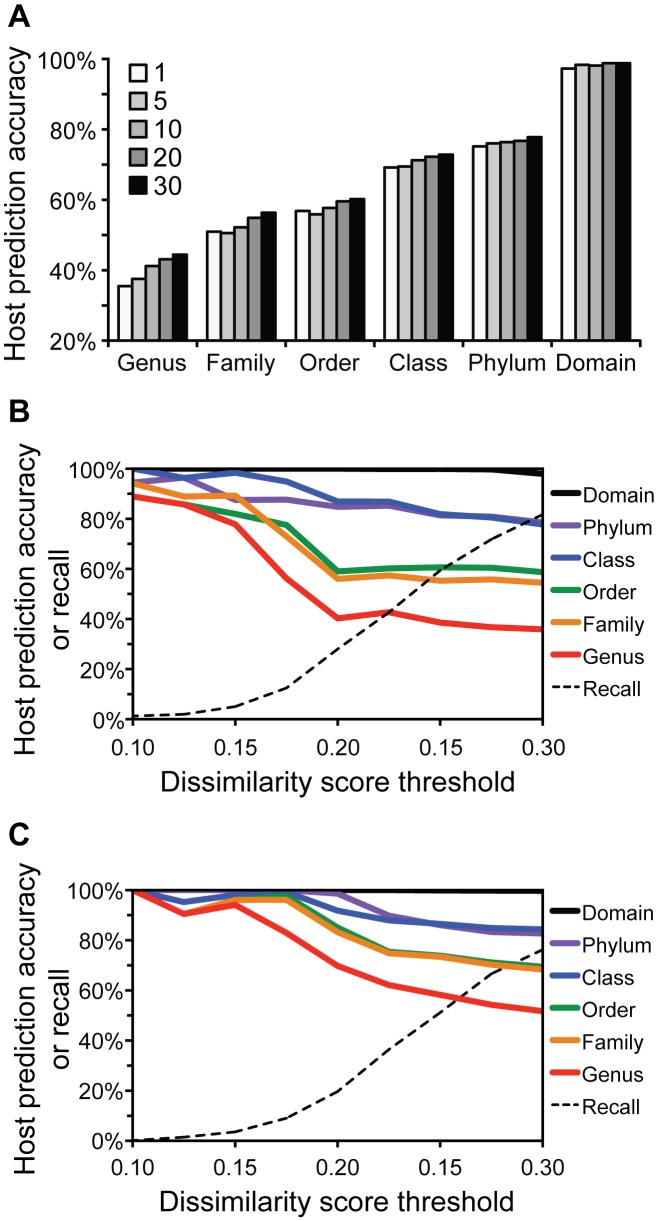
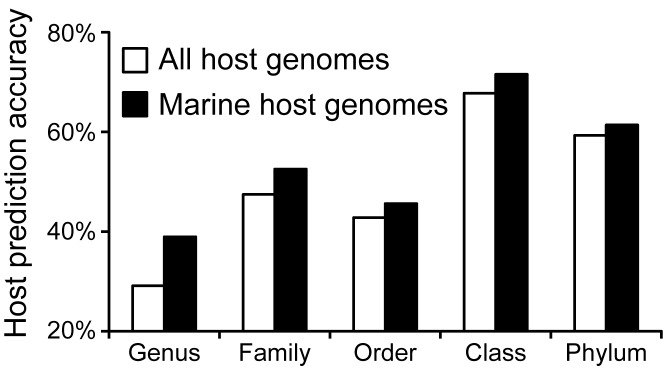
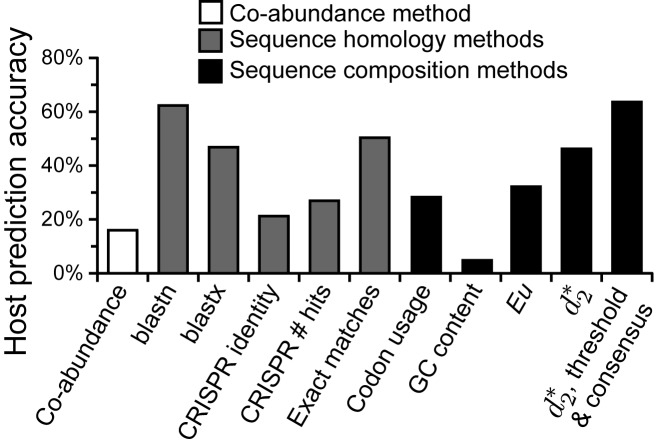
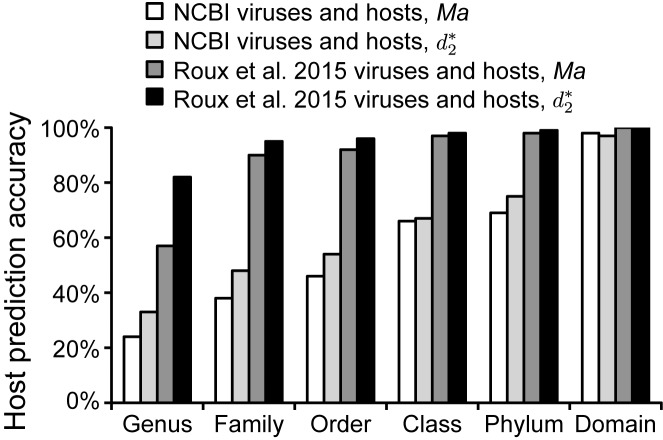
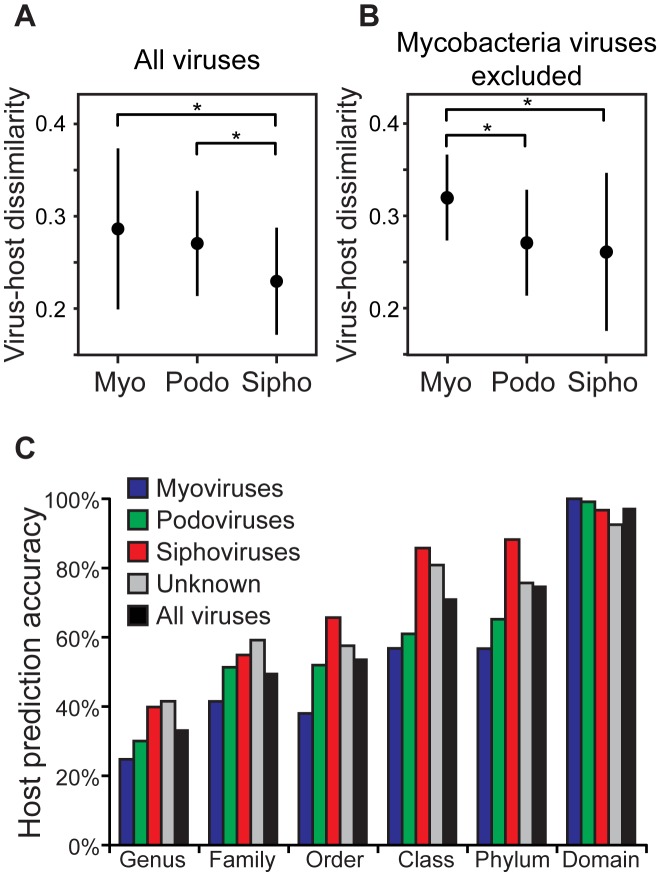
Viruses and their host genomes often share similar oligonucleotide frequency (ONF) patterns, which can be used to predict the host of a given virus by finding the host with the greatest ONF similarity. We comprehensively compared 11 ONF metrics using several k-mer lengths for predicting host taxonomy from among ∼32 000 prokaryotic genomes for 1427 virus isolate genomes whose true hosts are known. The background-subtracting measure [Formula: see text] at k = 6 gave the highest host prediction accuracy (33%, genus level) with reasonable computational times. Requiring a maximum dissimilarity score for making predictions (thresholding) and taking the consensus of the 30 most similar hosts further improved accuracy. Using a previous dataset of 820 bacteriophage and 2699 bacterial genomes, [Formula: see text] host prediction accuracies with thresholding and consensus methods (genus-level: 64%) exceeded previous Euclidian distance ONF (32%) or homology-based (22-62%) methods. When applied to metagenomically-assembled marine SUP05 viruses and the human gut virus crAssphage, [Formula: see text]-based predictions overlapped (i.e. some same, some different) with the previously inferred hosts of these viruses. The extent of overlap improved when only using host genomes or metagenomic contigs from the same habitat or samples as the query viruses. The [Formula: see text] ONF method will greatly improve the characterization of novel, metagenomic viruses.


Figures

Figure 1.
Figure 1.
Distributions of virus-host distances/dissimilarities and ROC curves for the Eu and formula image measures for k-mer length 6. (A and B) Virus-host distances/dissimilarities for 352 complete RefSeq virus genomes and the respective genomes of the host strains on which they were isolated (specific pairs) or 352 randomly selected pairs of the 352 RefSeq viruses and hosts (random pairs). Note that decreasing Eu distances and formula image dissimilarities indicate greater virus-host similarity. (C) ROC curves and the corresponding area under the curve (AUC) for the Eu and formula image measures. A true positive is when the virus-host pair with the lowest distance/dissimilarity predicts the true host on which the virus was isolated. (ROC curves for all measures and k-mer lengths 4, 6 and 9 are shown in Supplementary Figure S2).
Figure 2.
Figure 2.
Prediction accuracy using ONF with various distance/dissimilarity measures at k-mer length 6 on a benchmark dataset of 1427 complete viral RefSeq genomes whose hosts are known versus ∼32,000 possible archaea and bacteria host genomes. Predictions were made for all 1427 viruses (no dissimilarity threshold was applied, see below).
Figure 3.
Figure 3.
The dependence of host prediction accuracy on the length of the query viral sequence (A) and with simulated sequencing error (B). (A) Each of the 1427 complete NCBI virus genomes were randomly subsampled 30 times for several lengths. Hosts were predicted on each subsampling replicate from among ∼32 000 as the one with the lowest formula image dissimilarity score (k = 6). Points depict the average of the resulting accuracies for the 1427 viruses at each taxonomic level and subsampling length. The error bars depict the 95% confidence intervals. The data points for prediction accuracies using the full length viral genomes were plotted at 66.8 kb, the mean length of the 1427 viruses (standard deviation: 54 kb). (B) Query viruses were sampled at 5 kb as above (n = 30), random sequencing error was simulated for these contigs at several error rates, and predictions were made on these viral contigs. Points represent the average prediction accuracy for all replicate contigs and error bars depict 95% confidence intervals two times the standard deviation. Only at an error rate of 0.05 were the prediction accuracies significantly different (P < 0.05, indicated with ‘*’) than no simulation of sequencing error (rate = 0). No thresholds were applied and predictions were made for all viruses.
Figure 4.
Figure 4.
Approaches for increasing host prediction accuracy in application of the formula image measure (k-mer length 6). (A) Prediction accuracy when using the most similar host (n = 1) or a consensus method whereby the predicted host is the most frequent taxon among the n hosts with the lowest dissimilarity scores to the query virus (n = 5, 10, 20, 30). (B) Host prediction accuracy when requiring that for a prediction to be made, the host with the lowest dissimilarity score not exceed a given threshold. (C) Host prediction when applying the consensus rule for n = 30 as in A and imposing thresholding as in B). Dissimilarities were computed using the measure, k-mer length 6 on 1427 RefSeq viruses and the ∼32 000 possible bacterial and archaeal host genomes. The dashed line depicts the fraction of viruses for which predictions were made given the threshold requirement (recall).
Figure 5.
Figure 5.
Comparison of host taxonomy prediction for 285 marine viruses when using all host genomes (n = 31 986) or only marine host genomes (n = 3277) using the measure formula image (k-mer length 6). No dissimilarity threshold was applied and predictions were made for all 285 viruses.
Figure 6.
Figure 6.
Comparison of genus level host prediction on 820 complete RefSeq virusesand 2,699 complete bacterial host genomes using different types of methods: co-abundance method (white bar); homology searches of viruses to host genomes (grey bars); and sequence composition methods (black bars), including codon, usage, virus-host similarity methods using Eu and formula image oligonucleotide similarity measures (k-mer length 6). All results except formula image results are as reported in Edwards et al. 2015. Results using the formula image method are shown when selecting the most similar host and when requiring a score threshold of ≤ 0.25 and taking the consensus of the top five most similar hosts. The fraction of viruses for which predictions could be made with this threshold requirement was 49%.
Figure 7.
Figure 7.
Comparison of host prediction accuracy using the similarity measures formula image and Ma (k-mer length 6) on 1427 viral isolate genomes and ∼32 000 host genomes from NCBI (NCBI viruses and hosts) or the Roux et al. 2015 dataset of 12 498 viruses recovered from 14 977 host genome sequencing projects using VirSorter (Roux et al. viruses and hosts). Predictions were made for all viruses (no dissimilarity threshold was applied).
Figure 8.
Figure 8.
Differences in virus-host dissimilarities and prediction accuracy between the three major groups within Caudoviruses: myoviruses (Myo), podoviruses (Podo) and siphoviruses (Sipho) using the measure formula image (k-mer length 6). (A) Virus-host dissimilarities for all caudoviruses (n = 332) in the 352 virus dataset and their respective hosts. (B) Because the taxonomy of the hosts on which these viruses were isolated is dominated by myoviruses infecting a single mycobacterium strain, results were also shown when excluding those mycobacterium viruses. In A and B, horizontal bars represent median values, boxes outline first and third quartiles, and whiskers depict 95% confidence intervals. Brackets indicate which distributions are significantly different (t-test, P < 0.001). (C) Host prediction accuracies for 1427 RefSeq virus genomes with ∼32 000 possible subject host genomes using formula image and k-mer length 6. Results shown for all viruses; only myoviruses, podoviruses or siphoviruses; and for viruses for which their taxonomy is not reported (n = 109). Predictions were made for all viruses (no dissimilarity threshold was applied).

Similar articles

Cited by

References

    1. Rappé M.S., Giovannoni S.J. The uncultured microbial majority. Annu. Rev. Microbiol. 2003;57:369–394. - PubMed
    1. Breitbart M., Rohwer F. Here a virus, there a virus, everywhere the same virus. Trends Microbiol. 2005;13:278–284. - PubMed
    1. Fuhrman J.A. Marine viruses and their biogeochemical and ecological effects. Nature. 1999;399:541–548. - PubMed
    1. Wommack K.E., Colwell R.R. Virioplankton: Viruses in aquatic ecosystems. Microbiol. Mol. Biol. Rev. 2000;64:69–114. - PMC - PubMed
    1. Weinbauer M.G. Ecology of prokaryotic viruses. FEMS Microbiol. Rev. 2004;28:127–181. - PubMed

Publication types

Substances