

Microarray analysis of differentially-expressed genes and linker genes associated with the molecular mechanism of colorectal cancer
- PMID: 27899990
- PMCID: PMC5103929
- DOI: 10.3892/ol.2016.5122
Microarray analysis of differentially-expressed genes and linker genes associated with the molecular mechanism of colorectal cancer
Abstract
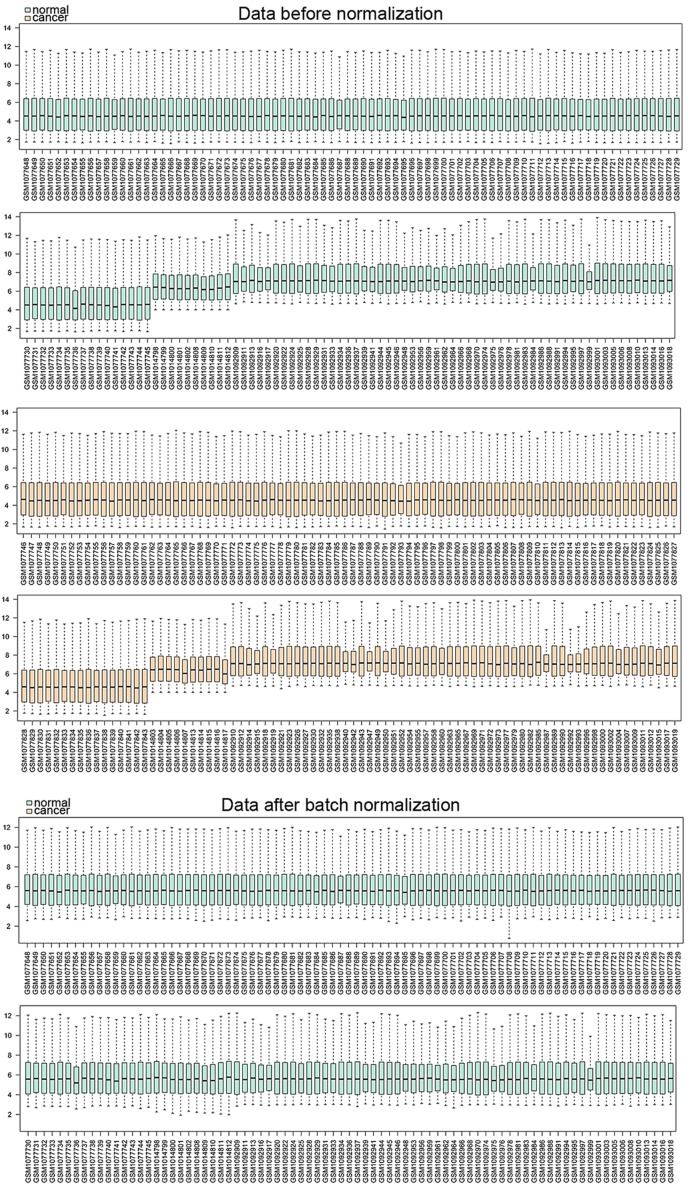
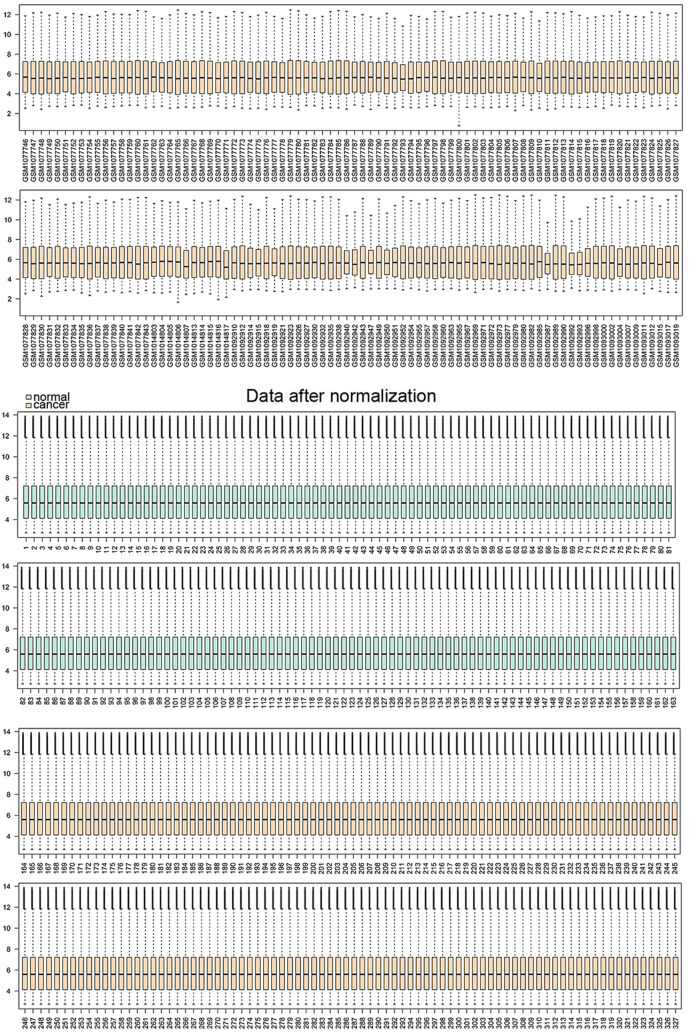
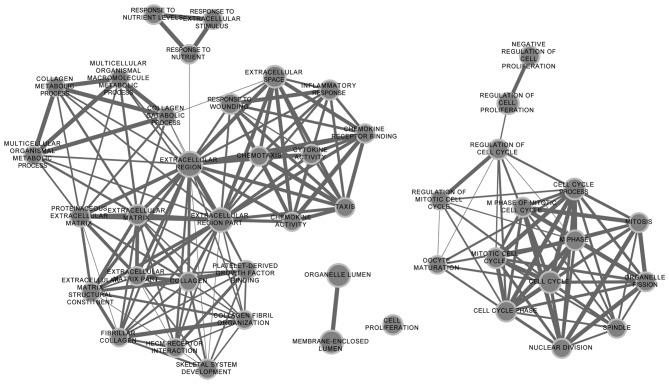
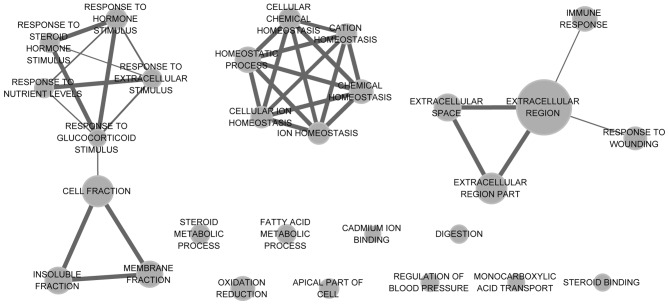
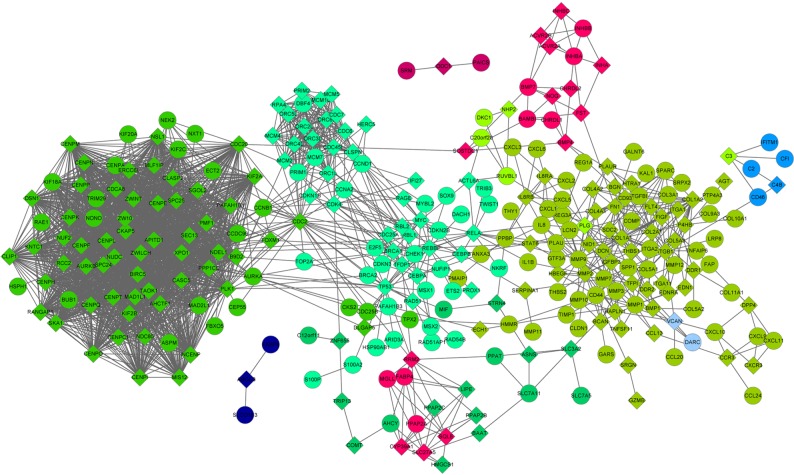
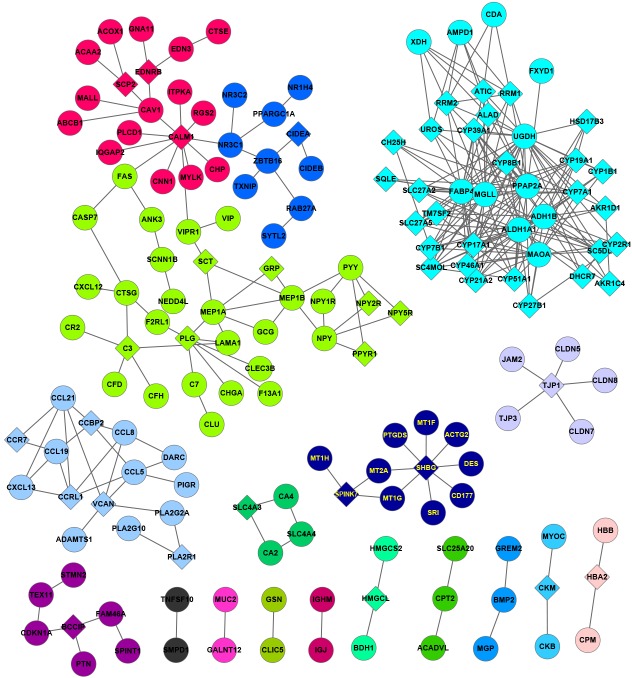
Colorectal cancer (CRC) is one of the most prevalent malignancies worldwide and remains the third leading cause of cancer-associated mortality. The present study aimed to fully elucidate the pathogenesis of CRC and identify associated genes in tumor development. Microarray GSE44076, GSE41328 and GSE44861 datasets were downloaded from the Gene Expression Omnibus database and integrated with meta-analysis. Differentially-expressed genes (DEGs) were identified from CRC samples compared with adjacent non-cancerous controls using the Limma package in R, followed by functional analysis using the Database for Annotation, Visualization, and Integrated Discovery online tool. A protein-protein interaction (PPI) network of DEGs and linker genes was constructed using NetBox software and modules were also mined. Functional annotation was performed for modules with a maximum number of nodes. Subsequent to meta-analysis to pool the data, one dataset that included 327 samples involved in 11,081 genes was obtained. A total of 697 DEGs were identified between CRC samples and adjacent non-cancerous controls. In the PPI network, modules 1 and 5 contained the maximum number of nodes. Collagen, type I, α1 (COL1A1), COL1A2 and matrix metallopeptidase 9 (MMP9) in module 1 and UDP-glucose 6-dehydrogenase (UGDH), aldehyde dehydrogenase 1 family, member A1 (ALDH1A1), fatty acid binding protein 4 (FABP4) and monoglyceride lipase (MGLL) in module 5 exhibited a high degree of connectivity. Functional analysis indicated that the genes in module 1 were involved in extracellular matrix (ECM)-associated functions and that the genes in module 5 were involved in metabolism-related functions. Overall, significant DEGs and linker genes, namely COL1A1, COL1A2, MMP9, UGDH, ALDH1A1, FABP4 and MGLL, play a crucial role in the development of CRC via regulating the ECM and cell metabolism.
Keywords: colorectal cancer; linker gene; module; protein-protein interaction.
Figures
Similar articles
-
Identification of key genes for predicting colorectal cancer prognosis by integrated bioinformatics analysis.Oncol Lett. 2020 Jan;19(1):388-398. doi: 10.3892/ol.2019.11068. Epub 2019 Nov 7. Oncol Lett. 2020. PMID: 31897151 Free PMC article.
-
Identifying the key genes and microRNAs in colorectal cancer liver metastasis by bioinformatics analysis and in vitro experiments.Oncol Rep. 2019 Jan;41(1):279-291. doi: 10.3892/or.2018.6840. Epub 2018 Nov 1. Oncol Rep. 2019. PMID: 30542696 Free PMC article.
-
Identification of key genes in colorectal cancer using random walk with restart.Mol Med Rep. 2017 Feb;15(2):867-872. doi: 10.3892/mmr.2016.6058. Epub 2016 Dec 19. Mol Med Rep. 2017. PMID: 28000901
-
Exploration of estrogen receptor-associated hub genes and potential molecular mechanisms in non-smoking females with lung adenocarcinoma using integrated bioinformatics analysis.Oncol Lett. 2019 Nov;18(5):4605-4612. doi: 10.3892/ol.2019.10845. Epub 2019 Sep 10. Oncol Lett. 2019. PMID: 31611968 Free PMC article.
-
Integrated regulatory mechanisms of miRNAs and targeted genes involved in colorectal cancer.Int J Clin Exp Pathol. 2015 Jan 1;8(1):517-29. eCollection 2015. Int J Clin Exp Pathol. 2015. PMID: 25755742 Free PMC article.
Cited by
-
High expression of FABP4 and FABP6 in patients with colorectal cancer.World J Surg Oncol. 2019 Oct 24;17(1):171. doi: 10.1186/s12957-019-1714-5. World J Surg Oncol. 2019. PMID: 31651326 Free PMC article.
-
Analysis of long non-coding RNA expression profiles in ovarian cancer.Oncol Lett. 2017 Aug;14(2):1526-1530. doi: 10.3892/ol.2017.6283. Epub 2017 May 31. Oncol Lett. 2017. PMID: 28789375 Free PMC article.
-
Identification and evaluation of metabolic mRNAs and key miRNAs in colorectal cancer liver metastasis.Cancer Cell Int. 2025 Jul 16;25(1):265. doi: 10.1186/s12935-025-03903-x. Cancer Cell Int. 2025. PMID: 40671011 Free PMC article.
-
Identification and Interaction Analysis of Molecular Markers in Colorectal Cancer by Integrated Bioinformatics Analysis.Med Sci Monit. 2018 Aug 31;24:6059-6069. doi: 10.12659/MSM.910106. Med Sci Monit. 2018. PMID: 30168505 Free PMC article.
-
Upregulation of ALDH1B1 promotes tumor progression in osteosarcoma.Oncotarget. 2017 Dec 20;9(2):2502-2514. doi: 10.18632/oncotarget.23506. eCollection 2018 Jan 5. Oncotarget. 2017. PMID: 29416787 Free PMC article.
References
LinkOut - more resources
Full Text Sources
Other Literature Sources
Research Materials
Miscellaneous