. 2016 Oct 13;5(12):1162-1174.
doi: 10.1016/j.molmet.2016.10.001. eCollection 2016 Dec.

Dietary fat and gut microbiota interactions determine diet-induced obesity in mice

Affiliations

Dietary fat and gut microbiota interactions determine diet-induced obesity in mice

Raphaela Kübeck et al. Mol Metab. .

Abstract

Objective: Gut microbiota may promote positive energy balance; however, germfree mice can be either resistant or susceptible to diet-induced obesity (DIO) depending on the type of dietary intervention. We here sought to identify the dietary constituents that determine the susceptibility to body fat accretion in germfree (GF) mice.

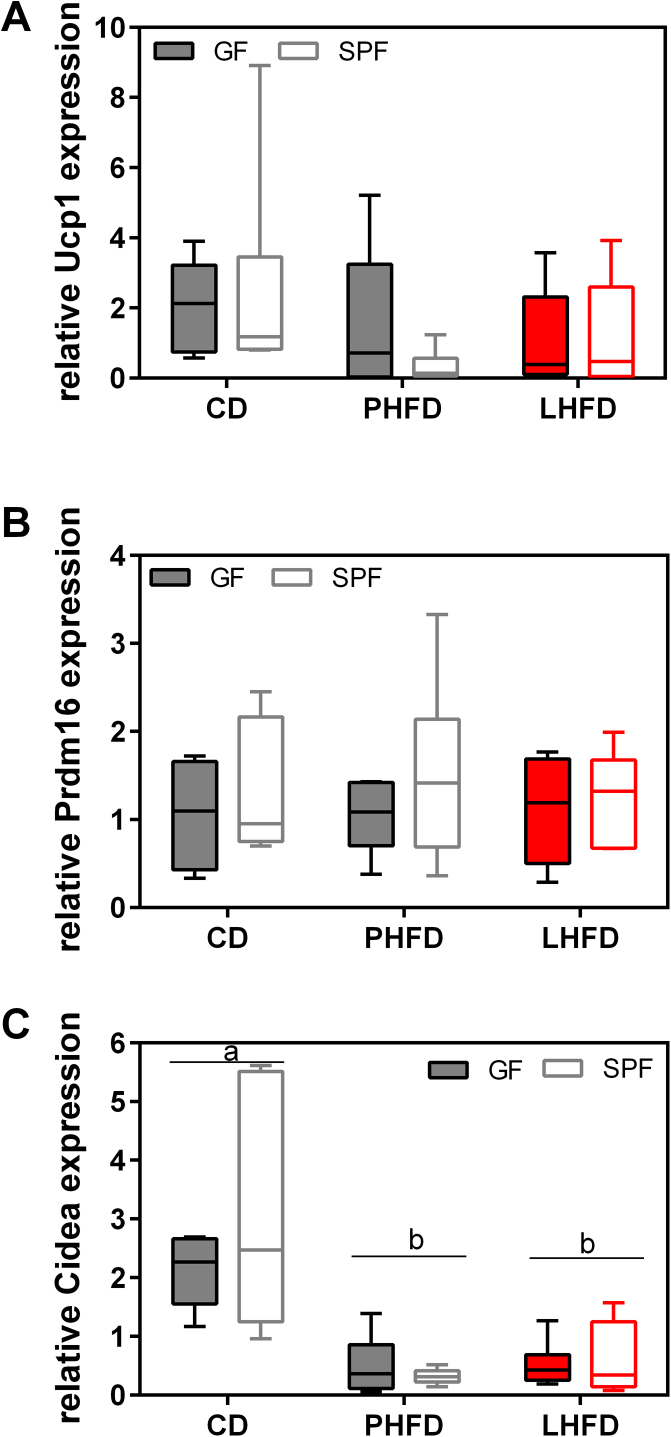
Methods: GF and specific pathogen free (SPF) male C57BL/6N mice were fed high-fat diets either based on lard or palm oil for 4 wks. Mice were metabolically characterized at the end of the feeding trial. FT-ICR-MS and UPLC-TOF-MS were used for cecal as well as hepatic metabolite profiling and cecal bile acids quantification, respectively. Hepatic gene expression was examined by qRT-PCR and cecal gut microbiota of SPF mice was analyzed by high-throughput 16S rRNA gene sequencing.

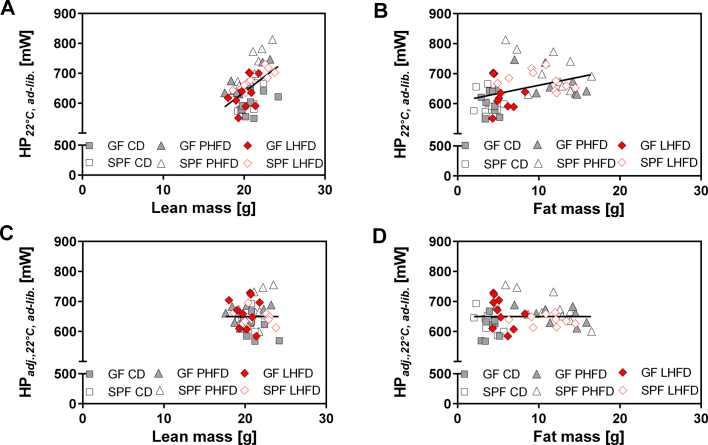
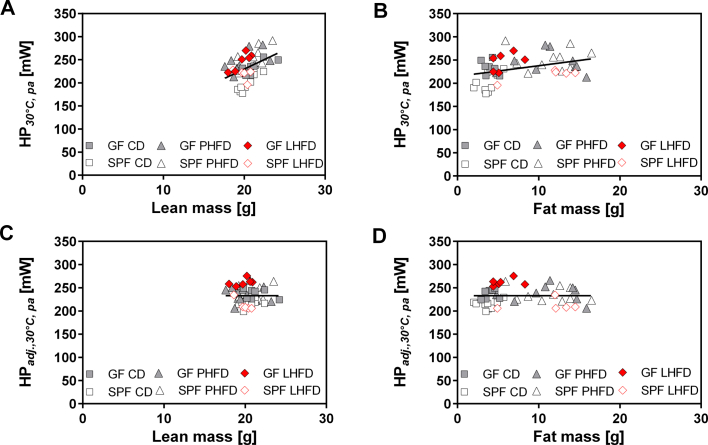
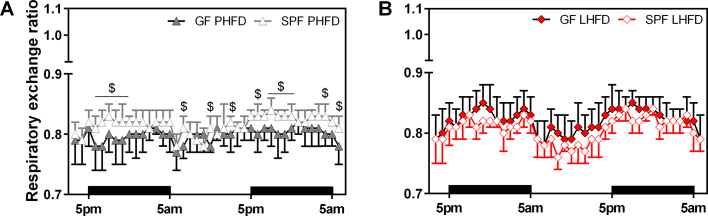
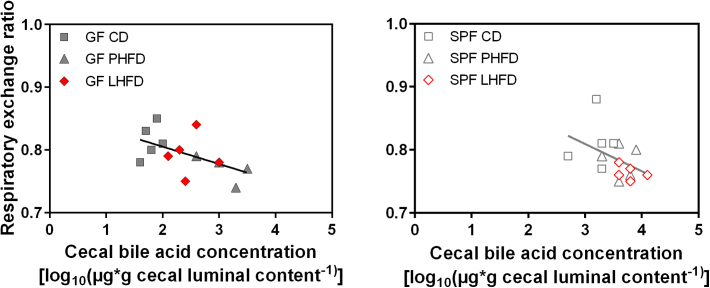
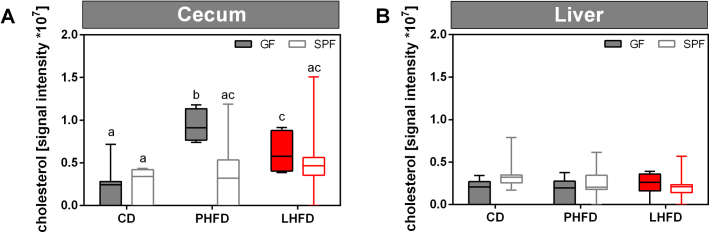
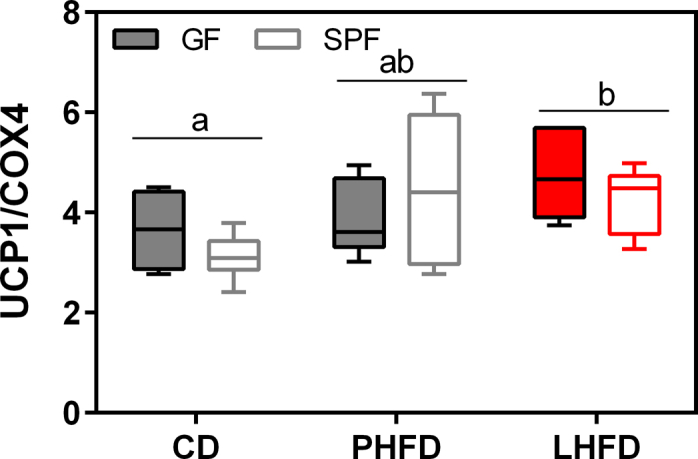
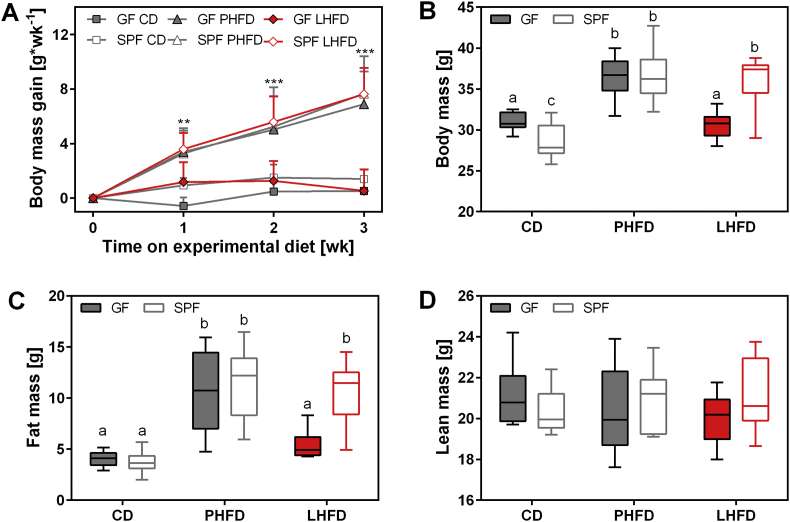
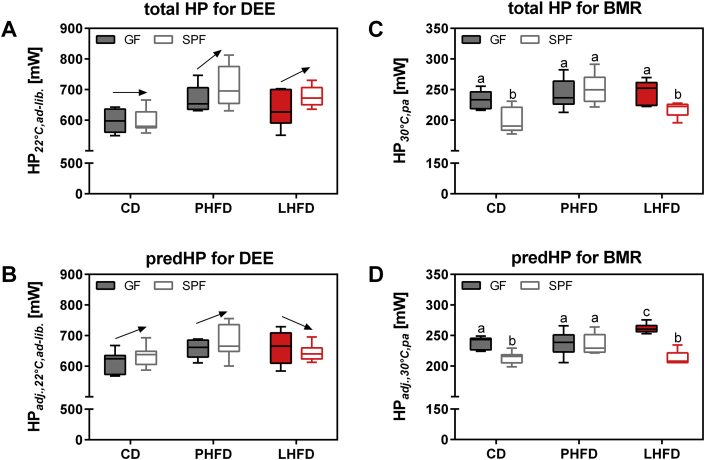
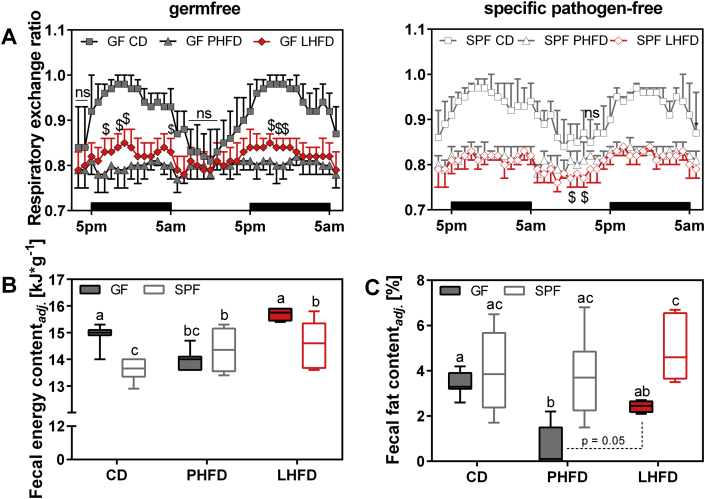
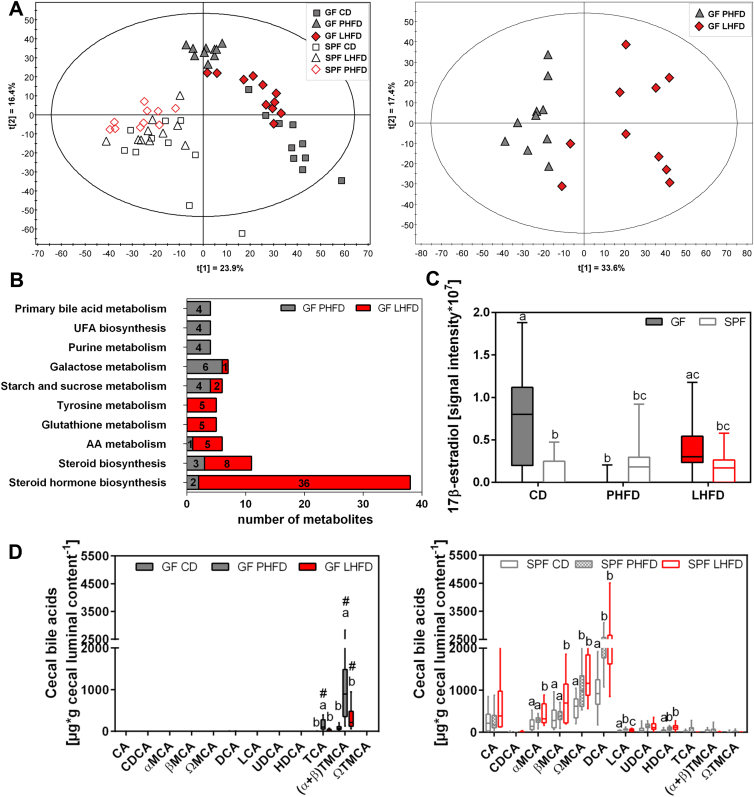
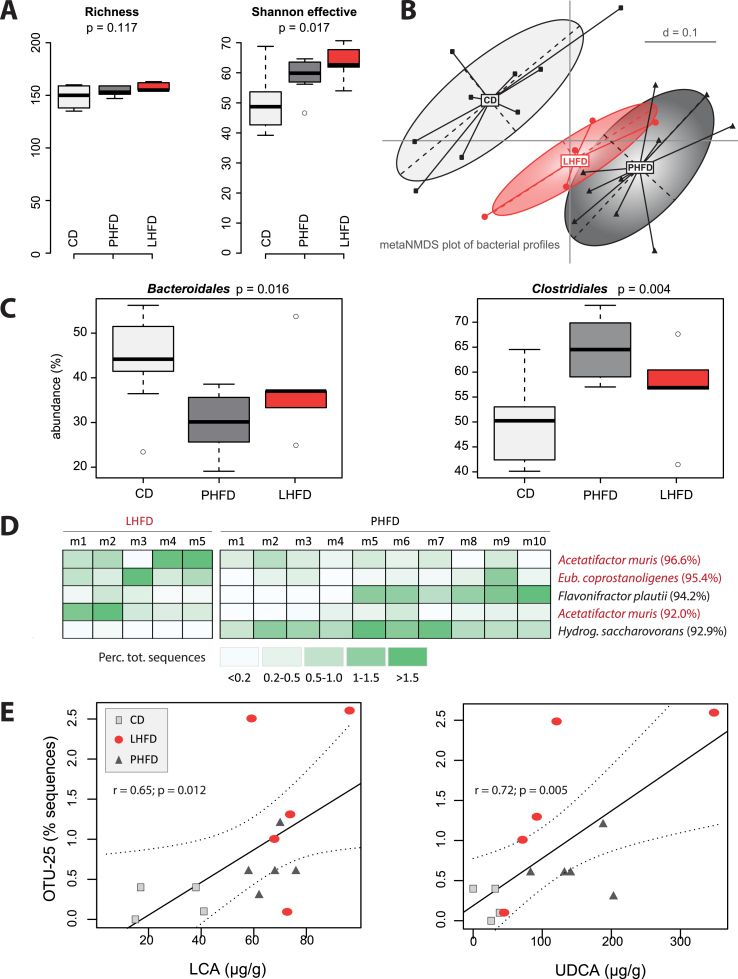
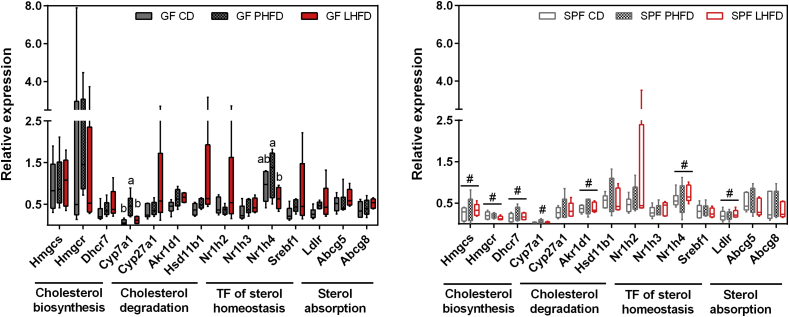
Results: GF mice, but not SPF mice, were completely DIO resistant when fed a cholesterol-rich lard-based high-fat diet, whereas on a cholesterol-free palm oil-based high-fat diet, DIO was independent of gut microbiota. In GF lard-fed mice, DIO resistance was conveyed by increased energy expenditure, preferential carbohydrate oxidation, and increased fecal fat and energy excretion. Cecal metabolite profiling revealed a shift in bile acid and steroid metabolites in these lean mice, with a significant rise in 17β-estradiol, which is known to stimulate energy expenditure and interfere with bile acid metabolism. Decreased cecal bile acid levels were associated with decreased hepatic expression of genes involved in bile acid synthesis. These metabolic adaptations were largely attenuated in GF mice fed the palm-oil based high-fat diet. We propose that an interaction of gut microbiota and cholesterol metabolism is essential for fat accretion in normal SPF mice fed cholesterol-rich lard as the main dietary fat source. This is supported by a positive correlation between bile acid levels and specific bacteria of the order Clostridiales (phylum Firmicutes) as a characteristic feature of normal SPF mice fed lard.

Conclusions: In conclusion, our study identified dietary cholesterol as a candidate ingredient affecting the crosstalk between gut microbiota and host metabolism.

Keywords: ANOVA, analysis of variance; Abcg5, ATP-binding cassette sub-family G member 5; Abcg8, ATP-binding cassette sub-family G member 8; Actb, beta actin; Akr1d1, aldo-keto-reductase family member 1; BMR, basal metabolic rate; CA, cholic acid; CD, control diet; CDCA, chenodeoxycholic acid; CIDEA, cell death inducing DFFA-like effector; COX4, cytochrome c oxidase subunit 4; Cyp27a1, cholesterol 27 alpha-hydroxylase; Cyp7a1, cholesterol 7 alpha-hydroxylase; DCA, deoxycholic acid; DEE, daily energy expenditure; DIO, diet-induced obesity; Dhcr7, 7-dehydrocholesterol reductase; Diet-induced obesity resistance; Eef2, eukaryotic elongation factor 2; Energy balance; FT-ICR-MS, Fourier transform-Ion Cyclotron Resonance-Mass Spectrometry; FT-IR, Fourier transform-infrared spectroscopy; GF, germfree; GUSB, beta-glucuronidase; Germfree; HDCA, hyodeoxycholic acid; HP, heat production; High-fat diet; Hmgcr, 3-hydroxy-3-methylglutaryl Coenzyme A reductase; Hmgcs, 3-hydroxy-3-methylglutaryl Coenzyme A synthase 1; Hprt1, hypoxanthine guanine phosphoribosyl transferase; Hsd11b1, hydroxysteroid (11-β) dehydrogenase 1; Hsp90, heat shock protein 90; LHFD, high-fat diet based on lard; Ldlr, low density lipoprotein receptor; MCA, muricholic acid; Nr1h2, nuclear receptor subfamily 1, group H, member 2 (liver X receptor β); Nr1h3, nuclear receptor subfamily 1, group H, member 3 (liver X receptor α); Nr1h4, nuclear receptor subfamily 1, group H, member 4 (farnesoid X receptor α); PHFD, high-fat diet based on palm oil; PRDM16, PR domain containing 16; SPF, specific pathogen free; Srebf1, sterol regulatory element binding transcription factor 1; TCA, taurocholic acid; TMCA, Tauromuricholic acid; Tf2b, transcription factor II B; UCP1, uncoupling protein 1; UDCA, ursodeoxycholic acid; UPLC-TOF-MS, ultraperformance liquid chromatography-time of flight-mass spectrometry; qPCR, quantitative real-time polymerase chain reaction.


Figures

Figure S2
Figure S2
Dependency of daily energy expenditure on body composition. Correlation between daily energy expenditure (HP22 °C, ad-lib.) and lean mass (A) or fat mass (B) following 4 wks of feeding CD, PHFD, or LHFD. SPF CD: n = 9; SPF PHFD: n = 10; SPF LHFD: n = 10; GF CD: n = 8; GF PHFD: n = 9; GF LHFD: n = 10. Linear regression of GF or SPF C57BL/6N mice was calculated irrespective of diet and microbiota status due to small sample size. (A) r2 = 0.26, p < 0.001; (B) r2 = 0.14, p < 0.01. There was no further dependency between daily energy expenditure and lean mass (C) or fat mass (D) after adjusting daily energy expenditure for body composition (HPadj.,22 °C, ad-lib.) by ANCOVA. (C) r2 < 0.001, p = ns; (D) r2 < 0.001, p = ns. adj.: adjusted; ad-lib.: ad-libitum; HP: heat production.
Figure S3
Figure S3
Dependency of basal metabolic rate on body composition. Correlation between basal metabolic rate (HP30 °C, pa) and lean mass (A) or fat mass (B) following 4 wks of feeding CD, PHFD or LHFD. SPF CD: n = 9; SPF PHFD: n = 10; SPF LHFD: n = 5; GF CD: n = 8; GF PHFD: n = 9; GF LHFD: n = 6. Linear regression of GF or SPF C57BL/6N mice was calculated irrespective of diet and microbiota status due to small sample size. (A) r2 = 0.19, p < 0.01; (B) r2 = 0.14, p < 0.01. There was no further dependency between basal metabolic rate and lean mass (C) or fat mass (D) after adjusting basal metabolic rate for body composition (HPadj.,30 °C, pa) by ANCOVA. (C) r2 < 0.001, p = ns; (D) r2 < 0.001, p = ns. adj.: adjusted; HP: heat production; pa: post-absorptive.
Figure S4
Figure S4
Respiratory exchange ratio of GF mice exposed to PHFD is below that of SPF counterparts and LHFD-FED mice. Comparison of respiratory exchange ratio between GF and SPF mice fed LHFD (p = ns) or PHFD, respectively. $ GF PHFD vs. SPF PHFD: p < 0.05. Black bars above the x-axis indicate nocturnal phases. SPF CD: n = 9; SPF PHFD: n = 10; SPF LHFD: n = 10; GF CD: n = 8; GF PHFD: n = 9; GF LHFD: n = 10. Data are shown as means ± sd.
Figure S5
Figure S5
Increased cecal bile acid concentration points to an increased fat oxidation in GF mice. Correlation between cecal bile acid concentration and respiratory exchange ratio measured during basal metabolic rate recordings and represented as the mean of fasted animals following 4 wks of feeding CD, PHFD or LHFD. SPF CD: n = 5; SPF PHFD: n = 5; SPF LHFD: n = 5; GF CD: n = 5; GF PHFD: n = 4; GF LHFD: n = 5. Linear regression of GF or SPF C57BL/6N mice was calculated irrespective of the diet. GF: r2 = 0.26, p < 0.05; SPF: r2 = 0.22, p = ns.
Figure S6
Figure S6
Cecal but not hepatic cholesterol levels are increased in GF mice due to PHFD feeding. (A) Signal intensities of cecal cholesterol measured by ESI-FT-ICR/MS. (B) Signal intensities of hepatic cholesterol measured by ESI-FT-ICR/MS. SPF CD: n = 10 (A)/11 (B); SPF PHFD: n = 10; SPF LHFD: n = 10; GF CD: n = 10; GF PHFD: n = 10; GF LHFD: n = 10. Different superscript letters indicate significant differences (p < 0.05).
Figure S7
Figure S7
UCP1 protein levels in interscapular brown adipose tissue are altered by diet but not by gut microbiota. SPF CD: n = 7; SPF PHFD: n = 6; SPF LHFD: n = 5; GF CD: n = 6; GF PHFD: n = 6; GF LHFD: n = 6. Heat dissipation of interscapular brown adipose tissue is reflected by uncoupling protein 1 (UCP1) protein levels analyzed in the fasted state of mice. Different superscript letters indicate significant diet effects (p < 0.05).
Figure S8
Figure S8
Browning of inguinal white adipose tissue does not explain the lean phenotype of LHFD-FED GF mice. (A) Relative gene expression levels of uncoupling protein 1 (Ucp1), (B) cell death inducing DFFA-like effector (Cidea), and (C) PR domain containing 16 (Prdm16). Data were normalized to the mean mRNA concentration of the three reference genes: transcription factor II B (Tf2b), beta-glucuronidase (Gusb), and beta-actin (Actb). SPF CD: n = 6; SPF PHFD: n = 6; SPF LHFD: n = 5; GF CD: n = 6; GF PHFD: n = 6; GF LHFD: n = 6. Gene expression was analyzed in the fasted state of mice. Different superscript letters indicate significant diet effects (p < 0.05).
Figure S9
Figure S9
HFD-feeding is not accompanied with acute inflammation. Plasma S-amyloid A levels were measured in the fed state of mice following dissection. SPF CD: n = 5; SPF PHFD: n = 5; SPF LHFD: n = 5; GF CD: n = 5; GF PHFD: n = 5; GF LHFD: n = 7. p = ns.
Figure 1
Figure 1
Dietary fat from lard precludes the development of diet-induced obesity in GF mice. (A) Body mass gain during the first 3 wks of experimental feeding. **p < 0.01 and ***p < 0.001 for GF LHFD, GF CD, and SPF CD relative to GF PHFD, SPF PHFD, and SPF LHFD. (B) Body mass, (C) fat mass, and (D) lean mass (p = ns) at the end of the feeding trial (4 wks). Different superscript letters indicate significant statistical differences (p < 0.05). SPF CD: n = 10; SPF PHFD: n = 10; SPF LHFD: n = 10; GF CD: n = 8; GF PHFD: n = 11; GF LHFD: n = 11.
Figure 2
Figure 2
Basal metabolic rate is highest in LHFD-FED GF mice and contributes to increased daily energy expenditure. (A, C) Total and (B, D) predicted heat production of C57BL/6N mice fed ad libitum at ambient temperature (22 °C) (A, B) and fasted at thermoneutrality (30 °C) representing basal metabolism (C, D). Arrows indicate trends in total (A) and predicted (B) daily energy expenditure within dietary groups of GF and SPF mice. Different superscript letters indicate significant statistical differences (p < 0.05). SPF CD: n = 9; SPF PHFD: n = 10; SPF LHFD: n = 10 (A, B)/5 (C, D); GF CD: n = 8; GF PHFD: n = 9; GF LHFD: n = 10 (A, B)/6 (C, D). Data were adjusted according to lean and fat mass over all C57BL/6N mice: HPadj., 22 °C,ad-lib. [mW] = 76.5196 + 7.4048 * fat mass + 24.9719 * lean mass (adjusted r2 = 0.49, p < 0.001). HPadj., 30 °C,pa [mW] = −18.851 + 3.2664 * fat mass + 11.072 * lean mass (adjusted r2 = 0.44, p < 0.001). adj.: adjusted; BMR: basal metabolic rate; DEE: daily energy expenditure; HP: heat production; pa: post-absorptive.
Figure 3
Figure 3
Lean GF mice are characterized by higher respiratory exchange ratio and energy loss in feces. (A) Respiratory exchange ratio in GF and SPF mice fed CD, PHFD, and LHFD. Left: $ GF PHFD vs. GF LHFD: p < 0.05; right: $ SPF PHFD vs. SPF LHFD: p < 0.05. CD-fed GF mice were different to HFD-fed mice at all time points unless otherwise labeled with ns. Different superscript letters indicate significant statistical differences (p < 0.05). Black bars above the x-axis indicate nocturnal phases. SPF CD: n = 9; SPF PHFD: n = 10; SPF LHFD: n = 10; GF CD: n = 8; GF PHFD: n = 9; GF LHFD: n = 10. Data are shown as means ± sd. (B) Fecal energy and (C) fat excretion in GF and SPF C57BL/6N mice (housed in groups) during the first and the last week of feeding. Data were adjusted for feces production as well as dietary energy or fat intake, respectively. SPF CD: n = 6; SPF PHFD: n = 6; SPF LHFD: n = 6; GF CD: n = 7; GF PHFD: n = 7; GF LHFD: n = 4. Linear regressions used for adjustment including both GF and SPF mice: Fecal energy contentadj. [kJ*g−1] = 13.0443 + 0.0273 * dietary energy intake − 0.8356 * feces production (adjusted r2 = 0.32, p < 0.001). Fecal fat contentadj. [%] = −0.0723 + 0.0261 * dietary fat intake − 0.3704 * feces production (adjusted r2 = 0.52, p < 0.001). ns: not significant.
Figure 4
Figure 4
Cholesterol-derived metabolites are altered between lean and obese mice. (A) Metabolite data were visualized by PCA, taking into account annotated mass signals for all SPF and GF mice on CD, LHFD, and PHFD (left) or GF LHFD and PHFD mice alone (right). (B) Output of KEGG metabolic pathway analysis, performed with MetaboAnalyst (top ten) showing the number of metabolites significantly increased in GF mice fed LHFD (red bars) or PHFD (grey bars), but not in SPF counterparts (p < 0.05; Welch's t-test). AA: arachidonic acid; UFA: unsaturated fatty acid. (C) Signal intensity of cecal 17β-estradiol. Different superscript letters indicate significant statistical differences (p < 0.05). (D) Cecal bile acid concentrations in GF and SPF C57BL/6N mice using UPLC-MS. Different superscript letters indicate significant differences within a certain bile acid and among GF or SPF mice, respectively (p < 0.05). # GF vs. SPF: p < 0.05. CA: cholic acid; CDCA: chenodeoxycholic acid; MCA: muricholic acid; DCA: deoxycholic acid; LCA: lithocholic acid; UDCA: ursodeoxycholic acid; HDCA: hyodeoxycholic acid; T: taurine-conjugated species. SPF CD: n = 10; SPF PHFD: n = 10; SPF LHFD: n = 10; GF CD: n = 10; GF PHFD: n = 10; GF LHFD: n = 10.
Figure 5
Figure 5
Specific dominant gut bacteria are affected by dietary fat source. Metagenomic DNA isolated from fecal samples (n = 24) was used for amplification of the V3/V4 region of 16S rRNA genes and subsequent sequencing using the Illumina technology. Sequences were analyzed using in-house developed pipelines as described in detail in the methods section. (A) Alpha-diversity analysis. (B) Multidimensional scaling showing differences in diversity between samples (beta-diversity) based on general UniFrac distances. (C) Box plots showing relative sequence abundance of taxonomic groups that were significantly different between mice fed the CD or HFD. (D) Phylotype analysis shown as heatmap of OTU abundances which were significantly different between the two HFD. The identity of OTUs was obtained using EzTaxon based on sequences of approximately 380 bp . Best hits are shown with corresponding sequences similarity. (E) Pearson correlation analysis of Acetatifactor sp. against cecal bile acid concentrations.
Figure 6
Figure 6
Altered substrate oxidation and fecal fat excretion in lean GF mice is linked to decreased CYP7A1 and NR1H4 expression. SPF CD: n = 6; SPF PHFD: n = 5; SPF LHFD: n = 5; GF CD: n = 6; GF PHFD: n = 6; GF LHFD: n = 5. Different superscript letters indicate significant differences between feeding groups of GF mice (p < 0.05). # GF vs. SPF: p < 0.05. Abcg5: ATP-binding cassette sub-family G member 5; Abcg8: ATP-binding cassette sub-family G member 8; Akr1d1: aldo-keto-reductase family member 1; Cyp7a1: cholesterol 7 alpha-hydroxylase; Cyp27a1: cholesterol 27 alpha-hydroxylase; Dhcr7: 7-dehydrocholesterol reductase; Hmgcr: 3-hydroxy-3-methylglutaryl Coenzyme A reductase; Hmgcs: 3-hydroxy-3-methylglutaryl Coenzyme A synthase 1; Hsd11b1: hydroxysteroid (11-β) dehydrogenase 1; Ldlr: low density lipoprotein receptor; Nr1h2: nuclear receptor subfamily 1, group H, member 2 (liver X receptor β); Nr1h3: nuclear receptor subfamily 1, group H, member 3 (liver X receptor α); Nr1h4: nuclear receptor subfamily 1, group H, member 4 (farnesoid X receptor α); Srebf1: sterol regulatory element binding transcription factor 1.

Similar articles

Cited by

References

    1. Wostmann B.S. The germfree animal in nutritional studies. Annual Review of Nutrition. 1981;1:257–279. PubMed PMID: 6764717. - PubMed
    1. Wostmann B.S., Larkin C., Moriarty A., Bruckner-Kardoss E. Dietary intake, energy metabolism, and excretory losses of adult male germfree Wistar rats. Laboratory Animal Science. 1983;33(1):46–50. PubMed PMID: 6834773. - PubMed
    1. Backhed F., Ding H., Wang T., Hooper L.V., Koh G.Y., Nagy A. The gut microbiota as an environmental factor that regulates fat storage. Proceedings of the National Academy of Sciences of the United States of America. 2004;101(44):15718–15723. PubMed PMID: 15505215; PubMed Central PMCID: PMC524219. - PMC - PubMed
    1. Backhed F., Ley R.E., Sonnenburg J.L., Peterson D.A., Gordon J.I. Host-bacterial mutualism in the human intestine. Science. 2005;307(5717):1915–1920. PubMed PMID: 15790844. - PubMed
    1. Le Roy T., Llopis M., Lepage P., Bruneau A., Rabot S., Bevilacqua C. Intestinal microbiota determines development of non-alcoholic fatty liver disease in mice. Gut. 2013;62(12):1787–1794. PubMed PMID: 23197411. - PubMed

Publication types