. 2016 Nov 30:6:37431.
doi: 10.1038/srep37431.

Perceptual training yields rapid improvements in visually impaired youth

Affiliations

Perceptual training yields rapid improvements in visually impaired youth

Jeffrey B Nyquist et al. Sci Rep. .

Abstract

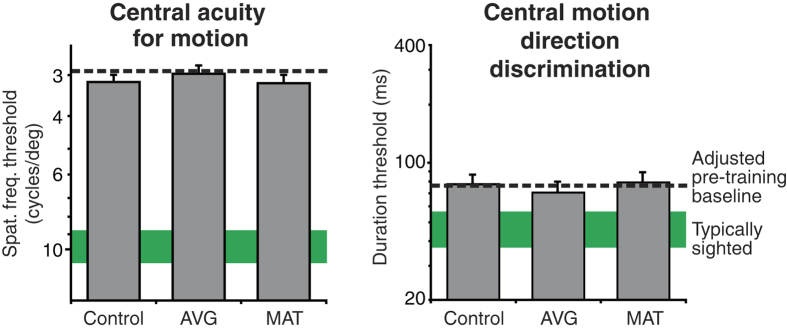
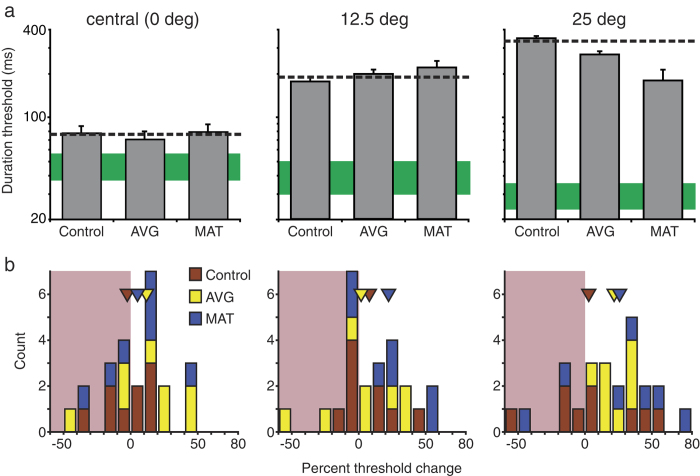
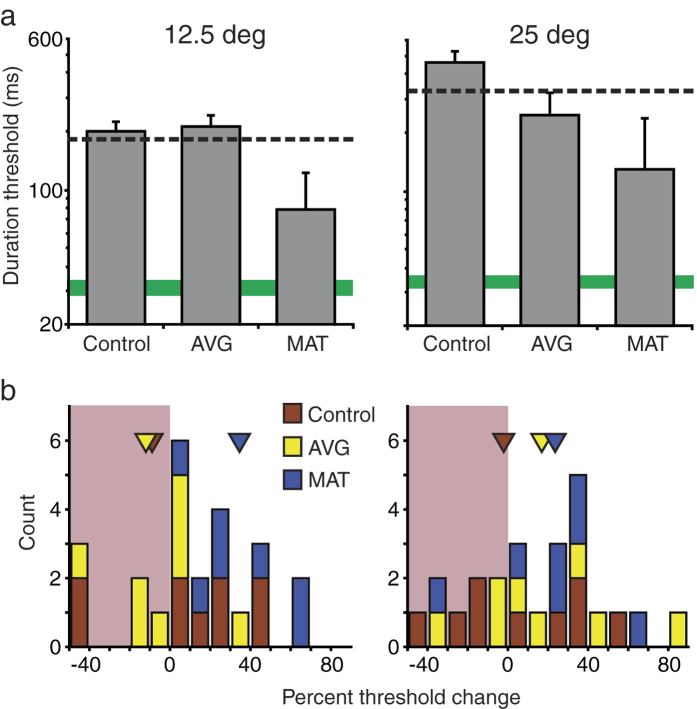
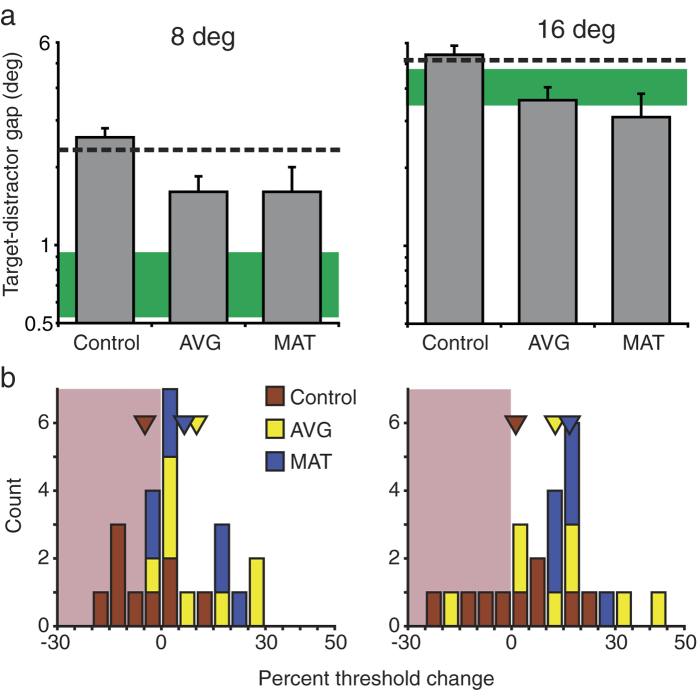
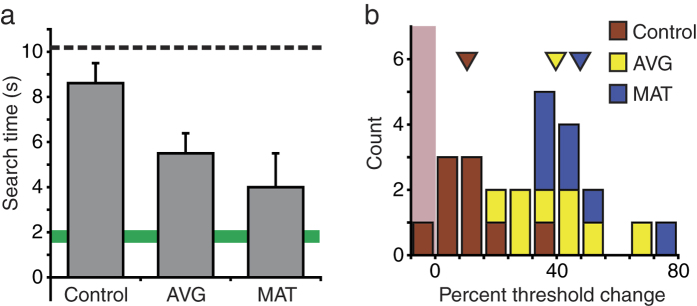
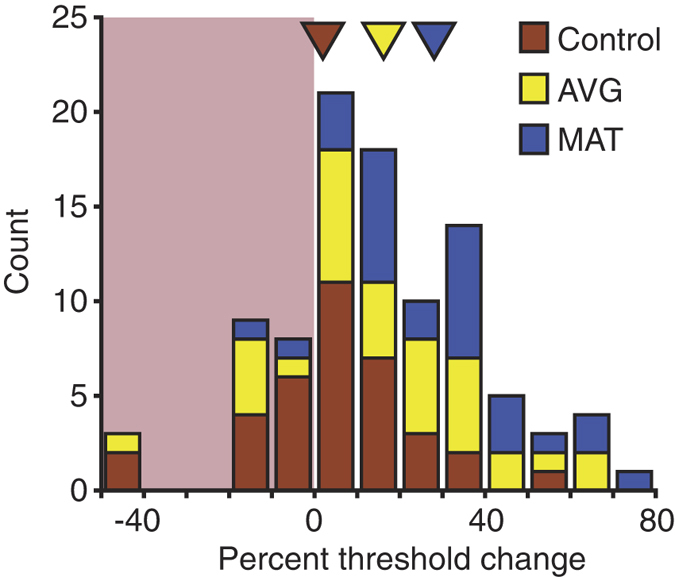
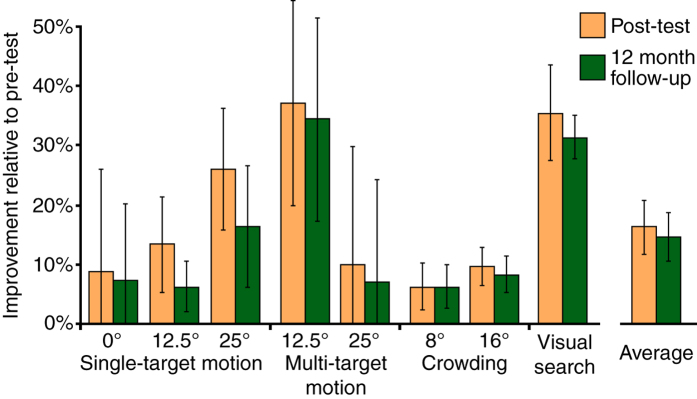
Visual function demands coordinated responses to information over a wide field of view, involving both central and peripheral vision. Visually impaired individuals often seem to underutilize peripheral vision, even in absence of obvious peripheral deficits. Motivated by perceptual training studies with typically sighted adults, we examined the effectiveness of perceptual training in improving peripheral perception of visually impaired youth. Here, we evaluated the effectiveness of three training regimens: (1) an action video game, (2) a psychophysical task that combined attentional tracking with a spatially and temporally unpredictable motion discrimination task, and (3) a control video game. Training with both the action video game and modified attentional tracking yielded improvements in visual performance. Training effects were generally larger in the far periphery and appear to be stable 12 months after training. These results indicate that peripheral perception might be under-utilized by visually impaired youth and that this underutilization can be improved with only ~8 hours of perceptual training. Moreover, the similarity of improvements following attentional tracking and action video-game training suggest that well-documented effects of action video-game training might be due to the sustained deployment of attention to multiple dynamic targets while concurrently requiring rapid attending and perception of unpredictable events.


Conflict of interest statement

J.N. is the founder of Neurotrainer. D.T. is an uncompensated scientific advisor for Neurotrainer. R.Z. and J. L. declare no competing financial interests.

Figures

Figure 1
Figure 1. Effects of training on foveal motion perception.
Estimated post-training thresholds for three training groups in the central acuity for motion task (left) and central motion discrimination task (right). To be consistent with other graphs in this paper, Y-axis for the acuity task is flipped (i.e., larger numbers, indicating better performance, are given at the bottom of the y-axis). Error bars are SEM. Adjusted pre-training baseline for LV participants is shown with a dashed line. Mean performance for TS participants is shown with green horizontal bars. The width of the bar includes mean +/− SEM.
Figure 2
Figure 2. Effects of training on single target motion direction discrimination.
(a) Estimated post-training thresholds for three training groups (grey bars). For comparison purposes, central motion discrimination results from Fig. 1 are replotted (left panel). All conventions are as described in the Fig. 1 legend. Note that while performance for TS individuals improved with eccentricity, performance of LV individuals worsens. (b) Distribution of threshold changes from pre to post-training for individual participants from three training groups. Positive numbers indicate improvements. Triangles show mean results for three training groups. The leftmost bin includes data between −85 and −50. Shaded reddish areas indicate decreases in performance.
Figure 3
Figure 3. Effects of training on multi-target direction comparison.
(a) Estimated post-training thresholds for three training groups (grey bars). All conventions are as described in the Fig. 1 legend. (b) Distribution of threshold changes from pre to post-training for individual participants from three training groups. Positive numbers indicate improvements. Triangles show mean results for three training groups. The leftmost bin includes data between −180 and −40.
Figure 4
Figure 4. Effects of training on visual crowding.
(a) Estimated post-training thresholds for three training groups (grey bars). All conventions are as described in the Fig. 1 legend. (b) Distribution of threshold changes from pre to post-training for individual participants from three training groups. Positive numbers indicate improvements. Triangles show mean results for three training groups.
Figure 5
Figure 5. Effects of training on visual search.
(a) Estimated post-training thresholds for three training groups (grey bars). All conventions are as described in Fig. 1 legend. (b) Distribution of threshold changes from pre to post-training for individual participants from three training groups. Positive numbers indicate improvements. Triangles show mean results for three training groups.
Figure 6
Figure 6. Pooled over tasks involving visual periphery, distribution of training-induced threshold changes for individual participants from three training groups.
For tasks with two stimulus eccentricities (visual crowding, single target motion direction discriminations and multi-target direction comparison), we used the average over the two eccentricities. For visual search, we used the data shown in Fig. 5b. Positive numbers indicate improvements. Triangles show mean results for three training groups. The leftmost bin includes data between −150 and −40.
Figure 7
Figure 7. Learning retention 12 months after training.
For four participants, we re-measured the key post-training measures at least 12 months after the end of training (2 for MAT and 2 for AVG). Data are expressed as % improvement relative to the pre-training baseline. The average across all tasks is shown on the far right. Error bars are SEM.
Figure 8
Figure 8. An illustration of a typical trial during MAT training.
First, target balls to be tracked are briefly identified with a black outline (left panel). The black outlines disappear, and all balls start to move in random directions (centre panel). The participant’s task is to track the target balls. During the tracking task, drifting Gabor targets appear on either the right or the left side. The participant’s task is to also discriminate Gabor motion direction. After 10 seconds, all balls stop moving and two are highlighted (right panel). The participant’s task is to identify which ball was among the target balls.

References

    1. Bavelier D., Green C. S., Pouget A. & Schrater P. Brain plasticity through the life span: learning to learn and action video games. Annu. Rev. Neurosci. 35, 391–416 (2012). - PubMed
    1. Watanabe T. & Sasaki Y. Perceptual learning: toward a comprehensive theory. Annu. Rev. Psychol. 66, 197–221 (2015). - PMC - PubMed
    1. Blackwell D. L., Lucas J. W. & Clarke T. C. Summary health statistics for U.S. adults: national health interview survey, 2012. Vital Health Stat. 10, 1–161 (2014). - PubMed
    1. Bishop V., Corn A. & Koenig A. Foundations Of Low Vision: Clinical And Functional Perspectives. (AFB Press New York, 1996).
    1. Li R. W., Young K. G., Hoenig P. & Levi D. M. Perceptual learning improves visual performance in juvenile amblyopia. Invest. Ophthalmol. Vis. Sci. 46, 3161–3168 (2005). - PubMed

Publication types

MeSH terms