. 2016 Nov 30:7:13683.
doi: 10.1038/ncomms13683.

Fatty acid metabolic reprogramming via mTOR-mediated inductions of PPARγ directs early activation of T cells

Affiliations

Fatty acid metabolic reprogramming via mTOR-mediated inductions of PPARγ directs early activation of T cells

Mulki Angela et al. Nat Commun. .

Abstract

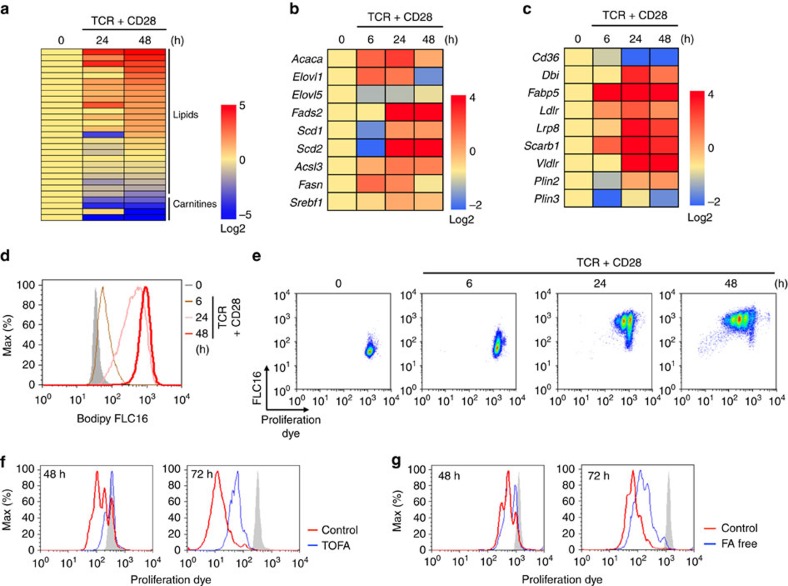
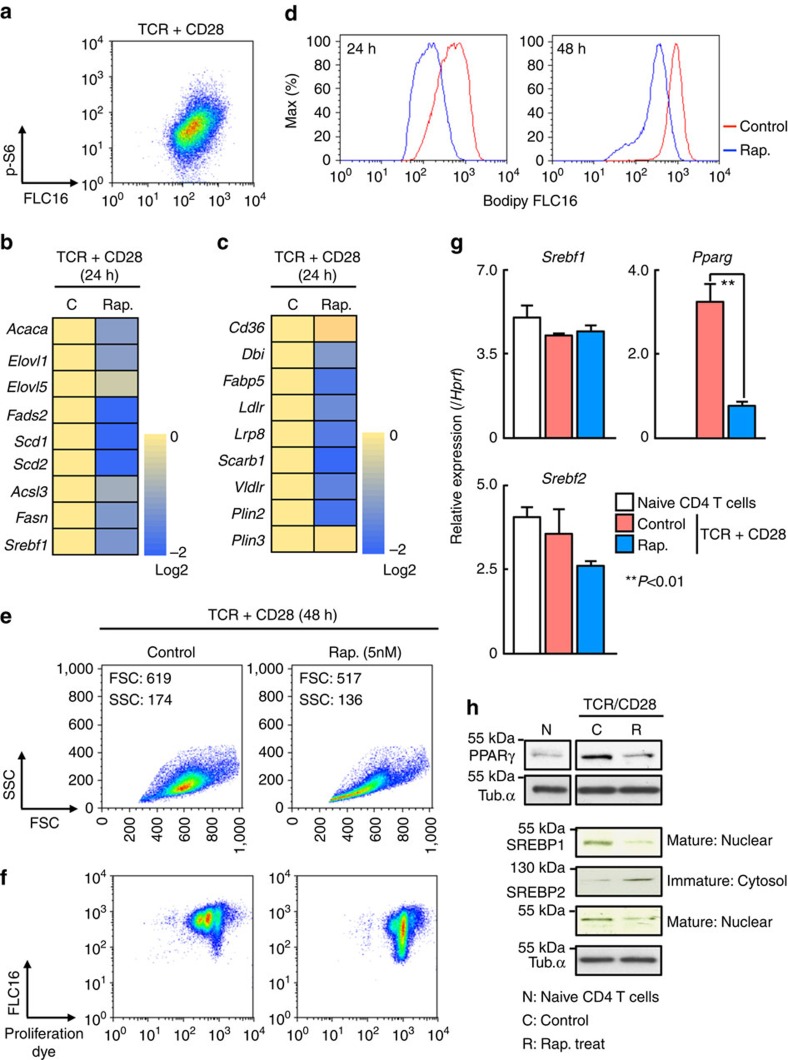
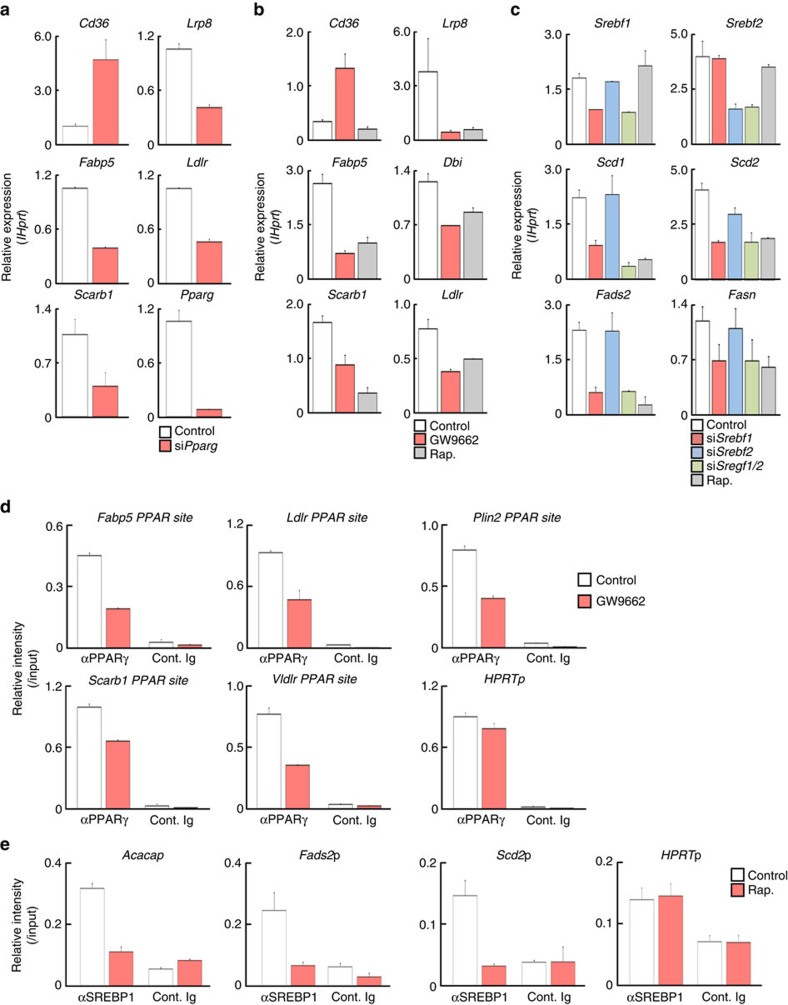
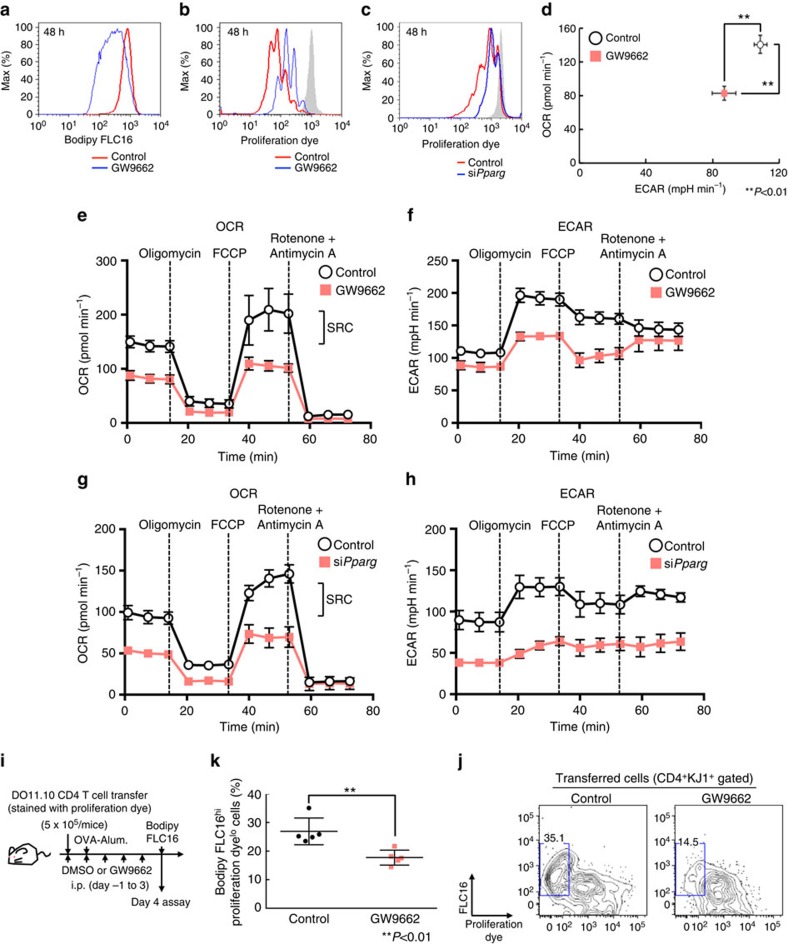
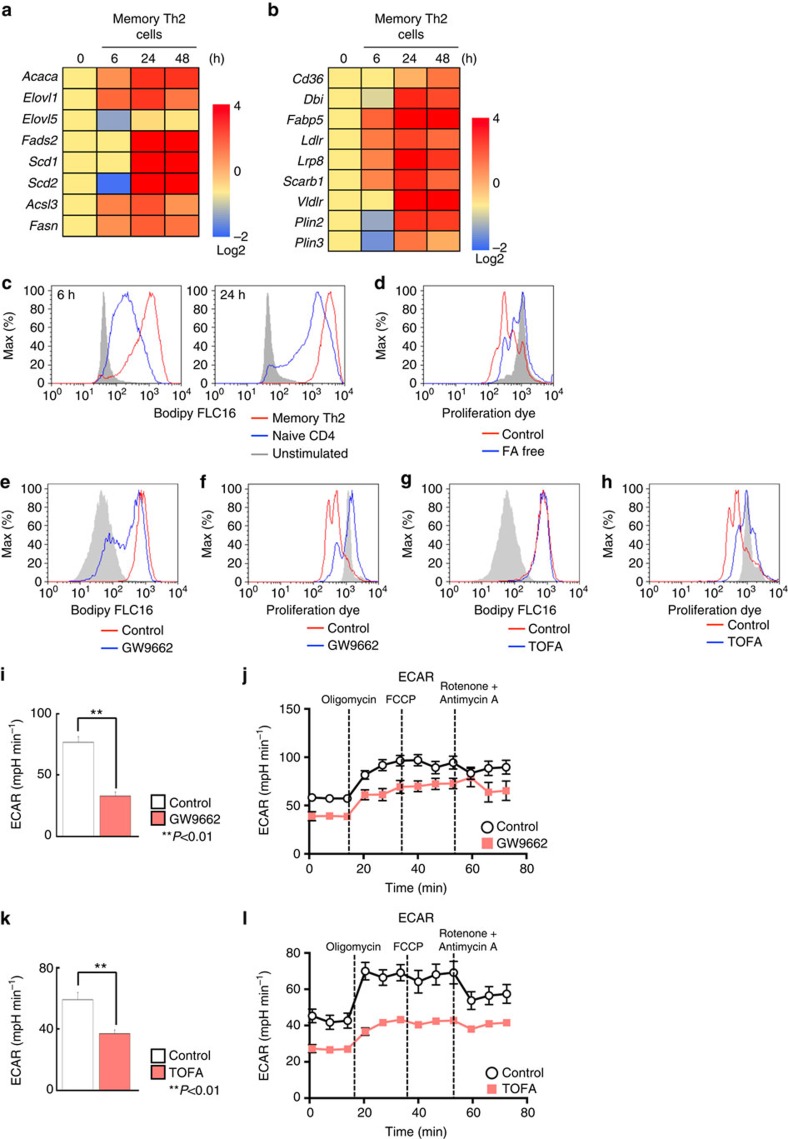
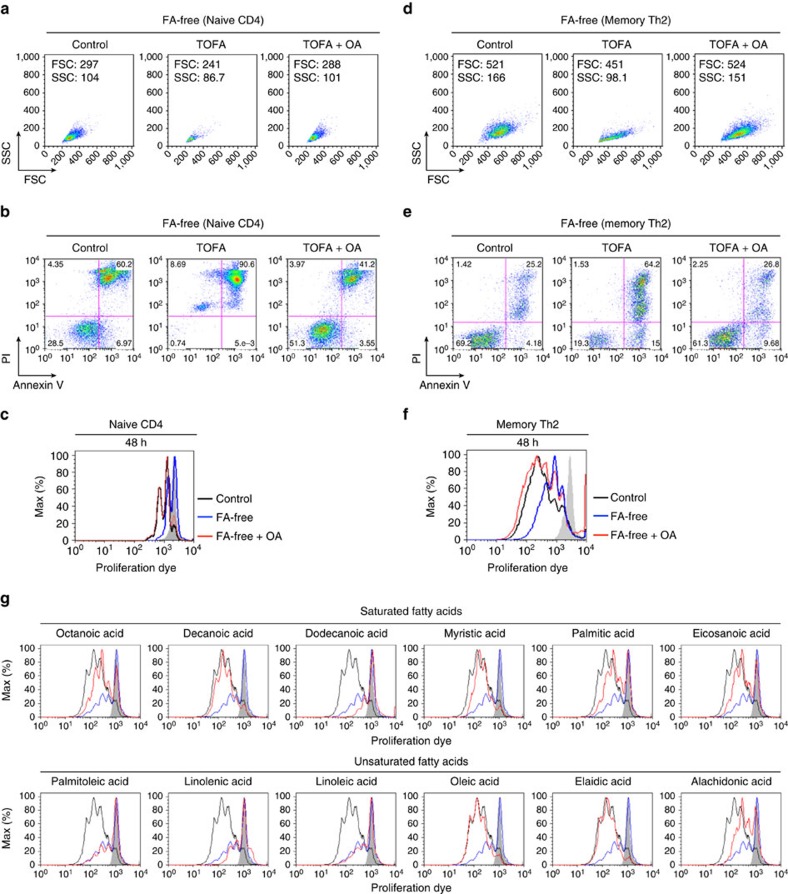
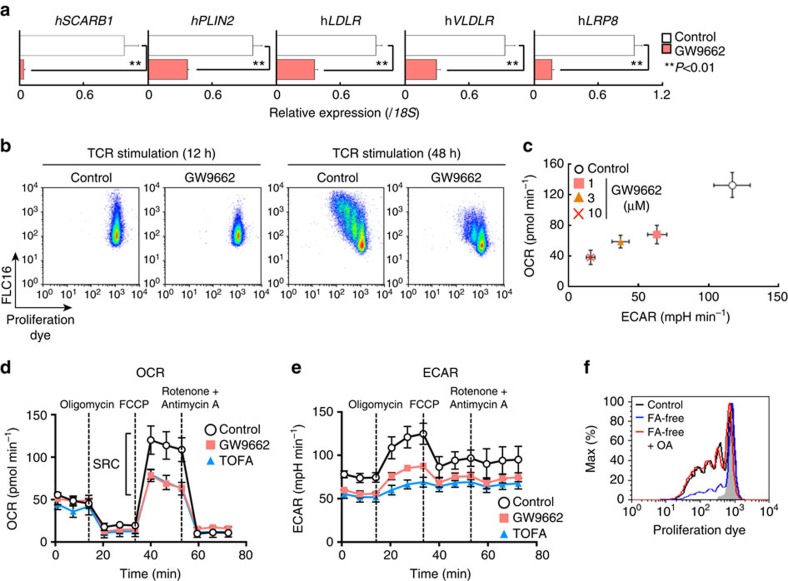
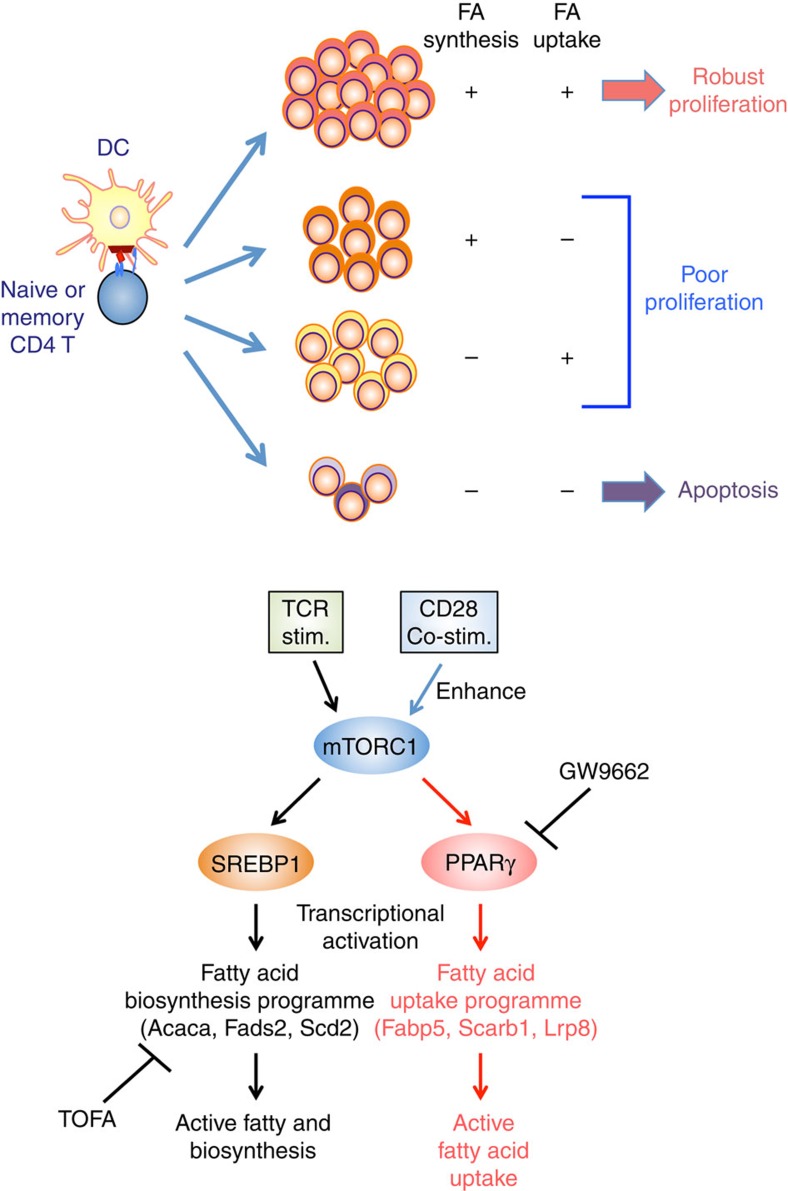
To fulfil the bioenergetic requirements for increased cell size and clonal expansion, activated T cells reprogramme their metabolic signatures from energetically quiescent to activated. However, the molecular mechanisms and essential components controlling metabolic reprogramming in T cells are not well understood. Here, we show that the mTORC1-PPARγ pathway is crucial for the fatty acid uptake programme in activated CD4+ T cells. This pathway is required for full activation and rapid proliferation of naive and memory CD4+ T cells. PPARγ directly binds and induces genes associated with fatty acid uptake in CD4+ T cells in both mice and humans. The PPARγ-dependent fatty acid uptake programme is critical for metabolic reprogramming. Thus, we provide important mechanistic insights into the metabolic reprogramming mechanisms that govern the expression of key enzymes, fatty acid metabolism and the acquisition of an activated phenotype during CD4+ T cell activation.


Figures

Figure 1
Figure 1. FA metabolism is required for the full activation of CD4+ T cells.
(a) Metabolome analysis of CD4+ T cells collected at the indicated times after TCR stimulation. The log2 value for each metabolite represents the average of duplicates and the amount of each metabolite in naive CD4+ T cells was set to 0 (see also Supplementary Fig. 1). (b) qRT-PCR analyses of the relative expression of the genes encoding the enzymes in fatty acid biosynthesis programme in CD4+ T cells collected at the indicated times after TCR stimulation. The heat map represents the log2 value of the relative mRNA expression level (see colour scale). (c) qRT-PCR analyses of the relative expression of the genes encoding the enzymes and transporter in fatty acid uptake and lipolysis programmes in CD4+ T cells collected at the indicated times after TCR stimulation as in (b). (d) Representative plots of Bodipy FLC16 in CD4+ T cells collected at the indicated times after TCR stimulation are shown. (e) Naive CD4+ T cells were labelled with e670 proliferation dye and stimulated with immobilized anti-TCRβ mAb and anti-CD28 mAb in the presence of Bodipy FLC16. Representative profiles of e670 and Bodipy FLC16 in CD4 T cells collected at the indicated times after TCR stimulation are shown. (f,g) Naive CD4+ T cells were labelled with e670 proliferation dye and stimulated with immobilized anti-TCRβ mAb and anti-CD28 mAb in the presence of TOFA (f) or under fatty acid-free conditions (g). Three technical replicates were performed for qRT-PCR (b,c). Three independent experiments were performed with similar results (bg).
Figure 2
Figure 2. TCR/CD28-mTORC1 signal axis induces PPARγ and SREBP1 activation.
(a) Intracellular staining profiles of p-S6 protein and Bodipy FLC16 in stimulated CD4+ T cells for 24 h. (b) qRT-PCR analyses of the relative expression of the genes encoding the enzymes in fatty acid biosynthesis programme in stimulated CD4+ T cells in the presence of rapamycin. The heat map represents the log2 value of the relative mRNA expression level (see colour scale). The log2 value of each gene in control cells was set to 0. (c) qRT-PCR analyses of the relative expression of the genes encoding the enzymes and transporter in fatty acid uptake and lipolysis programmes in stimulated CD4+ T cells in the presence of rapamycin as in b. (d) Representative plots of Bodipy FLC16 in CD4+ T cells collected at the indicated times after TCR stimulation in the presence of rapamycin are shown. (e) Forward and side scatter of live cells 48 h after TCR stimulation in the presence or absence of rapamycin. (f) Representative profiles of e670 and Bodipy FLC16 in stimulated CD4+ T cells in the presence of rapamycin 48 h after TCR stimulation are shown. (g) qRT-PCR analyses of the relative expression of Srebf1, Srebf2 and Pparg in naive CD4+ T cells and activated CD4+ T cells in the presence or absence of rapamycin are shown. (**P<0.01, Mann–Whitney U test). (h) Protein levels of SREBP1, SREBP2 and PPARγ in naive CD4 T cells and stimulated cells in the presence or absence of rapamycin. Three technical replicates were performed for qRT-PCR (b,c,g). The mean values with s.d. are shown. **P<0.01 more than three independent experiments were performed with similar results (ah).
Figure 3
Figure 3. PPARγ controls expression of genes associated with FA uptake programme.
(a) Effects of silenced Pparg on the genes encoding the enzymes and transporters in fatty acid uptake programme in stimulated CD4+ T cells. Naive CD4+ T cells were electroporated with control or Srebf1 siRNA and cultured for 2 days, and qRT-PCR analyses of the indicated genes are shown. (b) qRT-PCR analyses of the indicated genes in activated CD4+ T cells with or without GW9662. (c) Effects of silenced Srebf1 on the genes encoding the enzymes in fatty acid biosynthesis programme in stimulated CD4+ T cells as in a. (d) ChIP assays were performed with anti-PPARγ at the promoter region of the target gene loci such as Fabp5, Ldlr, Plin2, Scarb1, Vldlr and Hprt from activated CD4+ T cells treated with DMSO (Control) and GW9662 (10 μM). (e) ChIP assays were performed with anti-SREBP1 at the promoter regions of Acaca, Fads2, Scd2 and Hprt from activated CD4+ T cells treated with DMSO (Control) and rapamycin (Rap.; 5 nM). Three technical replicates were performed for qRT-PCR (a–c) and ChIP qRT-PCR (d,e). Three independent experiments were performed with similar results (ae).
Figure 4
Figure 4. PPARγ-dependent FA uptake is essential for rapid proliferation of CD4+ T cells.
(a) Representative plots of Bodipy FLC16 in activated CD4+ T cells 48 h after TCR stimulation with or without GW9662 are shown. (b) Representative profiles of e670 in stimulated CD4+ T cells in the presence or absence of GW9662. (c) Representative profiles of e670 in stimulated CD4+ T cells with or without transduction of siRNA for Pparg. (d) Basal levels of OCR and ECAR of activated CD4+ T cells for 48 h with TCR stimulation in the presence or absence of GW9662. (**P<0.01, Mann–Whitney U test, n=6 per group) (e) OCR of activated CD4+ T cells 48 h after TCR stimulation with or without GW9662 under basal conditions (time point 0) and in response to sequential treatment with Oligomycin, FCCP and Rotenone-Antimycin A. (f) ECAR of activated CD4+ T cells 48 h after TCR stimulation with or without GW9662 under basal conditions and in response to sequential treatment with Oligomycin, FCCP and Rotenone-Antimycin A as in e. (g) OCR of activated CD4+ T cells 48 h after TCR stimulation with or without transduction of siRNA for Pparg as in e. (h) ECAR of activated CD4+ T cells 48 h after TCR stimulation with or without transduction of siRNA for Pparg under basal conditions and in response to sequential treatment with Oligomycin, FCCP and Rotenone-Antimycin A as in f. (i) Experimental protocols for OVA/Alum-induced CD4+ T cell proliferation with the administration of GW9662. (j) Representative profiles of e670 and Bodipy FLC16 in activated DO11.10 TCR Tg CD4 T cells collected from control or GW9662 treated OVA-immunized mice are shown. (k) The summary data for the profiles of e670 and Bodipy FLC16 in activated DO11.10 Tg CD4+ T cells are shown as frequencies with standard deviations (**P<0.01, Mann–Whitney U test, n=5 per group). Six technical replicates were performed for Seahorse assay (dh). The mean values with s.d. are shown. **P<0.01 Three independent experiments were performed with similar results (ah). Two independent experiments were performed with similar results (j,k).
Figure 5
Figure 5. FA metabolism is critical for activation and rapid proliferation of memory CD4+ T cells.
(a) qRT-PCR analyses of the relative expression of the genes encoding fatty acid biosynthesis enzymes in memory Th2 cells at the indicated times after TCR stimulation. The heat map represents the log2 value of the relative mRNA expression level (see colour scale). (b) qRT-PCR analyses of expression of genes encoding the enzymes and transporter in fatty acid uptake and lipolysis programmes in memory Th2 cells collected at the indicated times after TCR stimulation as in a. (c) Representative plots of Bodipy FLC16 in naive CD4+ T cells and memory Th2 cells collected at the indicated times after antigenic stimulation are shown. (d) Representative plot of e670 proliferation dye in memory Th2 cells after antigenic stimulation under fatty acid-free conditions. (eh) Representative plots of Bodipy FLC16 and e670 proliferation dye in stimulated memory Th2 cells in the presence of GW9662 (10 μM) (e,f) or TOFA (10 μM) (g,h). (i) ECAR of memory Th2 cells 48 h after TCR stimulation with or without GW9662 under basal conditions (Time point 0). (**P<0.01, Mann–Whitney U test, n=6 per group). (j) ECAR of memory Th2 cells 48 h after TCR stimulation with or without GW9662 under basal conditions and in response to sequential treatment with Oligomycin, FCCP and Rotenone-Antimycin A. (k) ECAR of memory Th2 cells 48 h after TCR stimulation with or without TOFA under basal conditions. (**P<0.01, Mann–Whitney U test, n=6 per group) (l) ECAR of memory Th2 cells 48 h after TCR stimulation with or without TOFA under basal conditions and in response to sequential treatment with Oligomycin, FCCP and Rotenone-Antimycin A as in j. Three technical replicates were performed for qRT-PCR (a,b). Six technical replicates were performed for Seahorse assay (il). The mean values with s.d. are shown (i,k). **P<0.01 Three independent experiments were performed with similar results (al).
Figure 6
Figure 6. Extrinsic FAs restore activated phenotype of CD4+ T cells under FA-free conditions.
(a) Naive CD4+ T cells were stimulated with an immobilized anti-TCRβ mAb and anti-CD28 mAb with or without TOFA treatment (10 μM) in the presence or absence of oleic acid (100 μM) under fatty acid-free conditions. Forward and side scatter of live cells after TCR stimulation are shown. (b) Susceptibility to apoptosis of stimulated CD4+ T cells was investigated by Annexin V and propidium iodide (PI) staining with similar conditions in the presence or absence of oleic acid (100 μM) under fatty acid-free conditions. (c) Representative plot of e670 proliferation dye in activated CD4+ T cells with or without oleic acid treatment under normal or fatty acid-free conditions 48 h after TCR stimulation was shown. (df) Memory Th2 cells were stimulated with an immobilized anti-TCRβ mAb and anti-CD28 mAb with or without TOFA treatment (10 μM) in the presence or absence of oleic acid (100 μM) under fatty acid-free conditions. Representative profiles of forward scatter and side scatter (d), cell survival (e) and e670 proliferation dye (f) in stimulated memory Th2 cells cultured under the indicated conditions are shown. (g) Representative plot of e670 proliferation dye in activated CD4+ T cells with or without a series of fatty acid treatment under normal or fatty acid-free conditions 48 h after TCR stimulation was shown. Three independent experiments were performed with similar results (ac). Two independent experiments were performed with similar results (dg).
Figure 7
Figure 7. Anabolic FA metabolism is essential for activation of human CD4+ T cells.
(a) qRT-PCR analyses of the relative expression of the genes encoding the enzymes and transporter in fatty acid uptake and lipolysis programmes in activated human CD4+ T cells 24 h after TCR stimulation in the presence or absence of GW9662 (10 μM). (**P<0.01, Mann–Whitney U test) (b) Representative profiles of e670 and Bodipy FLC16 in activated human CD4+ T cells in the presence or absence of GW9662. (c) Basal levels of OCR and ECAR of activated human CD4+ T cells for 48 h with TCR stimulation in the presence or absence of indicated doses of GW9662. (**P<0.01, Mann–Whitney U test, n=6 per group) (d) OCR of activated human CD4+ T cells 48 h after TCR stimulation with or without GW9662 or TOFA under basal conditions and in response to sequential treatment with Oligomycin, FCCP and Rotenone-Antimycin A. (e) ECAR of activated human CD4+ T cells 48 h after TCR stimulation with or without GW9662 or TOFA under basal conditions and in response to sequential treatment with Oligomycin, FCCP and Rotenone-Antimycin A as in d. (f) Representative plot of e670 proliferation dye in activated human CD4+ T cells with or without oleic acid treatment under normal or fatty acid-free conditions 48 h after TCR stimulation was shown. Three technical replicates were performed for qRT-PCR (a). Six technical replicates were performed for Seahorse assay (ce). The mean values with s.d. are shown (a,c,d,e). **P<0.01. Three independent experiments were performed with similar results (a,b). Two independent experiments were performed with similar results (cf).
Figure 8
Figure 8. FA metabolism and early activation of CD4+ T cells.
Top panel: antigenic stimulation induces both fatty acid biosynthesis and fatty acid uptake programmes in CD4+ T cells. Both fatty acid biosynthesis and fatty acid uptake programmes are required for robust proliferation after antigenic stimulation. Inhibition of either fatty acid biosynthesis or fatty acid uptake programmes results in insufficient proliferation after antigenic stimulation. Activate CD4+ T cells do not survive and undergo apoptosis when both fatty acid biosynthesis and fatty acid uptake programmes are dampen. Bottom panel: TCR/CD28-mTORC1 signalling axis controls fatty acid uptake and biosynthesis programmes through the induction of PPARγ and the activation of SREBP1 in activated CD4+ T cells, respectively. PPARγ and SREBP1 directly bind to target genes and regulate their expression. GW9662: a selective, irreversible antagonist of PPARγ, TOFA: an allosteric inhibitor of ACC1.

References

    1. Smith-Garvin J. E., Koretzky G. A. & Jordan M. S. T cell activation. Annu. Rev. Immunol. 27, 591–619 (2009). - PMC - PubMed
    1. Nakayama T. & Yamashita M. The TCR-mediated signaling pathways that control the direction of helper T cell differentiation. Semin. Immunol. 22, 303–309 (2010). - PubMed
    1. Colombetti S., Basso V., Mueller D. L. & Mondino A. Prolonged TCR/CD28 engagement drives IL-2-independent T cell clonal expansion through signaling mediated by the mammalian target of rapamycin. J. Immunol. 176, 2730–2738 (2006). - PubMed
    1. Mondino A. & Mueller D. L. mTOR at the crossroads of T cell proliferation and tolerance. Semin. Immunol. 19, 162–172 (2007). - PMC - PubMed
    1. Chi H. Regulation and function of mTOR signalling in T cell fate decisions. Nat. Rev. Immunol. 12, 325–338 (2012). - PMC - PubMed

Publication types

MeSH terms