

Loss of Frataxin activates the iron/sphingolipid/PDK1/Mef2 pathway in mammals
- PMID: 27901468
- PMCID: PMC5130293
- DOI: 10.7554/eLife.20732
Loss of Frataxin activates the iron/sphingolipid/PDK1/Mef2 pathway in mammals
Abstract
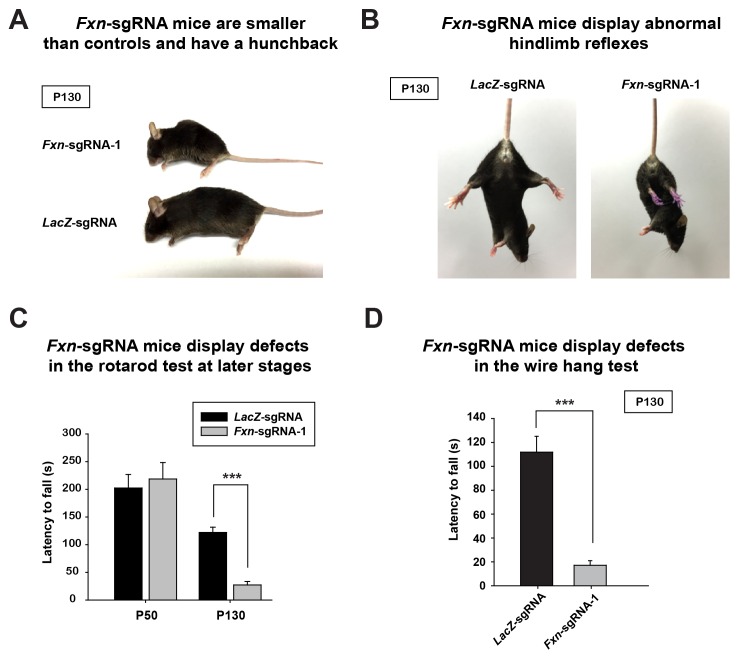
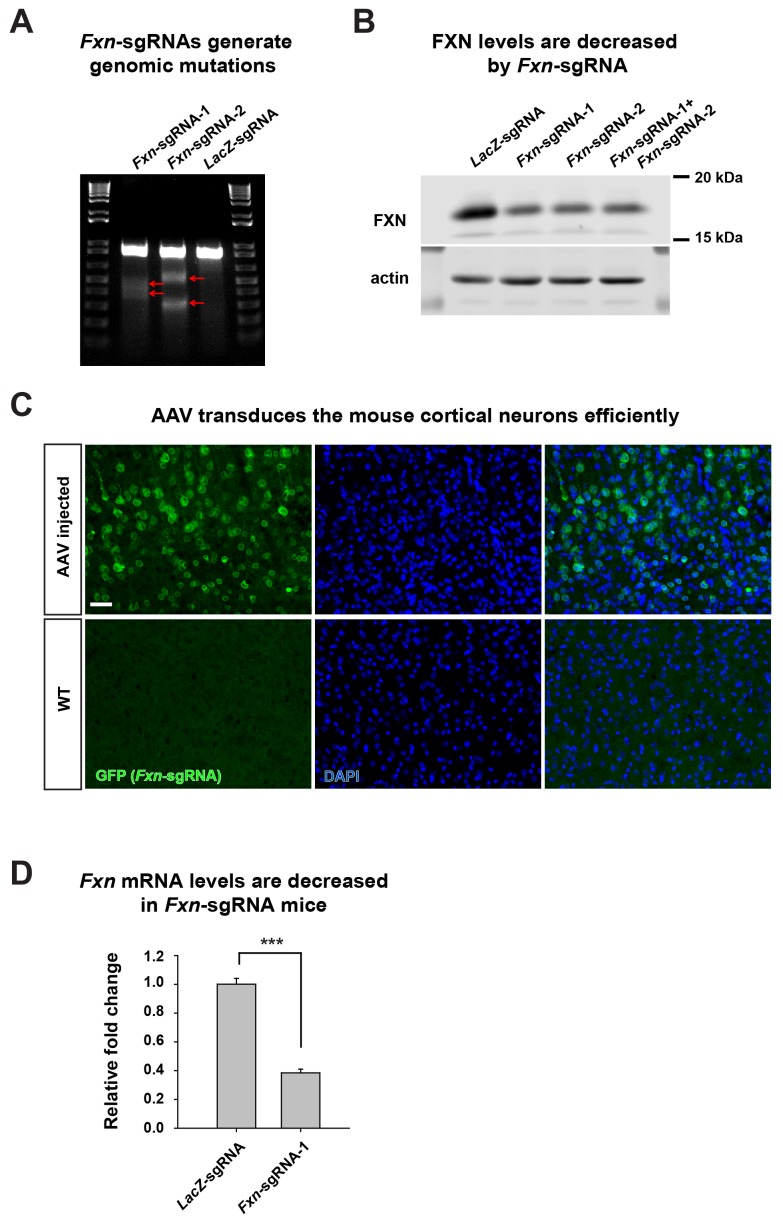
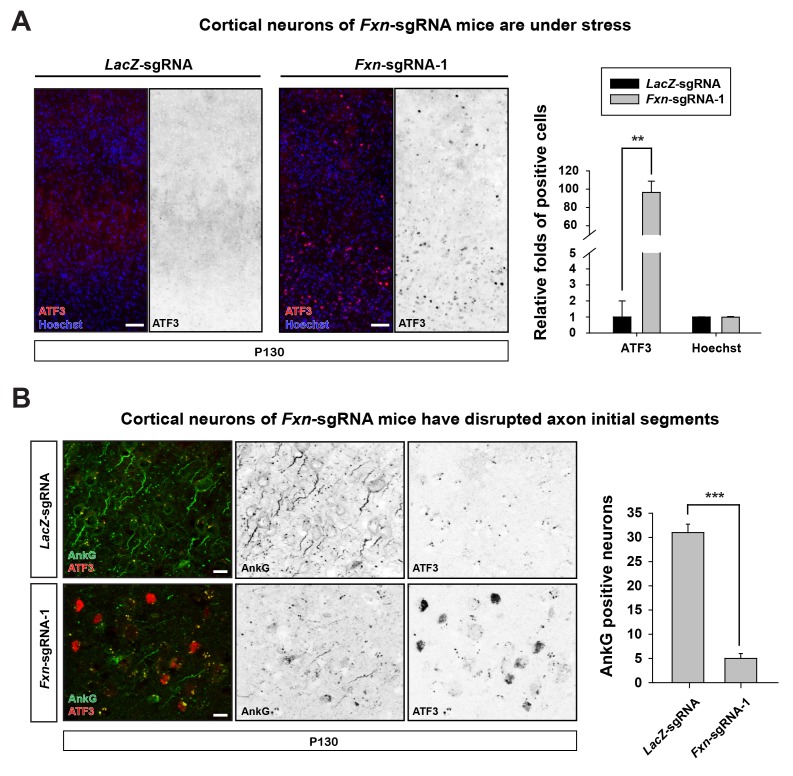
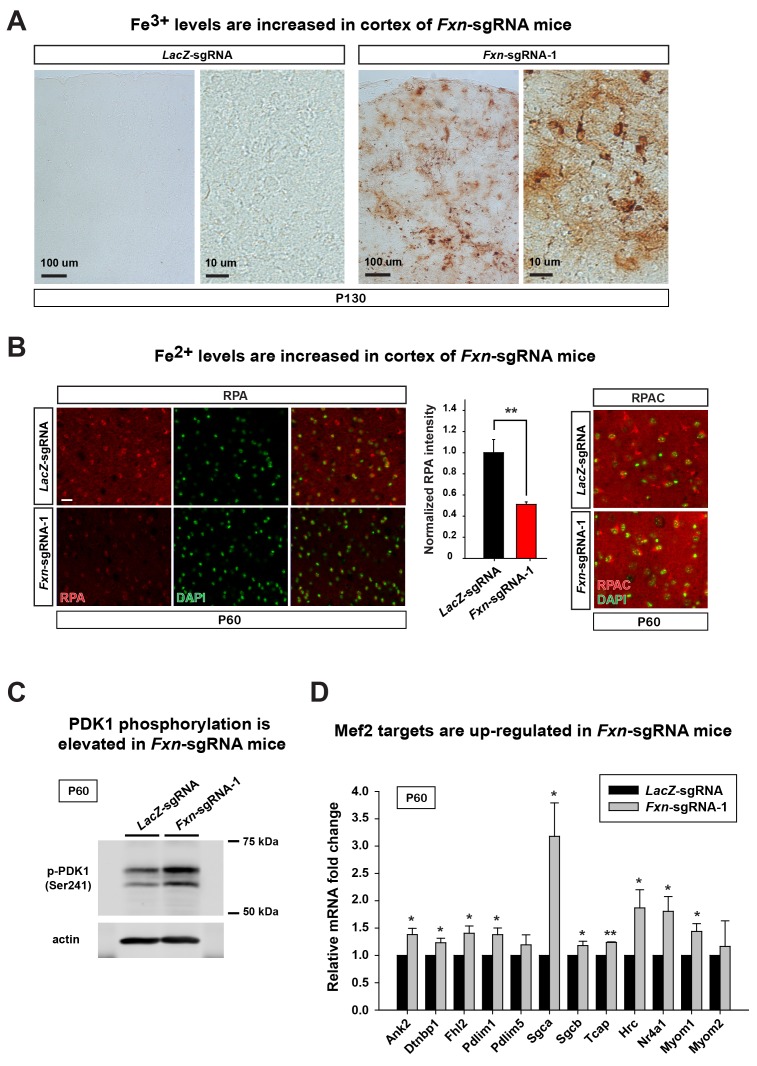
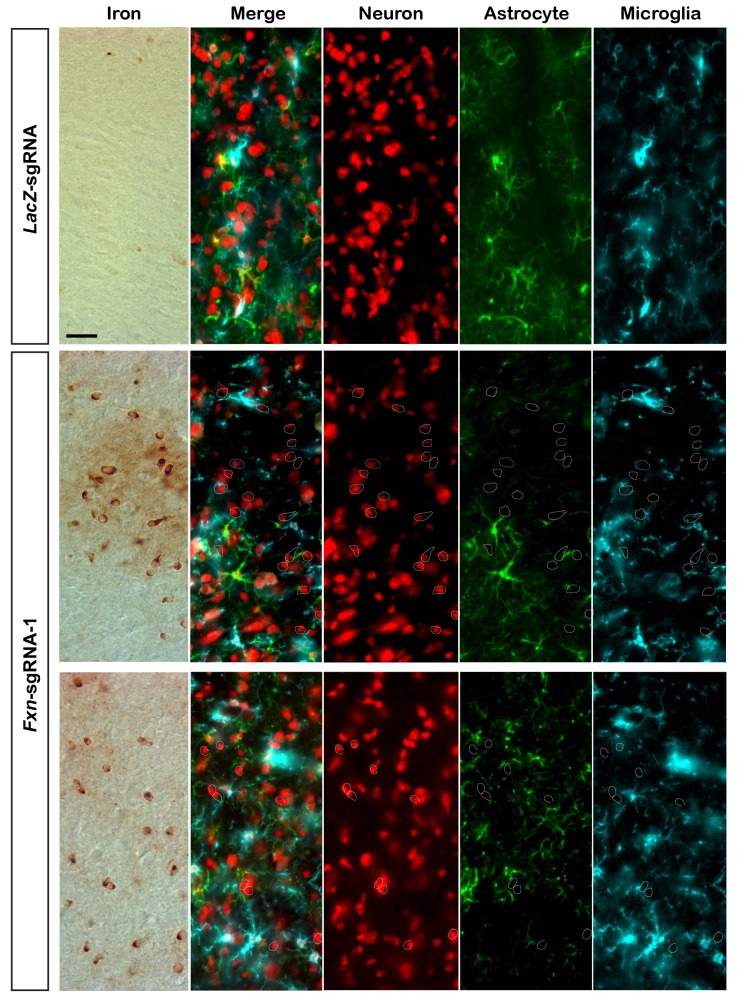
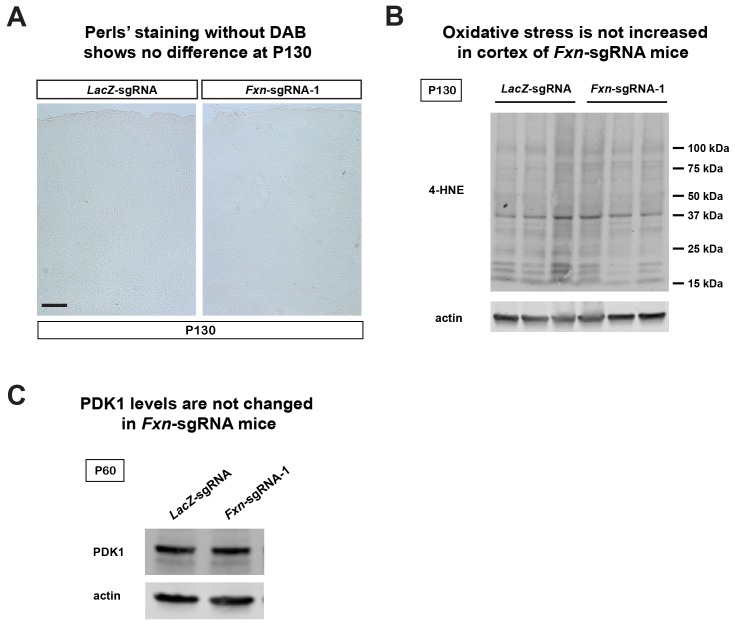
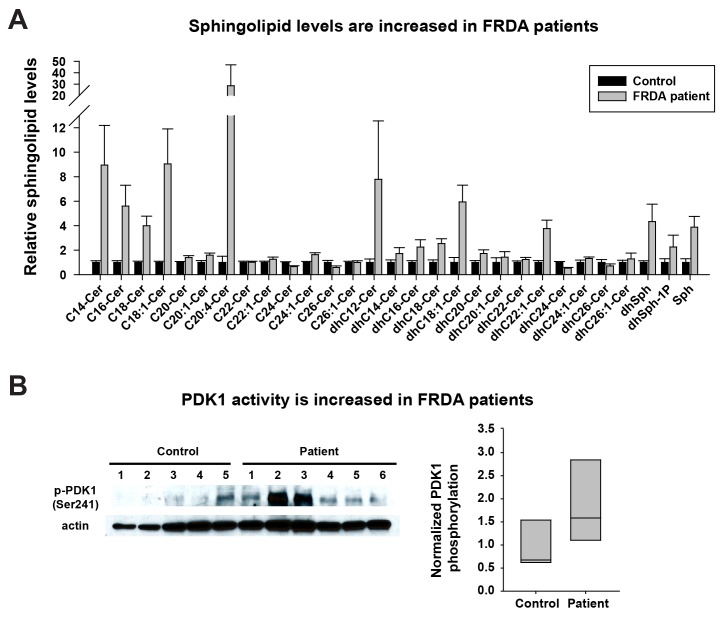
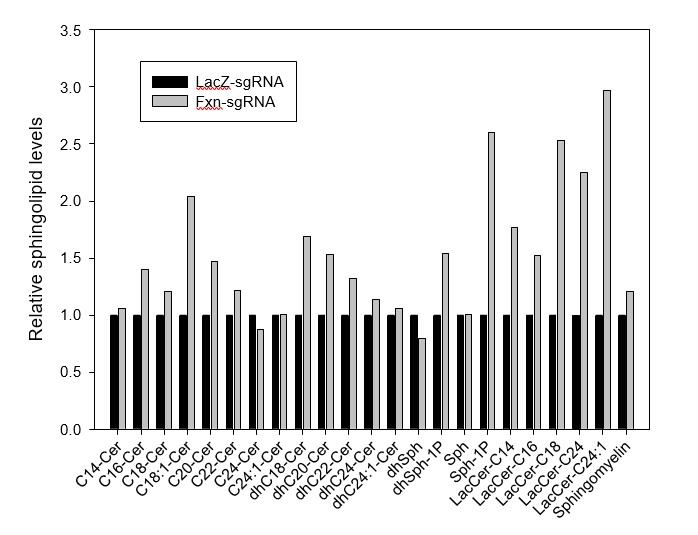
Friedreich's ataxia (FRDA) is an autosomal recessive neurodegenerative disease caused by mutations in Frataxin (FXN). Loss of FXN causes impaired mitochondrial function and iron homeostasis. An elevated production of reactive oxygen species (ROS) was previously proposed to contribute to the pathogenesis of FRDA. We recently showed that loss of frataxin homolog (fh), a Drosophila homolog of FXN, causes a ROS independent neurodegeneration in flies (Chen et al., 2016). In fh mutants, iron accumulation in the nervous system enhances the synthesis of sphingolipids, which in turn activates 3-phosphoinositide dependent protein kinase-1 (Pdk1) and myocyte enhancer factor-2 (Mef2) to trigger neurodegeneration of adult photoreceptors. Here, we show that loss of Fxn in the nervous system in mice also activates an iron/sphingolipid/PDK1/Mef2 pathway, indicating that the mechanism is evolutionarily conserved. Furthermore, sphingolipid levels and PDK1 activity are also increased in hearts of FRDA patients, suggesting that a similar pathway is affected in FRDA.
Keywords: Frataxin; Friedreich's ataxia; Mef2; PDK1; human; iron; mouse; neuroscience; sphingolipid.
Conflict of interest statement
HJB: Reviewing editor, eLife. The other authors declare that no competing interests exist.
Figures
Similar articles
-
Loss of Frataxin induces iron toxicity, sphingolipid synthesis, and Pdk1/Mef2 activation, leading to neurodegeneration.Elife. 2016 Jun 25;5:e16043. doi: 10.7554/eLife.16043. Elife. 2016. PMID: 27343351 Free PMC article.
-
Posttranslational regulation of mitochondrial frataxin and identification of compounds that increase frataxin levels in Friedreich's ataxia.J Biol Chem. 2022 Jun;298(6):101982. doi: 10.1016/j.jbc.2022.101982. Epub 2022 Apr 25. J Biol Chem. 2022. PMID: 35472330 Free PMC article.
-
Friedreich's ataxia: the vicious circle hypothesis revisited.BMC Med. 2011 Oct 11;9:112. doi: 10.1186/1741-7015-9-112. BMC Med. 2011. PMID: 21985033 Free PMC article.
-
Neurodegeneration in Friedreich's ataxia: from defective frataxin to oxidative stress.Oxid Med Cell Longev. 2013;2013:487534. doi: 10.1155/2013/487534. Epub 2013 Jul 9. Oxid Med Cell Longev. 2013. PMID: 23936609 Free PMC article. Review.
-
An Overview of the Ferroptosis Hallmarks in Friedreich's Ataxia.Biomolecules. 2020 Oct 28;10(11):1489. doi: 10.3390/biom10111489. Biomolecules. 2020. PMID: 33126466 Free PMC article. Review.
Cited by
-
Inducible and reversible phenotypes in a novel mouse model of Friedreich's Ataxia.Elife. 2017 Dec 19;6:e30054. doi: 10.7554/eLife.30054. Elife. 2017. PMID: 29257745 Free PMC article.
-
Mitochondrial Aconitase and Its Contribution to the Pathogenesis of Neurodegenerative Diseases.Int J Mol Sci. 2024 Sep 15;25(18):9950. doi: 10.3390/ijms25189950. Int J Mol Sci. 2024. PMID: 39337438 Free PMC article. Review.
-
Iron in Friedreich Ataxia: A Central Role in the Pathophysiology or an Epiphenomenon?Pharmaceuticals (Basel). 2018 Sep 19;11(3):89. doi: 10.3390/ph11030089. Pharmaceuticals (Basel). 2018. PMID: 30235822 Free PMC article. Review.
-
Unraveling Novel Mechanisms of Neurodegeneration Through a Large-Scale Forward Genetic Screen in Drosophila.Front Genet. 2019 Jan 14;9:700. doi: 10.3389/fgene.2018.00700. eCollection 2018. Front Genet. 2019. PMID: 30693015 Free PMC article. Review.
-
Skin fibroblast metabolomic profiling reveals that lipid dysfunction predicts the severity of Friedreich's ataxia.J Lipid Res. 2022 Sep;63(9):100255. doi: 10.1016/j.jlr.2022.100255. Epub 2022 Jul 16. J Lipid Res. 2022. PMID: 35850241 Free PMC article.
References
-
- Alonso-Montes C, Naves-Diaz M, Fernandez-Martin JL, Rodriguez-Reguero J, Moris C, Coto E, Cannata-Andia JB, Rodriguez I. New polymorphisms in human MEF2C gene as potential modifier of hypertrophic cardiomyopathy. Molecular Biology Reports. 2012;39:8777–8785. doi: 10.1007/s11033-012-1740-7. - DOI - PubMed
-
- Anderson JP, Dodou E, Heidt AB, De Val SJ, Jaehnig EJ, Greene SB, Olson EN, Black BL. HRC is a direct transcriptional target of MEF2 during cardiac, skeletal, and arterial smooth muscle development in vivo. Molecular and Cellular Biology. 2004;24:3757–3768. doi: 10.1128/MCB.24.9.3757-3768.2004. - DOI - PMC - PubMed
MeSH terms
Substances
Grants and funding
LinkOut - more resources
Full Text Sources
Other Literature Sources
Medical
Miscellaneous
