

Identification of a novel Polo-like kinase 1 inhibitor that specifically blocks the functions of Polo-Box domain
- PMID: 27902479
- PMCID: PMC5352051
- DOI: 10.18632/oncotarget.13603
Identification of a novel Polo-like kinase 1 inhibitor that specifically blocks the functions of Polo-Box domain
Abstract
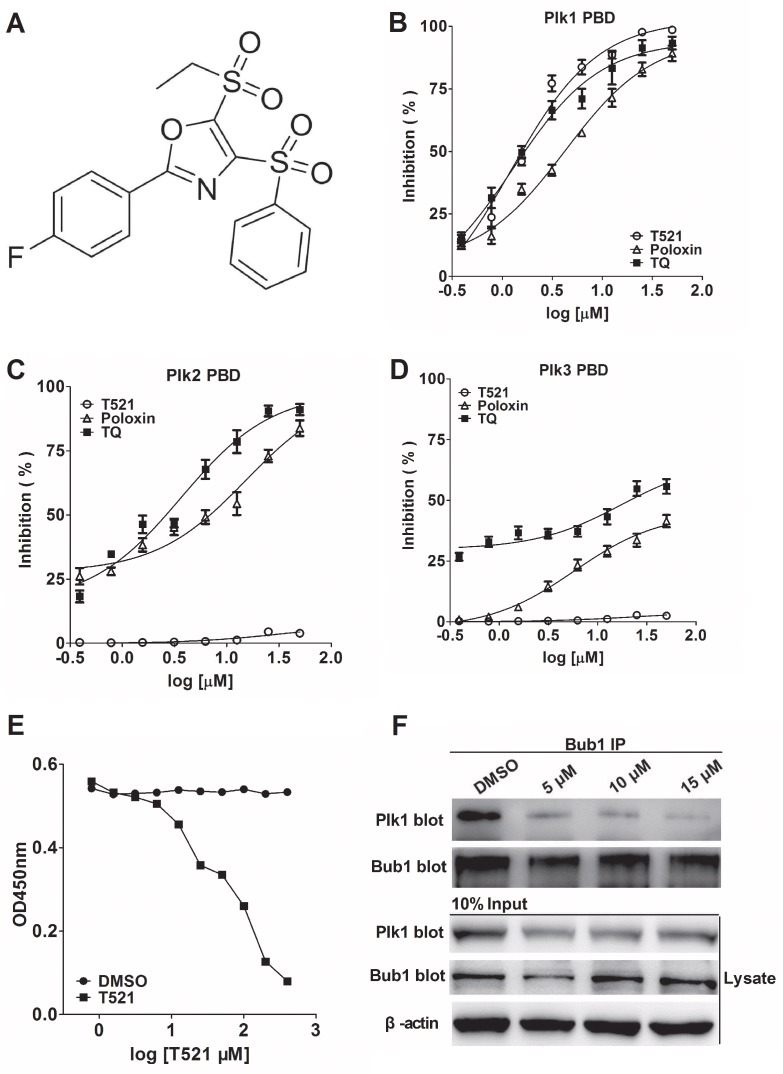
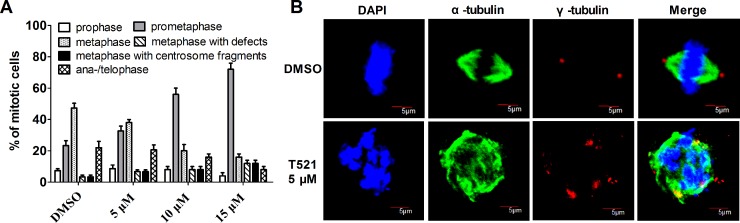
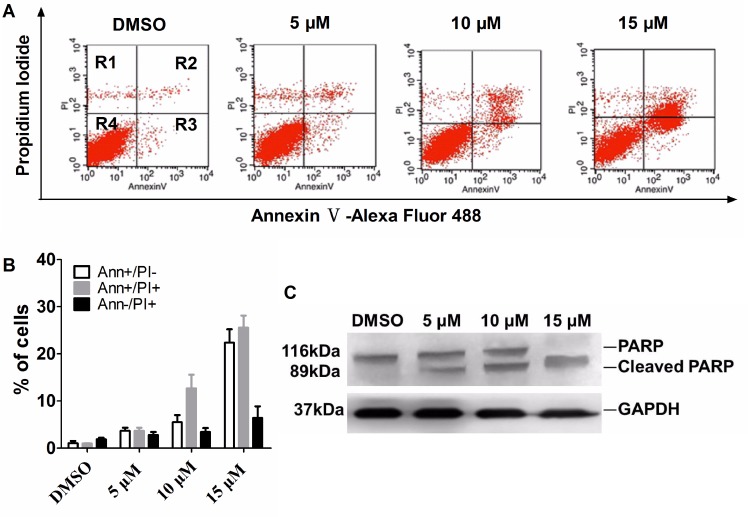
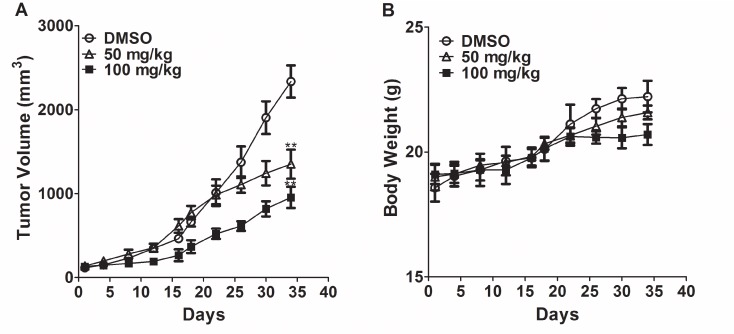
Polo-like kinase 1 (Plk1) is a promising target for cancer therapy due to its essential role in cell division. In addition to a highly conserved kinase domain, Plk1 also contains a Polo-Box domain (PBD), which is essential for Plk1's subcellular localization and mitotic functions. We adopted a fluorescence polarization assay and identified a new Plk1 PBD inhibitor T521 from a small-molecule compound library. T521 specifically inhibits the PBD of Plk1, but not those of Plk2-3. T521 exhibits covalent binding to some lysine residues of Plk1 PBD, which causes significant changes in the secondary structure of Plk1 PBD. Using a cell-based assay, we showed that T521 impedes the interaction between Plk1 and Bub1, a mitotic checkpoint protein. Moreover, HeLa cells treated with T521 exhibited dramatic mitotic defects. Importantly, T521 suppresses the growth of A549 cells in xenograft nude mice. Taken together, we have identified a novel Plk1 inhibitor that specifically disrupts the functions of Plk1 PBD and shows anticancer activity.
Keywords: Polo-Box domain; Polo-like kinase 1 inhibitor; cancer therapy; fluorescence polarization; protein-protein interactions.
Conflict of interest statement
The authors have no competing interests to declare.
Figures
Similar articles
-
Design, synthesis and evaluation of d-amino acid-containing peptidomimetics targeting the polo-box domain of polo-like kinase 1.Bioorg Chem. 2019 Apr;85:534-540. doi: 10.1016/j.bioorg.2019.02.022. Epub 2019 Feb 11. Bioorg Chem. 2019. PMID: 30807896
-
Design and synthesis of a cell-permeable, drug-like small molecule inhibitor targeting the polo-box domain of polo-like kinase 1.PLoS One. 2014 Sep 11;9(9):e107432. doi: 10.1371/journal.pone.0107432. eCollection 2014. PLoS One. 2014. PMID: 25211362 Free PMC article.
-
Development of a High-Throughput Assay for Inhibitors of the Polo-Box Domain of Polo-Like Kinase 1 Based on Time-Resolved Fluorescence Energy Transfer.Biol Pharm Bull. 2017;40(9):1454-1462. doi: 10.1248/bpb.b17-00283. Biol Pharm Bull. 2017. PMID: 28867728
-
Inhibitors of the Polo-Box Domain of Polo-Like Kinase 1.Chembiochem. 2016 Apr 15;17(8):650-6. doi: 10.1002/cbic.201500580. Epub 2016 Jan 29. Chembiochem. 2016. PMID: 26662918 Review.
-
[Mining Polo-Box domain of Polo-like kinase 1 as a new therapeutic target for cancer].Sheng Wu Gong Cheng Xue Bao. 2020 Nov 25;36(11):2298-2312. doi: 10.13345/j.cjb.200132. Sheng Wu Gong Cheng Xue Bao. 2020. PMID: 33244925 Review. Chinese.
Cited by
-
Current progress and future perspectives in the development of anti-polo-like kinase 1 therapeutic agents.F1000Res. 2017 Jun 29;6:1024. doi: 10.12688/f1000research.11398.1. eCollection 2017. F1000Res. 2017. PMID: 28721210 Free PMC article. Review.
-
Identification of a New Heterocyclic Scaffold for Inhibitors of the Polo-Box Domain of Polo-like Kinase 1.J Med Chem. 2020 Nov 25;63(22):14087-14117. doi: 10.1021/acs.jmedchem.0c01669. Epub 2020 Nov 11. J Med Chem. 2020. PMID: 33175530 Free PMC article.
-
IMB-T130 targets 3-dehydroquinate synthase and inhibits Mycobacterium tuberculosis.Sci Rep. 2018 Nov 28;8(1):17439. doi: 10.1038/s41598-018-35701-z. Sci Rep. 2018. PMID: 30487577 Free PMC article.
-
A robust high-throughput fluorescence polarization assay for rapid screening of SARS-CoV-2 papain-like protease inhibitors.Virology. 2022 Sep;574:18-24. doi: 10.1016/j.virol.2022.07.006. Epub 2022 Jul 16. Virology. 2022. PMID: 35870326 Free PMC article.
-
Low BUB1 expression is an adverse prognostic marker in gastric adenocarcinoma.Oncotarget. 2017 Jul 18;8(44):76329-76339. doi: 10.18632/oncotarget.19357. eCollection 2017 Sep 29. Oncotarget. 2017. PMID: 29100315 Free PMC article.
References
-
- Archambault V, Glover DM. Polo-like kinases: conservation and divergence in their functions and regulation. Nat Rev Mol Cell Biol. 2009;10:265–75. - PubMed
-
- Lowery DM, Lim D, Yaffe MB. Structure and function of Polo-like kinases. Oncogene. 2005;24:248–59. - PubMed
-
- Elia AE, Cantley LC, Yaffe MB. Proteomic screen finds pSer/pThr-binding domain localizing Plk1 to mitotic substrates. Science. 2003;299:1228–31. - PubMed
-
- Elia AE, Rellos P, Haire LF, Chao JW, Ivins FJ, Hoepker K, Mohammad D, Cantley LC, Smerdon SJ, Yaffe MB. The molecular basis for phosphodependent substrate targeting and regulation of Plks by the Polo-box domain. Cell. 2003;115:83–95. - PubMed
MeSH terms
Substances
Grants and funding
LinkOut - more resources
Full Text Sources
Other Literature Sources
Miscellaneous
