

doi: 10.1088/1478-3975/13/6/066007.
Effects of cell cycle noise on excitable gene circuits
Affiliations
- PMID: 27902489
- PMCID: PMC5498228
- DOI: 10.1088/1478-3975/13/6/066007
Item in Clipboard
Effects of cell cycle noise on excitable gene circuits
Phys Biol.
.
Abstract
We assess the impact of cell cycle noise on gene circuit dynamics. For bistable genetic switches and excitable circuits, we find that transitions between metastable states most likely occur just after cell division and that this concentration effect intensifies in the presence of transcriptional delay. We explain this concentration effect with a three-states stochastic model. For genetic oscillators, we quantify the temporal correlations between daughter cells induced by cell division. Temporal correlations must be captured properly in order to accurately quantify noise sources within gene networks.
Figures

Different models of the cell cycle. (A) A single cell gives rise to a lineage. Copies of a dynamic genetic network (in this case an oscillator, [44]) are passed to the daughter cells upon division. Oscillations persist along the lineage. (B) Fluorescence traces recorded from different cells show how each trajectory branches into two at cell division [51]. Random partitioning of cellular material at cell division initiates the branching process. (CD) When modeling cell growth and division explicitly, cell volume grows exponentially before being halved at the time of division. The trajectory of a representative cell (bold in C) is shown in D. (EF) In the dilution modeling framework, a single compartment that grows indefinitely represents the population. A fixed subvolume of this compartment (bold in E) represents the average behavior of cells in the population.

Effects of cell cycle noise on constitutive protein production for different values of 〈x〉 = α/γ (blue: 〈x〉 = 100, red: 〈x〉 = 150, green: 〈x〉 = 200). (A) CV of protein concentration as a function of volume (filled circles). The CV is highest early in the cell cycle and decreases as the cell grows. The solid curves show best fits to simulations using a function proportional to (〈x〉Ω)−1/2. (B) Removing binomial partitioning noise reduces CV magnitude and significantly reduces the amount the CV varies over the cell cycle, the latter by about an order of magnitude (0.02 for the curves in (A) versus 0.002 for the curves in (B)). Number of simulations is 30,000 cell cycles per curve.
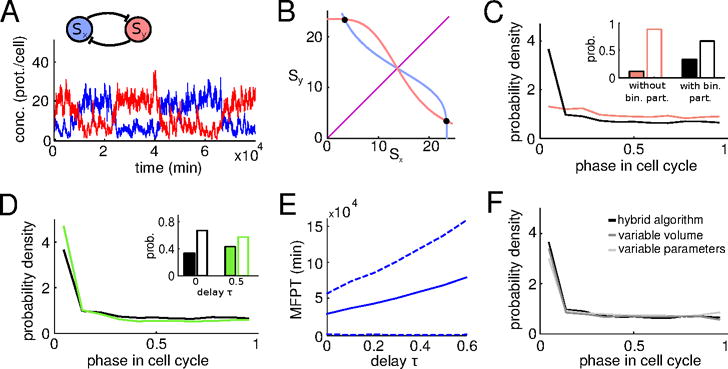
Effects of cell growth and division on a co-repressive toggle switch. (A) Network diagram and typical dynamics of the stochastic system displaying transitions between two metastable states. (B) Phase portrait in the deterministic limit: nullclines (blue and red curves), stable steady states (solid circles), and unstable manifold of the saddle point (purple). (C) Probability density of transitions between metastable states within the cell cycle. Transitions most likely occur right after cell division (black curve). Removing partitioning noise by equally dividing proteins upon cell division results in a much more uniform transition probability distribution (red curve). Filled bars: Prob(ϕ ≤ 0.1), empty bars: Prob(ϕ > 0.1), where ϕ denotes cell cycle phase. (D) Delay in protein production increases the probability that a transition occurs just after cell division. Delay values: τ = 0 (black), τ = 0.5 (green). Filled bars: Prob(ϕ ≤ 0.1), empty bars: Prob(ϕ > 0.1). (E) Mean first passage time as a function of delay. As delay in protein production increases, the metastable states become more stable. We multiply the birth propensity function f by eγτ to ensure that the dynamics of the switch may be fairly compared as τ varies (see [35] for an explanation). Other parameter values: α = 16.25, k = 4, β = 15, γ = ln(2). Dashed lines show the standard deviation around the mean first passage time. (F) The effects observed in panels C and D are robust with respect to modeling variations. We compare the black PDF from panels C and D to PDFs obtained by either varying the volumetric cell division threshold randomly between division events or resampling system parameters upon division. (See Section 8.3 for modeling alternatives.) Number of simulated transitions between steady states per time delay is 10,000.

Effects of cell growth and division on an excitable system. (A) Network diagram and typical dynamics exhibiting sporadic pulses. (B) Phase portrait in the deterministic limit: Nullclines (blue and red curves), the stable steady state (solid circle), and a deterministic trajectory that makes an excursion around the unstable points before returning to the stable steady state (black curve). (C) The probability density of pulse times within the cell cycle shows that pulses are more likely soon after cell division (black curve). With equal division of proteins at cell division, the PDF becomes more uniform (red curve). Filled bars: Prob(ϕ ≤ 0.1), empty bars: Prob(ϕ > 0.1). (D) Delay in protein production increases the probability that a pulse occurs just after cell division. Filled bars: Prob(ϕ ≤ 0.1), empty bars: Prob(ϕ > 0.1). (E) Mean time between pulses as a function of delay. As delay in protein production increases, pulses become significantly less frequent. We again multiply the birth propensity functions f1 and f2by eγτ for fair comparison (see [35]). Other parameters: α1 = 4.5, α2 = 12, β1 = 5400, β2 = 600, k1 = 240, k2= 180, n = 2, p = 5, δ = 0.04, γ = ln(2). Dashed lines show the standard deviation around the mean first passage time. (F) The effects observed in panels C and D are robust with respect to modeling variations. We compare the black PDF from panels C and D to PDFs obtained by either varying the volumetric cell division threshold randomly between division events or resampling system parameters upon division. (See Section 8.3 for modeling alternatives.) Number of simulated noise-induced pulses per time delay is 10,000.
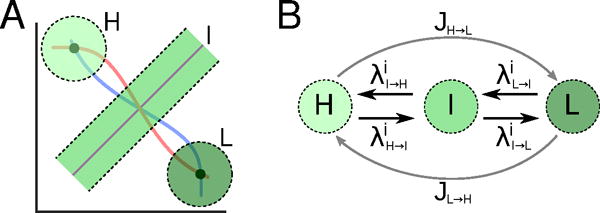
3-states model for the co-repressive toggle switch. (A) States H and L correspond to disks around the metastable points. State I corresponds to a tube around the unstable manifold of the saddle point. (B) Continuous-time transition rates model transitions caused by chemical reaction noise (black arrows). Jumps at cell division times model transitions due to partitioning noise (gray arrows).

Effects of cell cycle noise on correlations for constitutive protein production. (A) Protein concentrations in daughter cells are highly correlated just after cell division, and decorrelate as the daughter cells grow. (B) Concentrations in daughter cells are anti- correlated with respect to the mother cell. Due to random partitioning of proteins at cell division, initial protein concentration in one daughter cell will be higher than that of the mother cell (see inset). Initial concentration in the other daughter cell will be lower than that of the mother cell. Parameter values are γ = ln(2), α1 = 10γ and α2 = 50γ, so that mean protein concentrations are 〈x〉 = 10 and 〈y〉 = 500. Number of simulations is 30,000 cell cycles.

Effects of cell growth and division on a synthetic genetic oscillator. (A) Network diagram and traces. The stochastic system oscillates with varying period and amplitude. (BC) Probability density functions for amplitude and period. Comparing with dilution modeling, explicit cell growth and division modeling reduces the variability in amplitude and period from 0.55 and 0.17 (CV) to 0.52 and 0.15, respectively. Values are normalized so that the mean is 1. (D) Correlation between sister cells after cell division. Comparing with dilution modeling, explicit cell growth and division modeling significantly reduces the correlation between sister cells after division. Dashed lines mark the standard deviation using bootstrapping resampling 10,000 times. Parameters: α = 0.06, k1 = 0.08, k2 = 0.34, β1 = 30, β2 = 6.25, β3 = 60, δ1 = 2.4, δ2 = 0.8, δ3 = 4.8, R0 = 0.0046, γ = 0.03 min−1. Delay values (minutes): τ1 = 5.5, τ2 = 6.0, τ3 = 5.0. Number of simulations: 30,000 cell cycles.

Explicit cell growth and division modeling. (A) Between cell division events, we simulate the reaction network using the dSSA with time-varying volume Ω(t). When a cell divides, we partition proteins and the contents of the queues between the two daughter cells. We can track the dynamics along one lineage (black cells), or along multiple lineages (black and gray cells). (B) Sample trajectories for a system in equilibrium. Cell volume Ω(t) grows exponentially between cell division events and resets at the moment of division (gray curve). Protein number X (t) suddenly drops at the moment of cell division due to binomial partitioning (blue curve). Protein concentration x(t) = X(t)/Ω(t) is shown in black.
Similar articles
-
Modeling the effect of cell division on genetic oscillators.J Theor Biol. 2013 May 21;325:22-33. doi: 10.1016/j.jtbi.2013.02.001. Epub 2013 Feb 20. J Theor Biol. 2013. PMID: 23434891
-
The transition between stochastic and deterministic behavior in an excitable gene circuit.PLoS One. 2012;7(4):e34536. doi: 10.1371/journal.pone.0034536. Epub 2012 Apr 11. PLoS One. 2012. PMID: 22509317 Free PMC article.
-
Regime shifts driven by dynamic correlations in gene expression noise.Phys Rev E. 2017 Aug;96(2-1):022409. doi: 10.1103/PhysRevE.96.022409. Epub 2017 Aug 18. Phys Rev E. 2017. PMID: 28950646
-
Distinguishing between stochasticity and determinism: Examples from cell cycle duration variability.Bioessays. 2016 Jan;38(1):8-13. doi: 10.1002/bies.201500113. Epub 2015 Dec 2. Bioessays. 2016. PMID: 26628302 Review.
-
Stochastic and delayed stochastic models of gene expression and regulation.Math Biosci. 2010 Jan;223(1):1-11. doi: 10.1016/j.mbs.2009.10.007. Epub 2009 Oct 31. Math Biosci. 2010. PMID: 19883665 Review.
Cited by
-
Bistability and oscillations in co-repressive synthetic microbial consortia.Quant Biol. 2017 Mar;5(1):55-66. doi: 10.1007/s40484-017-0100-y. Epub 2017 Mar 30. Quant Biol. 2017. PMID: 28713623 Free PMC article.
-
Circuit-Host Coupling Induces Multifaceted Behavioral Modulations of a Gene Switch.Biophys J. 2018 Feb 6;114(3):737-746. doi: 10.1016/j.bpj.2017.12.010. Biophys J. 2018. PMID: 29414718 Free PMC article.
-
Genetic toggle switch controlled by bacterial growth rate.BMC Syst Biol. 2017 Dec 2;11(1):117. doi: 10.1186/s12918-017-0483-4. BMC Syst Biol. 2017. PMID: 29197392 Free PMC article.
References
-
- Acar M, Mettetal JT, van Oudenaarden A. Stochastic switching as a survival strategy in fluctuating environments. Nature Genetics. 2015;40:471–475. - PubMed
-
- Becskei A, Kaufmann BB, Van Oudenaarden A. Contributions of low molecule number and chromosomal positioning to stochastic gene expression. Nat Genet. 2005;37:937–944. - PubMed
Publication types
MeSH terms
Substances
Grants and funding
LinkOut - more resources
Full Text Sources
Other Literature Sources