doi: 10.1001/jamacardio.2016.4396.
Trends in Total Cholesterol, Triglycerides, and Low-Density Lipoprotein in US Adults, 1999-2014
Affiliations
- PMID: 27902824
- PMCID: PMC7388068
- DOI: 10.1001/jamacardio.2016.4396
Item in Clipboard
Trends in Total Cholesterol, Triglycerides, and Low-Density Lipoprotein in US Adults, 1999-2014
JAMA Cardiol.
.
Erratum in
-
Error in Author Affiliation and Results.JAMA Cardiol. 2017 Mar 1;2(3):346. doi: 10.1001/jamacardio.2016.5663. JAMA Cardiol. 2017. PMID: 28052156 No abstract available.
No abstract available
Conflict of interest statement
Figures
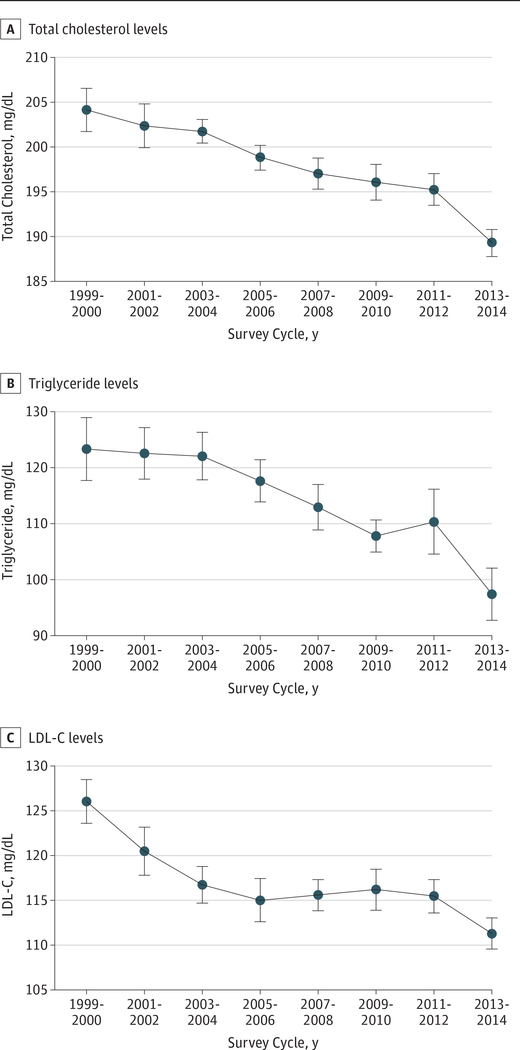
A, Predicted total cholesterol levels and 95% confidence intervals in a sample size of 39 049. B, Predicted log-transformed triglyceride levels and 95% confidence intervals; log-transformed values were exponentiated after the regression, sample size of 17 406. C, Predicted LDL-C levels and 95% confidence intervals in a sample size of 17 096. Figure generated using marginal standardization from age-adjusted linear regression models. Data source: Centers for Disease Control and Prevention/National Center for Health Statistics, the National Health and Nutrition Examination Survey. SI conversion factors: To convert LDL-C to micromoles per liter, multiply by 0.0259; to convert total cholesterol to micromoles per liter, multiply by 0.0259; to convert triglycerides to micromoles per liter, multiply by 0.0113.
References
-
- Expert Panel on Detection, Evaluation, and Treatment of High Blood Cholesterol in Adults. Executive summary of the third report of the national cholesterol education program (NCEP) expert panel on detection, evaluation, and treatment of high blood cholesterol in adults (adult treatment panel iii). JAMA. 2001;285(19):2486–2497. - PubMed
-
- Carroll MD, Kit BK, Lacher DA, Shero ST, Mussolino ME. Trends in lipids and lipoproteins in US adults, 1988–2010. JAMA. 2012;308(15):1545–1554. - PubMed
-
- National Center for Health Statistics/Centers for Disease Control and Prevention. National Health and Nutrition Examination Survey: MEC laboratory procedures manual; http://www.cdc.gov/nchs/data/nhanes/nhanes_13_14/2013_MEC_Laboratory_Pro.... Published 2013 Accessed April 7, 2016.
Publication types
MeSH terms
Substances
Grants and funding
LinkOut - more resources
Full Text Sources
Other Literature Sources
Medical