Multicenter Study
. 2017 Jan 19;129(3):347-357.
doi: 10.1182/blood-2016-07-726307. Epub 2016 Nov 30.

Standardized flow cytometry for highly sensitive MRD measurements in B-cell acute lymphoblastic leukemia

Affiliations
Multicenter Study

Standardized flow cytometry for highly sensitive MRD measurements in B-cell acute lymphoblastic leukemia

Prisca Theunissen et al. Blood. .

Abstract

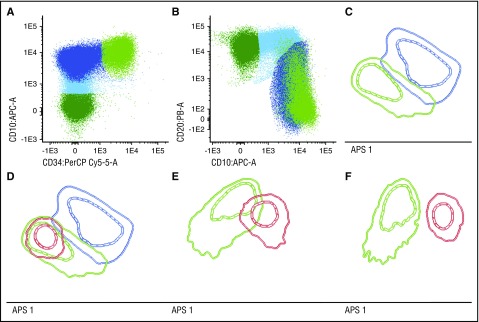
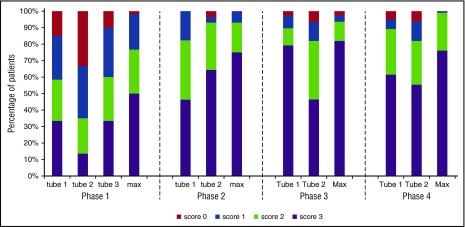
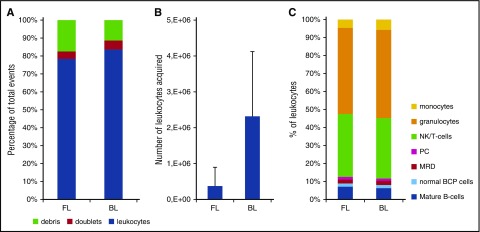
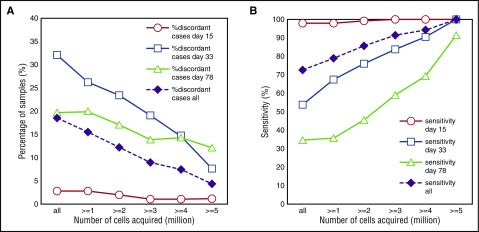
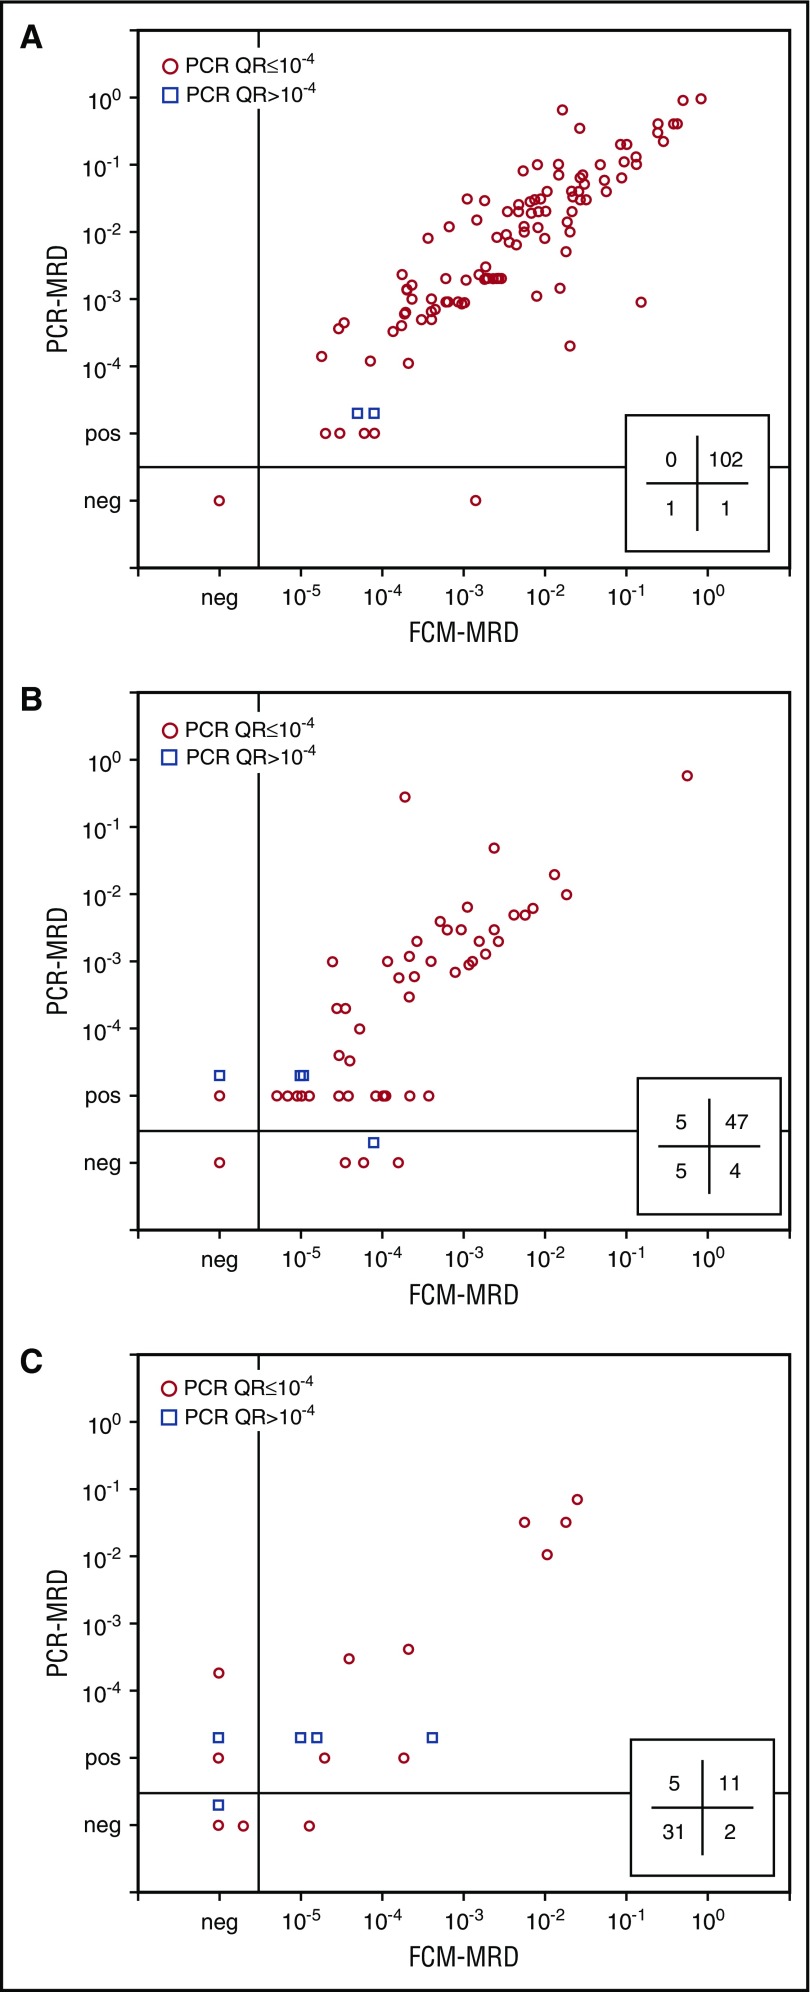
A fully-standardized EuroFlow 8-color antibody panel and laboratory procedure was stepwise designed to measure minimal residual disease (MRD) in B-cell precursor (BCP) acute lymphoblastic leukemia (ALL) patients with a sensitivity of ≤10-5, comparable to real-time quantitative polymerase chain reaction (RQ-PCR)-based MRD detection via antigen-receptor rearrangements. Leukocyte markers and the corresponding antibodies and fluorochromes were selected based on their contribution in separating BCP-ALL cells from normal/regenerating BCP cells in multidimensional principal component analyses. After 5 multicenter design-test-evaluate-redesign phases with a total of 319 BCP-ALL patients at diagnosis, two 8-color antibody tubes were selected, which allowed separation between normal and malignant BCP cells in 99% of studied patients. These 2 tubes were tested with a new erythrocyte bulk-lysis protocol allowing acquisition of high cell numbers in 377 bone marrow follow-up samples of 178 BCP-ALL patients. Comparison with RQ-PCR-based MRD data showed a clear positive relation between the percentage concordant cases and the number of cells acquired. For those samples with >4 million cells acquired, concordant results were obtained in 93% of samples. Most discordances were clarified upon high-throughput sequencing of antigen-receptor rearrangements and blind multicenter reanalysis of flow cytometric data, resulting in an unprecedented concordance of 98% (97% for samples with MRD < 0.01%). In conclusion, the fully standardized EuroFlow BCP-ALL MRD strategy is applicable in >98% of patients with sensitivities at least similar to RQ-PCR (≤10-5), if sufficient cells (>4 × 10⁶, preferably more) are evaluated.


Figures

Figure 1.
Figure 1.
Data analysis strategy used to optimize the antibody panel for distinguishing between BCP-ALL cells and their nearest normal/reactive BCP counterpart. First, multiple normal/reactive BM samples and/or regenerating BM samples were merged (phase 1: n = 7; phase 2: n = 11; phase 3: n = 14; phase 4: n = 10) and CD19-positive B cells were selected. These were subdivided into 4 B-cell subsets, based on the backbone markers (CD19/CD10/CD20/CD34/CD45): CD34+ pre–B-I cells (light green), CD34/CD10+/CD20 to dim pre–B-II/immature cells (dark blue), CD34/CD10+/CD20+ immature/transitional B cells (light blue), and CD34/CD10/CD20+ mature B cells (dark green). Dot plots of CD34 vs CD10 (A) and CD10 vs CD20 (B) are shown. The 1 standard deviation (SD) (dashed line) and 2 SD lines (solid line) of the 2 most immature BCP subsets (pre–B-I [light green] and pre–B-II/immature [dark blue]) were displayed in an APS view, which was subsequently fixed (supervised; C). Each individual BCP-ALL case was added to the fixed APS plot, and the normal BCP population nearest to each of the BCP-ALL populations was defined (D). The BCP-ALL cells and nearest normal BCP subset were then visualized in a separate (nonfixed and balanced) APS plot, 1 using the backbone markers only (E) and 1 using all 8 markers (F), by plotting the 1 SD curve and 2 SD curves of the 2 populations. To prevent an influence of the number of cells on the principal component analysis (PCA), we opted to use a balanced PCA, implying a fixed ratio between normal and pathological events. Finally, the separation between the 2 populations was scored based on: no overlap between 2 SD curves: 3 points; overlap of the 2 SD curves: 2 points; overlap of the 2 SD and the 1 SD curve: 1 point; overlap of both 1 SD curves: 0 points. An example of this scoring is shown in supplemental Figure 1. It should be noted that the above described strategy was only used for optimizing the antibody panel for the BCP-ALL MRD tubes and not for actual MRD analyses.
Figure 2.
Figure 2.
Power to distinguish BCP-ALL cells from their nearest normal BCP counterpart using the EuroFlow BCP-ALL MRD tubes. Data reflect the percentage of patients that reached the specified score, obtained as described in supplemental Figure 1. Briefly, for each patient, BCP-ALL cells and their nearest normal BCP subset were visualized in a (nonfixed and balanced) APS plot showing the median, 1 SD curves, and 2 SD curves for both populations. Each patient was subsequently scored as follows: no overlap between 2 SD curves: 3 points; overlap of the 2 SD curves: 2 points; overlap of the 2 SD and the 1 SD curve: 1 point; overlap of both 1 SD curves: 0 points. Max, the maximal score of the individual tubes. Phase 1: 7 normal/reactive BM samples and 61 BCP-ALL patients; phase 2: 7 normal BM samples, 4 regenerating BM samples, and 28 BCP-ALL patients; phase 3: 5 normal/reactive BM samples, 9 regenerating BM samples, and 78 BCP-ALL patients; phase 4: 10 normal/reactive BM samples and 83 BCP-ALL patients.
Figure 3.
Figure 3.
Evaluation of the EuroFlow bulk-lysis protocol. For reasons of comparison, each of the BM samples (day 15: n = 15; day 33: n = 15; day 78: n = 12) was processed according to the standard EuroFlow protocol (FL) and in parallel according to the EuroFlow bulk-lysis protocol (BL). (A) Number of leukocytes, debris, and doublets, calculated as percentage of acquired events. Using the bulk-lysis method, significantly less debris (P = .032 by paired Student t test) and significantly more leukocytes (P = .03 by paired Student t test) were measured. There were no significant differences between the 2 methods for the percentage of doublets. (B) Absolute number of leukocytes acquired. Using BL, on average 12-fold more leukocytes could be acquired (P < .0001). Please note that we included relatively many day 15 samples in order to be able to evaluate the impact of the 2 methods on the MRD levels as well. However, these day 15 samples generally have a very low white blood cell count; consequently, the number of leukocytes acquired after BL is still relatively low in a subset of samples. (C) Distribution of leukocyte subpopulations, defined as percentage of leukocytes. By paired Student t test (2-sided), small but statistically significant differences were observed for T/NK cells (mean: 24% vs 26%, P = .0047), granulocytes (mean: 33% vs 38%, P < .001), and monocytes (mean: 3.2% vs 4.5%, P < .001), whereas no significant differences were observed for the remaining populations. Of note, in 2 samples, MRD was only detected using the bulk-lysis method (0.013% and 0.018%) but not using the whole BM method. In the 11 samples MRD positive by both methods, MRD levels were not significantly different from each other (paired Student t test: P = .30), with mean values of 6.3% and 6.7% by whole BM and bulk-lysed BM method, respectively. Correlation analysis showed a Spearman r of 0.964 (95% confidence interval: 0.857-0.991; P < .0001). PC, plasma cells.
Figure 4.
Figure 4.
Performance of FCM-MRD vs PCR-based MRD is dependent on the number of acquired cells. (A) The percentage of discordant cases by FCM-MRD and PCR-MRD is shown for individual time points (day 15, day 33, and day 78) as well as for all samples together. Data are presented for variable numbers of acquired cells: all samples (independent of cell number) and samples with at least 1, 2, 3, 4, or 5 million cells acquired. (B) The sensitivity of FCM-MRD relative to PCR-MRD is shown for individual time points (day 15, day 33, and day 78) as well as for all samples together. Data are presented for variable numbers of acquired cells: all samples (independent of cell number; n = 377) and samples with at least 1 (n = 330), 2 (n = 287), 3 (n = 255), 4 (n = 227), or 5 million cells (n = 191) acquired. Sensitivity is calculated as the number of samples positive by both FCM and PCR divided by the total number of samples positive by PCR (ie, the reference method).
Figure 5.
Figure 5.
Comparison of MRD data obtained by 8-color EuroFlow FCM and routinely obtained molecular MRD data. Flow cytometric MRD data were compared with molecular MRD data and are shown for samples obtained at day 15 (A), day 33 (B), or day 78 (C). In the lower right part of each panel, the number of FCM/PCR+, FCM+/PCR+, FCM+/PCR, and FCM/PCR is indicated. Only samples in which MRD could clearly be detected by FCM-MRD or samples which had sufficient cells acquired for reaching a sensitivity of ≤10−5 (ie, ≥ 4 × 10⁶ cells acquired) were included in the analyses. Based on a LOD of 10 events, the sensitivity of FCM-MRD was 2.5 × 10⁻⁶; the quantitative range (based on a LLOQ of 40 events) is 10−5. Consequently, FCM-MRD data between 2.5 × 10⁻⁶ and 10−5 should be considered positive, but are below the limit of quantitation.

Comment in

References

    1. Flohr T, Schrauder A, Cazzaniga G, et al. ; International BFM Study Group (I-BFM-SG). Minimal residual disease-directed risk stratification using real-time quantitative PCR analysis of immunoglobulin and T-cell receptor gene rearrangements in the international multicenter trial AIEOP-BFM ALL 2000 for childhood acute lymphoblastic leukemia. Leukemia. 2008;22(4):771-782. - PubMed
    1. van der Velden VH, Cazzaniga G, Schrauder A, et al. ; European Study Group on MRD detection in ALL (ESG-MRD-ALL). Analysis of minimal residual disease by Ig/TCR gene rearrangements: guidelines for interpretation of real-time quantitative PCR data. Leukemia. 2007;21(4):604-611. - PubMed
    1. van der Velden VH, van Dongen JJ. MRD detection in acute lymphoblastic leukemia patients using Ig/TCR gene rearrangements as targets for real-time quantitative PCR. Methods Mol Biol. 2009;538:115-150. - PubMed
    1. Basso G, Veltroni M, Valsecchi MG, et al. . Risk of relapse of childhood acute lymphoblastic leukemia is predicted by flow cytometric measurement of residual disease on day 15 bone marrow. J Clin Oncol. 2009;27(31):5168-5174. - PubMed
    1. Borowitz MJ, Wood BL, Devidas M, et al. . Prognostic significance of minimal residual disease in high risk B-ALL: a report from Children’s Oncology Group study AALL0232. Blood. 2015;126(8):964-971. - PMC - PubMed

Publication types

Substances

LinkOut - more resources