. 2016 Dec 5;215(5):687-703.
doi: 10.1083/jcb.201603079. Epub 2016 Nov 30.

EphA2 is a functional receptor for the growth factor progranulin

Affiliations

EphA2 is a functional receptor for the growth factor progranulin

Thomas Neill et al. J Cell Biol. .

Abstract

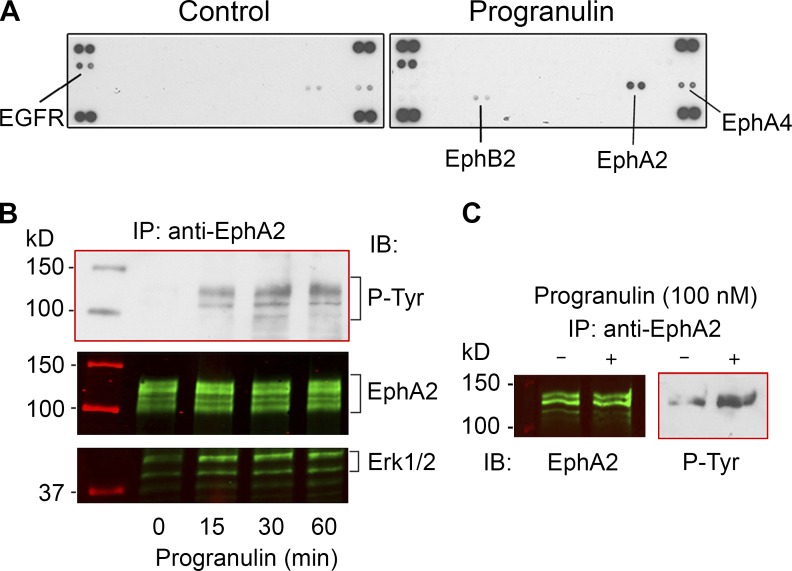
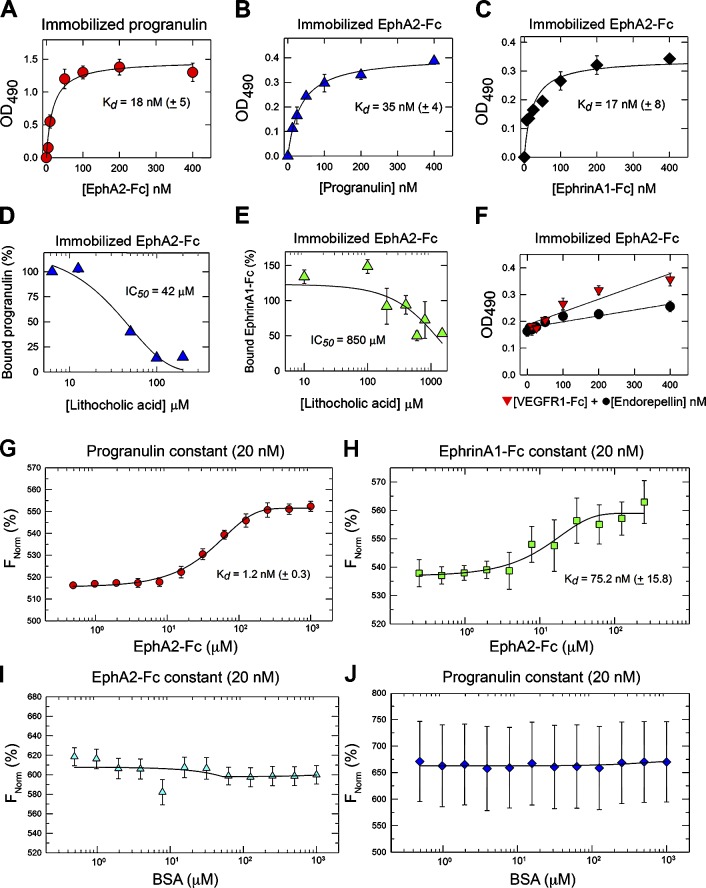
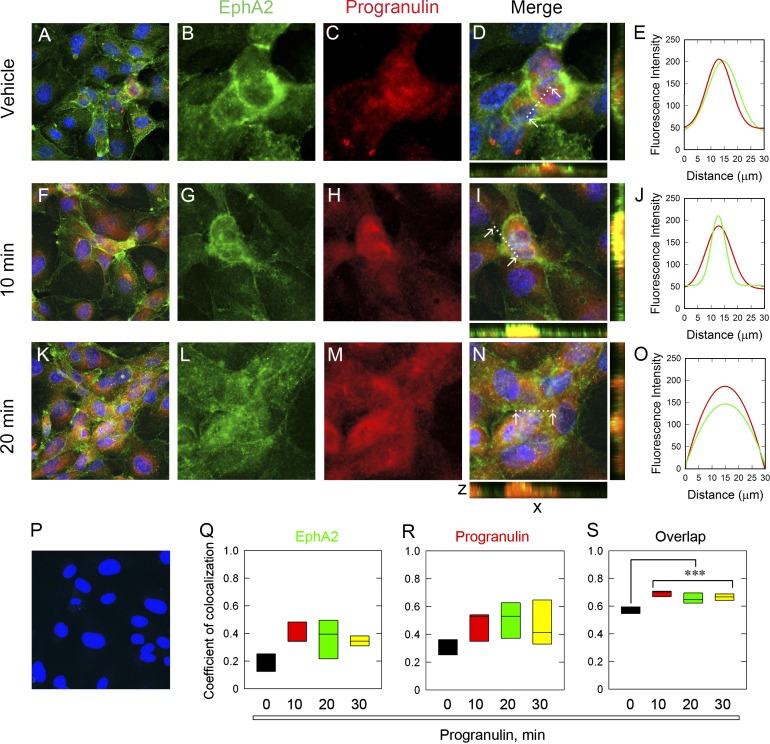
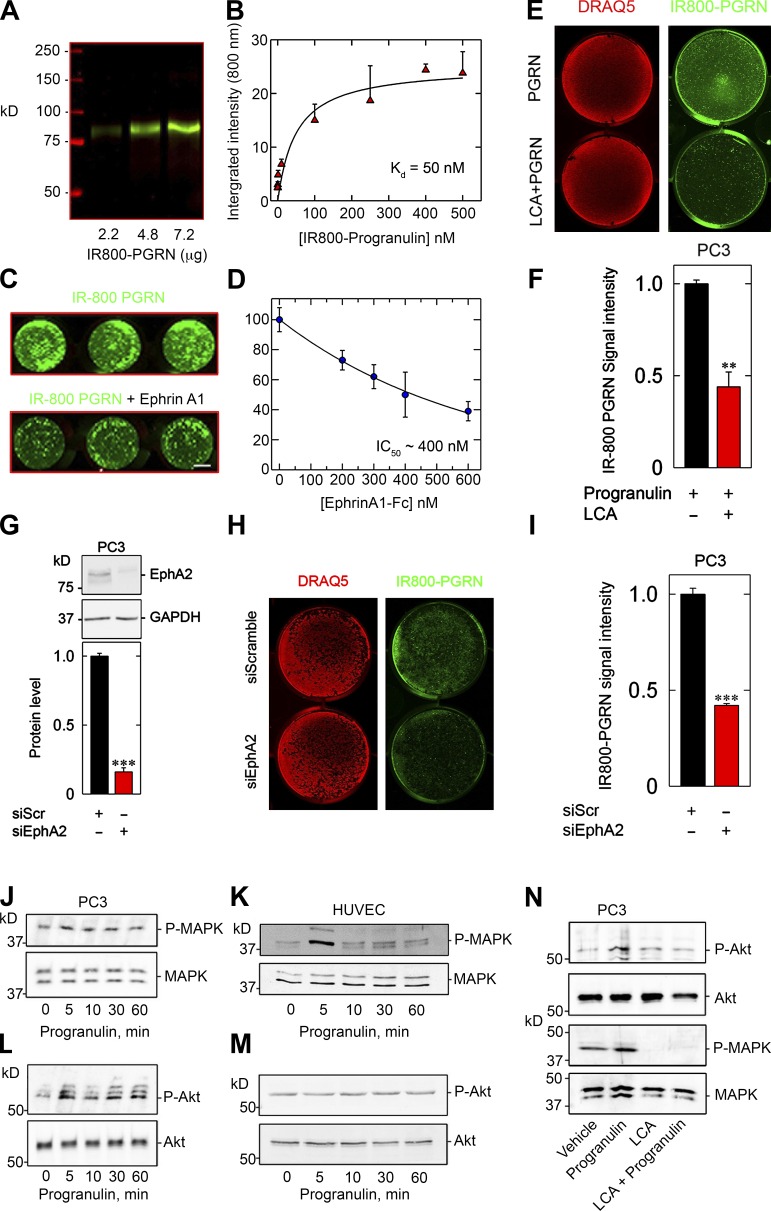
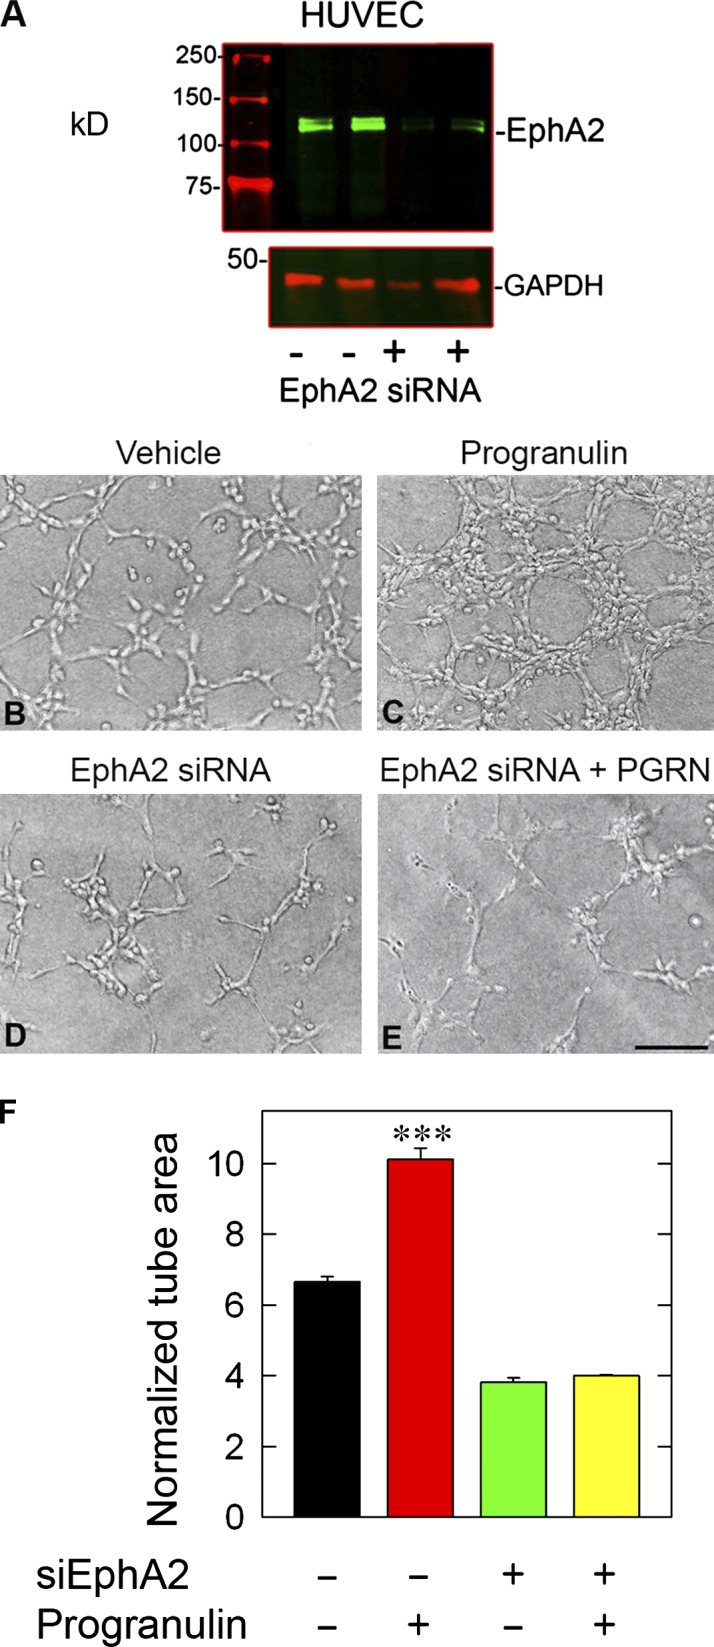
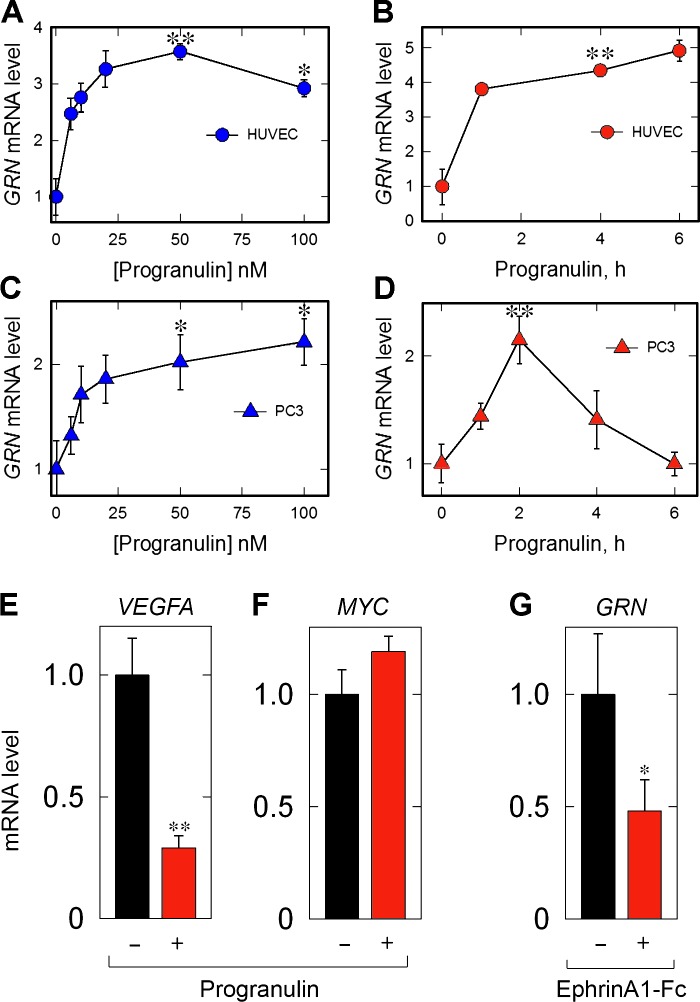
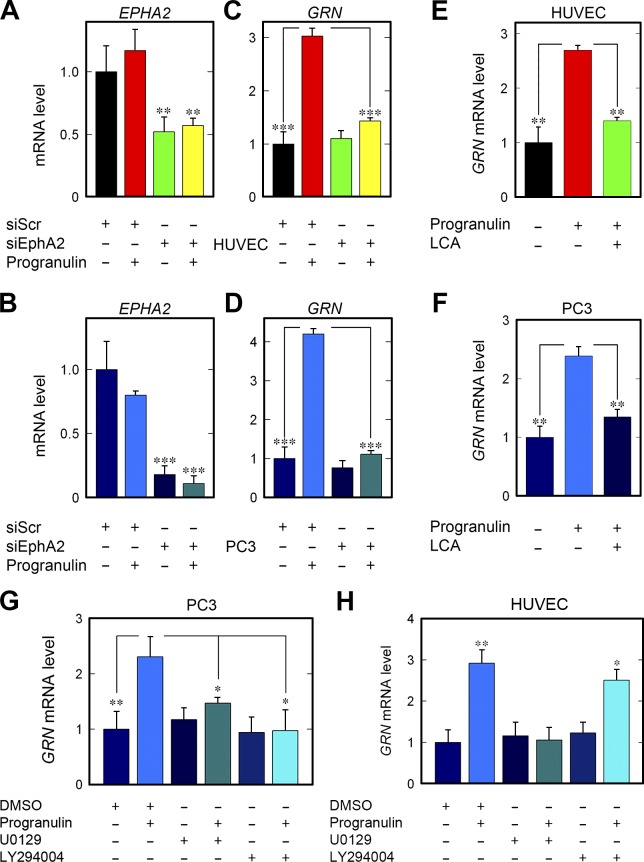
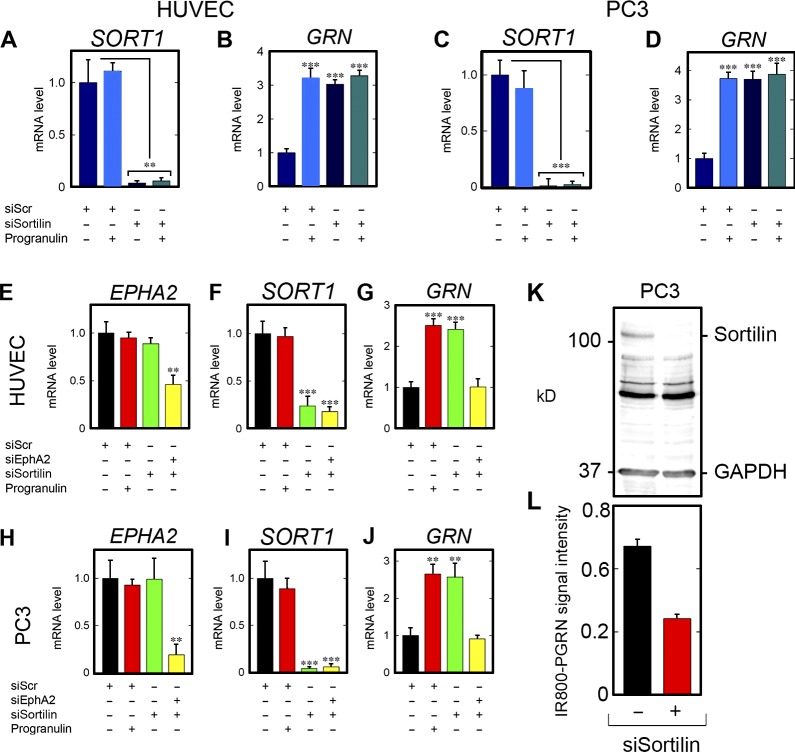
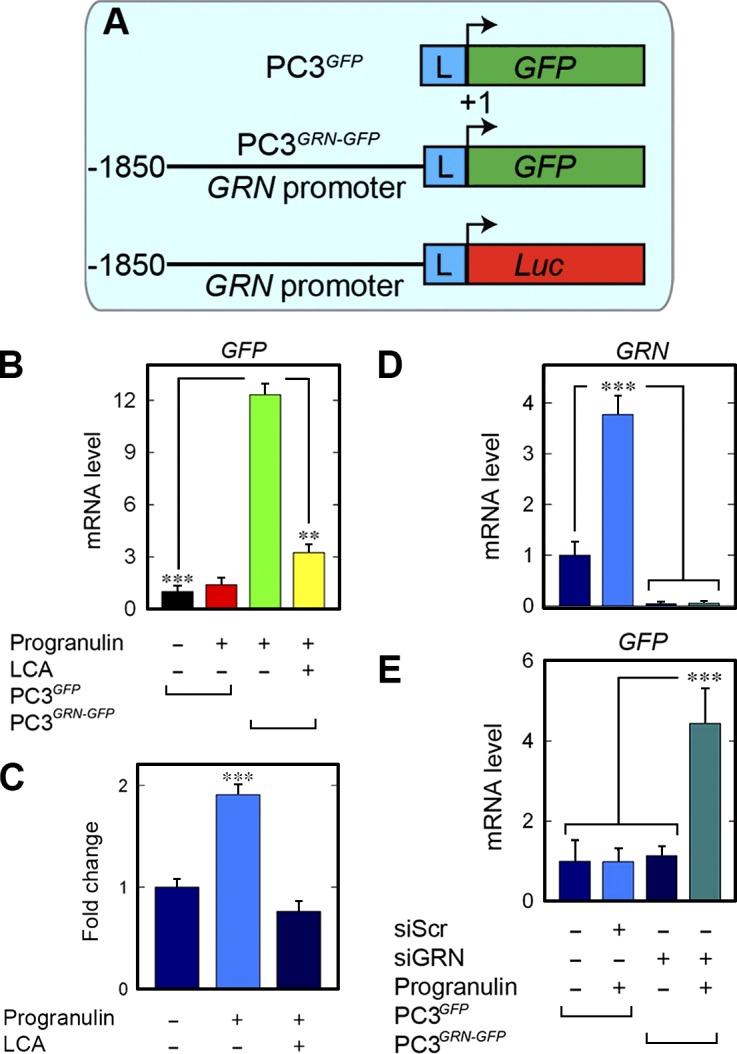
Although the growth factor progranulin was discovered more than two decades ago, the functional receptor remains elusive. Here, we discovered that EphA2, a member of the large family of Ephrin receptor tyrosine kinases, is a functional signaling receptor for progranulin. Recombinant progranulin bound with high affinity to EphA2 in both solid phase and solution. Interaction of progranulin with EphA2 caused prolonged activation of the receptor, downstream stimulation of mitogen-activated protein kinase and Akt, and promotion of capillary morphogenesis. Furthermore, we found an autoregulatory mechanism of progranulin whereby a feed-forward loop occurred in an EphA2-dependent manner that was independent of the endocytic receptor sortilin. The discovery of a functional signaling receptor for progranulin offers a new avenue for understanding the underlying mode of action of progranulin in cancer progression, tumor angiogenesis, and perhaps neurodegenerative diseases.


Figures

Figure 1.
Figure 1.
Progranulin activates EphA2. (A) Phospho-RTK arrays of serum-starved T24 cells and T24 cells treated with progranulin for 10 min (100 nM). Note that after progranulin incubation EGFR, EphA2, EphA4, and EphB2 are phosphorylated. (B) Immunoprecipitation (IP) of EphA2 from quiescent T24 cells exposed to progranulin (100 nM) for the times indicated. The immunoprecipitated extracts were probed with PY20 and detected by chemiluminescence, stripped, and reprobed with anti-EphA2 or anti-Erk1/2. The Coomassie blue–stained markers, as detected by infrared, appear in lane 1. (C) Immunoprecipitation of EphA2 from HUVECs followed by EphA2 and phospho-Tyr immunoblots (IB; left and right, respectively) in the absence or presence of progranulin, as denoted by − or + above the lane. Cells were treated with progranulin for 30 min.
Figure 2.
Figure 2.
Progranulin interacts with EphA2. (A and B) Solid-phase binding assays using progranulin (100 ng/well) as immobilized substrate and EphA2-Fc as soluble ligand (A) or EphA2-Fc (100 ng/well) as immobilized substrate with soluble progranulin (B). (C) Solid-phase binding assay using immobilized EphA2-Fc and EphrinA1-Fc as a soluble ligand. (D and E) Displacement of bound progranulin (100 ng/well; D) or bound EphrinA1-Fc (100 ng/well; E) from EphA2-Fc with LCA. (F) Solid-phase binding assay using immobilized EphA2-Fc (100 ng/well) and a nonrelevant Fc-fusion protein, VEGFR1-Fc (red triangles) or endorepellin (black circles). (G) Interaction between fluorescently labeled, purified progranulin (20 nM) with recombinant EphA2-Fc. (H) Interaction of fluorescently labeled EphrinA1-Fc (20 nM) with recombinant EphA2-Fc. Changes in thermophoresis at concentrations (of EphA2-Fc) from 1 µM to 0.4 nM were used. (I and J) BSA served as a negative control for binding EphA2-Fc (I) and progranulin (J). Labeled progranulin (20 nM) with increasing concentrations of nonlabeled BSA (up to 10 µM) were used, and changes in thermophoresis were measured. The reported Kd was calculated from four independent thermophoresis measurements. FNorm (%) indicates normalized fluorescence per million. Values represent the mean ± SEM of three independent experiments performed in triplicate.
Figure 3.
Figure 3.
Progranulin colocalizes with EphA2. (A–E) Representative confocal images of vehicle-treated cells evaluated at low magnification (A) for EphA2 (B), progranulin (C), and both (D) at high magnification from the same field as in A. (E) Line scanning profiles for colocalized pixels shown in D and measured between the white arrows, indicated by the dotted line. Exogenous progranulin for 10 min (F–J) and associated line scan analysis (J) and for 20 min (K–O) with line scanning (O). (P) EphA2 primary antibody was omitted as a negative control. All images were taken with the same exposure, gain, and intensity. Bar, ∼10 µm. (Q–S) Pearson’s coefficient of colocalization was calculated for EphA2 (Q), progranulin (R), and the degree of overlap (S) for each time point. Values represent the mean of three independent experiments in HUVECs and are represented as box plots. Statistics were generated by one-way ANOVA (***, P < 0.001).
Figure 4.
Figure 4.
Progranulin binding requires EphA2 at the cell surface and stimulates MAPK and Akt. (A) Gel of increasing concentrations of IR800-labeled progranulin (B) solid-phase binding assay of labeled progranulin to immobilized EphA2-Fc. (C) In-cell binding using equimolar equivalencies of either IR800-progranulin (C, top) or IR800-progranulin in combination with EphrinA1-Fc (C, bottom). (D) Resulting displacement curve and corresponding IC50 value after exposure to increasing concentrations of EphrinA1-Fc. (E) In-cell binding using IR800-progranulin and DRAQ5 (genomic DNA) in the absence or presence of LCA (100 µM). (F) Signal intensity of bound IR800-progranulin normalized to DRAQ5. (G) Immunoblotting depicting RNAi-mediated silencing of EphA2. (H). In-cell binding assay using IR800-progranulin after transfection of siRNA against EphA2. (I) Quantification of IR800-progranulin signal intensity after DRAQ5 normalization, as in F. (J–M) Representative immunoblots of phosphorylated MAPK in quiescent PC3 (J) and HUVECs (K) or phosphorylated Akt in PC3 (L) and HUVECs (M) after progranulin stimulation at the indicated time points. (N) Immunoblotting and quantification of phosphorylated Akt and MAPK in PC3 after combination treatment of progranulin with LCA, as designated. Bar, ∼1 cm (C, E, and H). Data are representative of at least three independent experiments and are reported as the fold change ± SEM. *, P < 0.05; **, P < 0.01; ***, P < 0.001.
Figure 5.
Figure 5.
EphA2 is required for progranulin-evoked stimulation of capillary morphogenesis. (A) Immunoblotting verification of EphA2 silencing. (B–E) Representative capillary morphogenesis bright-field images of HUVECs embedded on Matrigel, transfected with siScr or siEphA2, and challenged with progranulin (100 nM). (F) Morphometric parameter quantification for surface area of the Matrigel capillary morphogenesis assay. The accompanying quantification represents mean tube surface area ± SEM from five experiments.
Figure 6.
Figure 6.
Progranulin stimulates GRN expression in HUVECs and PC3 cells. (A and C) Dose–response of GRN in HUVECs (A) or PC3 cells (C) to progranulin (6 h) at the indicated concentrations. (B and D) Time course of GRN expression in HUVECs (B) or PC3 cells (D) after progranulin (50 nM) at the indicated time points. (E and F) Analysis of VEGFA (E) and MYC (F) expression after progranulin treatment (50 nM, 2 h). (G) Analysis of GRN mRNA after EphrinA1-Fc (50 nM, 2 h). Data are the result of at least three independent experiments and are reported as fold change ± SEM. ACTB served as an internal housekeeping gene for all expression analyses. Statistical significance for A–D was determined via one-way ANOVA (*, P < 0.05; **, P < 0.01).
Figure 7.
Figure 7.
EphA2 is required for progranulin-mediated autoregulation of GRN. (A and C) Depletion of EPHA2 (A) and resulting effect on GRN (C) in HUVECs after progranulin stimulation (6 h). (B and D) EphA2 silencing in PC3 cells (B) and ensuing effect on GRN after progranulin (2 h; D). (E and F) Pharmacological manipulation of HUVECs (E) and PC3 cells (F) with LCA in combination with progranulin and queried for GRN expression. (G and H) Evaluation of GRN expression after pretreatment (1 h) of PC3 cells (G) or HUVECs (H) with the MAPK inhibitor (U0129, 10 µM) or Akt inhibitor (LY294004, 10 µM) and stimulated with progranulin. Data result from at least three independent experiments and are reported as fold change ± SEM. *, P < 0.05; **, P < 0.01; ***, P < 0.001.
Figure 8.
Figure 8.
EphA2, but not sortilin, allows GRN induction after progranulin stimulation. (A and B) In HUVECs, verification of SORT1 depletion (A) and evaluation of GRN (B). (C and D) Verification of SORT1 depletion in PC3 cells (C) and GRN expression (D) after challenge with progranulin. (E–G) Dual silencing and confirmation of EPHA2 loss (E) and SORT1 loss (F) and subsequent evaluation of dual knockdown on GRN (G) in HUVECs. (H–J) Identical experiment performed in PC3 cells. For E–J, siScr was transfected and stimulated with progranulin (50 nM). For dual silencing, siRNA for EPHA2 and SORT1 were mixed and transfected in tandem, without exogenous progranulin. (K and L) Verification of sortilin depletion (K) and quantification of in-cell binding assay using IR800-labeled progranulin in PC3 cells (L). Data are the result of at least four independent experiments and are reported as fold change ± SEM. Statistical analyses for conditions with three or more groups, one-way ANOVA (**, P < 0.01; ***, P < 0.001).
Figure 9.
Figure 9.
Progranulin stimulates a GRN-GFP reporter via EphA2. (A) Schematic of the GFP reporter constructs of empty GFP (top), GRN-GFP (middle), and GRN-Luc (bottom). L, linker region of the pGL3 backbone. (B) Quantification of GFP from PC3GFP or the active reporter PC3GRN-GFP cells after progranulin. (C) PC3 cells were transiently transfected with GRN-Luc and assayed for luciferase activity. Modulation of GRN promoter activity was evaluated after incubation with progranulin with or without LCA. Data are shown as mean ± SEM of three independent experiments; n = 6 for each condition. (D and E) Quantification of GRN and GFP levels after depletion of endogenous progranulin from the PC3 reporter cell lines. Data reported as mean ± SEM and represent at least three independent experiments. **, P < 0.01; ***, P < 0.001.

References

    1. Ahmed Z., Sheng H., Xu Y.F., Lin W.L., Innes A.E., Gass J., Yu X., Wuertzer C.A., Hou H., Chiba S., et al. 2010. Accelerated lipofuscinosis and ubiquitination in granulin knockout mice suggest a role for progranulin in successful aging. Am. J. Pathol. 177:311–324. 10.2353/ajpath.2010.090915 - DOI - PMC - PubMed
    1. Al-Ayadhi L.Y., and Mostafa G.A.. 2011. Low plasma progranulin levels in children with autism. J. Neuroinflammation. 8:111 10.1186/1742-2094-8-111 - DOI - PMC - PubMed
    1. Baker M., Mackenzie I.R., Pickering-Brown S.M., Gass J., Rademakers R., Lindholm C., Snowden J., Adamson J., Sadovnick A.D., Rollinson S., et al. 2006. Mutations in progranulin cause tau-negative frontotemporal dementia linked to chromosome 17. Nature. 442:916–919. 10.1038/nature05016 - DOI - PubMed
    1. Bateman A., and Bennett H.P.. 2009. The granulin gene family: From cancer to dementia. BioEssays. 31:1245–1254. 10.1002/bies.200900086 - DOI - PubMed
    1. Bhandari V., Palfree R.G.E., and Bateman A.. 1992. Isolation and sequence of the granulin precursor cDNA from human bone marrow reveals tandem cysteine-rich granulin domains. Proc. Natl. Acad. Sci. USA. 89:1715–1719. 10.1073/pnas.89.5.1715 - DOI - PMC - PubMed

MeSH terms