

The Genomic Architecture of Interactions Between Natural Genetic Polymorphisms and Environments in Yeast Growth
- PMID: 27903611
- PMCID: PMC5289860
- DOI: 10.1534/genetics.116.195487
The Genomic Architecture of Interactions Between Natural Genetic Polymorphisms and Environments in Yeast Growth
Abstract
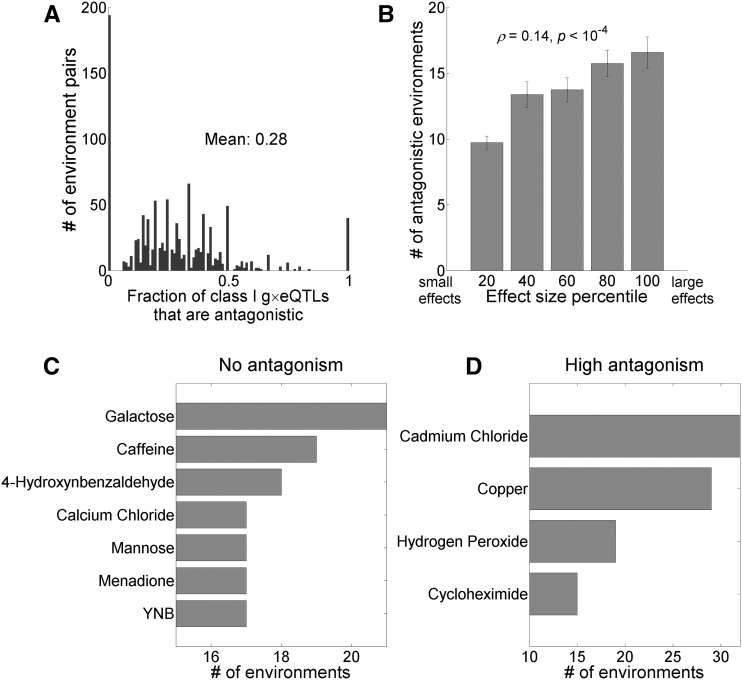
Gene-environment interaction (G×E) refers to the phenomenon that the same mutation has different phenotypic effects in different environments. Although quantitative trait loci (QTLs) exhibiting G×E have been reported, little is known about the general properties of G×E, and those of its underlying QTLs. Here, we use the genotypes of 1005 segregants from a cross between two Saccharomyces cerevisiae strains, and the growth rates of these segregants in 47 environments, to identify growth rate QTLs (gQTLs) in each environment, and QTLs that have different growth effects in each pair of environments (g×eQTLs) . The average number of g×eQTLs identified between two environments is 0.58 times the number of unique gQTLs identified in these environments, revealing a high abundance of G×E. Eighty-seven percent of g×eQTLs belong to gQTLs, supporting the practice of identifying g×eQTLs from gQTLs. Most g×eQTLs identified from gQTLs have concordant effects between environments, but, as the effect size of a mutation in one environment enlarges, the probability of antagonism in the other environment increases. Antagonistic g×eQTLs are enriched in dissimilar environments. Relative to gQTLs, g×eQTLs tend to occur at intronic and synonymous sites. The gene ontology (GO) distributions of gQTLs and g×eQTLs are significantly different, as are those of antagonistic and concordant g×eQTLs. Simulations based on the yeast data showed that ignoring G×E causes substantial missing heritability. Together, our findings reveal the genomic architecture of G×E in yeast growth, and demonstrate the importance of G×E in explaining phenotypic variation and missing heritability.
Keywords: QTL mapping; Saccharomyces cerevisiae; antagonism; missing heritability; pleiotropy.
Copyright © 2017 by the Genetics Society of America.
Figures


Similar articles
-
Resolving the Complex Genetic Basis of Phenotypic Variation and Variability of Cellular Growth.Genetics. 2017 Jul;206(3):1645-1657. doi: 10.1534/genetics.116.195180. Epub 2017 May 11. Genetics. 2017. PMID: 28495957 Free PMC article.
-
Dissection of the molecular bases of genotype x environment interactions: a study of phenotypic plasticity of Saccharomyces cerevisiae in grape juices.BMC Genomics. 2018 Nov 9;19(1):772. doi: 10.1186/s12864-018-5145-4. BMC Genomics. 2018. PMID: 30409183 Free PMC article.
-
Genotype×environment interaction QTL mapping in plants: lessons from Arabidopsis.Trends Plant Sci. 2014 Jun;19(6):390-8. doi: 10.1016/j.tplants.2014.01.001. Epub 2014 Jan 31. Trends Plant Sci. 2014. PMID: 24491827 Review.
-
A simulation-based assessment of the efficiency of QTL mapping under environment and genotype x environment interaction effects.PLoS One. 2023 Nov 30;18(11):e0295245. doi: 10.1371/journal.pone.0295245. eCollection 2023. PLoS One. 2023. PMID: 38033088 Free PMC article.
-
Gene-gene and gene-environment interactions in complex traits in yeast.Yeast. 2018 Jun;35(6):403-416. doi: 10.1002/yea.3304. Epub 2018 Feb 22. Yeast. 2018. PMID: 29322552 Review.
Cited by
-
Caution in testing phenotypic selection.Proc Natl Acad Sci U S A. 2021 Mar 2;118(9):e2022180118. doi: 10.1073/pnas.2022180118. Proc Natl Acad Sci U S A. 2021. PMID: 33619104 Free PMC article. No abstract available.
-
Multi-environment fitness landscapes of a tRNA gene.Nat Ecol Evol. 2018 Jun;2(6):1025-1032. doi: 10.1038/s41559-018-0549-8. Epub 2018 Apr 23. Nat Ecol Evol. 2018. PMID: 29686238 Free PMC article.
-
Patterns and evolutionary consequences of pleiotropy.Annu Rev Ecol Evol Syst. 2023 Nov;54:1-19. doi: 10.1146/annurev-ecolsys-022323-083451. Annu Rev Ecol Evol Syst. 2023. PMID: 39473988 Free PMC article.
-
What Has Genomics Taught An Evolutionary Biologist?Genomics Proteomics Bioinformatics. 2023 Feb;21(1):1-12. doi: 10.1016/j.gpb.2023.01.005. Epub 2023 Jan 28. Genomics Proteomics Bioinformatics. 2023. PMID: 36720382 Free PMC article. Review.
-
Environment-dependent pleiotropic effects of mutations on the maximum growth rate r and carrying capacity K of population growth.PLoS Biol. 2019 Jan 25;17(1):e3000121. doi: 10.1371/journal.pbio.3000121. eCollection 2019 Jan. PLoS Biol. 2019. PMID: 30682014 Free PMC article.
References
-
- Bedhomme S., Lafforgue G., Elena S. F., 2012. Multihost experimental evolution of a plant RNA virus reveals local adaptation and host-specific mutations. Mol. Biol. Evol. 29: 1481–1492. - PubMed
MeSH terms
Grants and funding
LinkOut - more resources
Full Text Sources
Other Literature Sources
Molecular Biology Databases
