. 2017 Feb;27(2):185-195.
doi: 10.1101/gr.209163.116. Epub 2016 Nov 30.

Whole-transcriptome sequencing identifies a distinct subtype of acute lymphoblastic leukemia with predominant genomic abnormalities of EP300 and CREBBP

Affiliations

Whole-transcriptome sequencing identifies a distinct subtype of acute lymphoblastic leukemia with predominant genomic abnormalities of EP300 and CREBBP

Maoxiang Qian et al. Genome Res. 2017 Feb.

Abstract

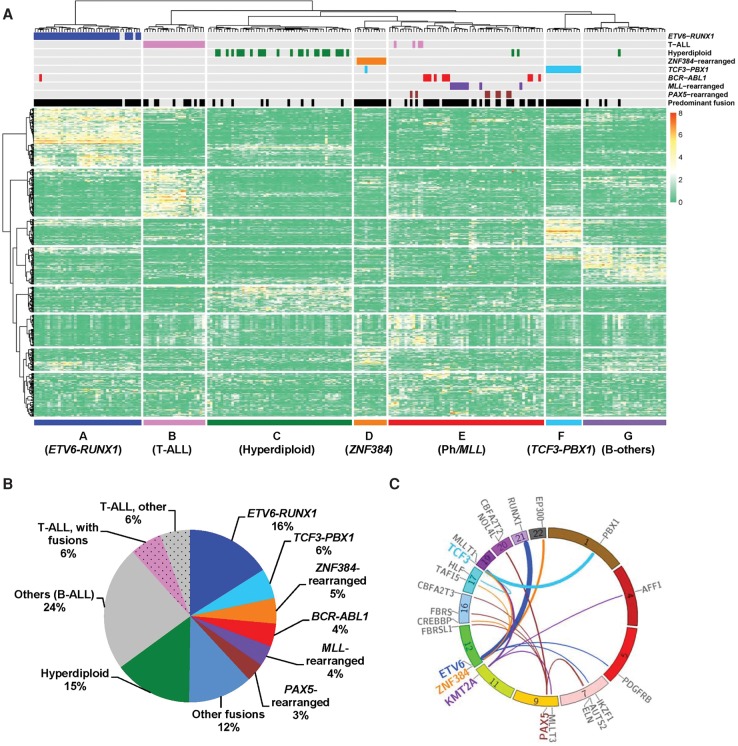
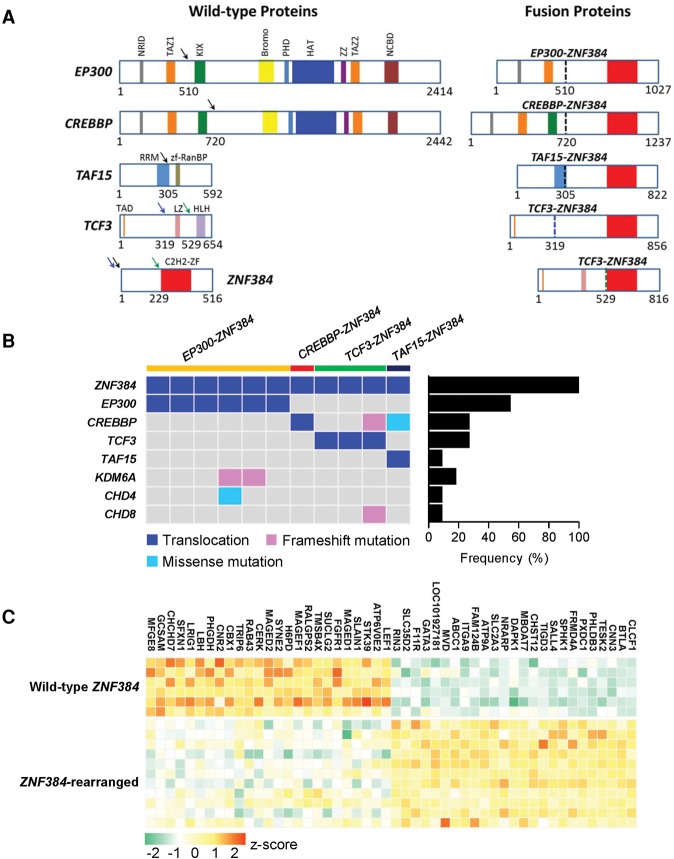
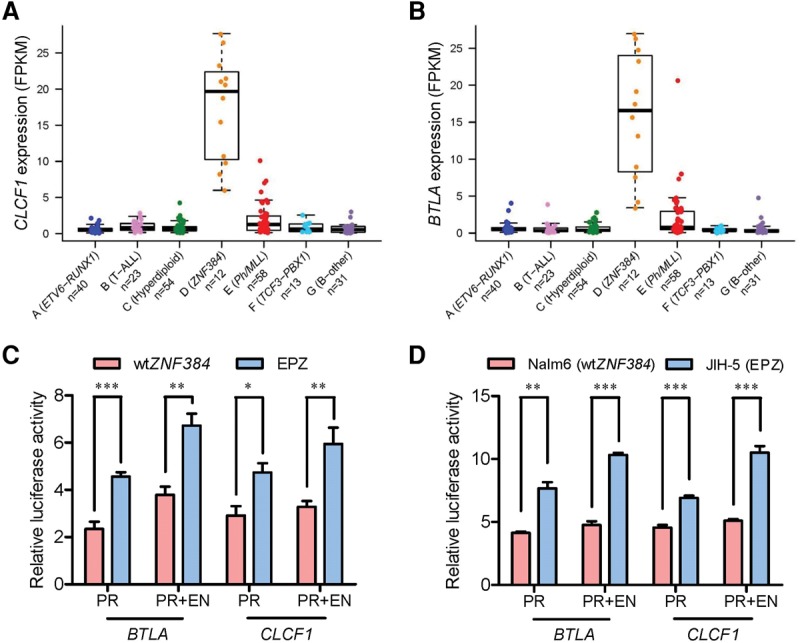
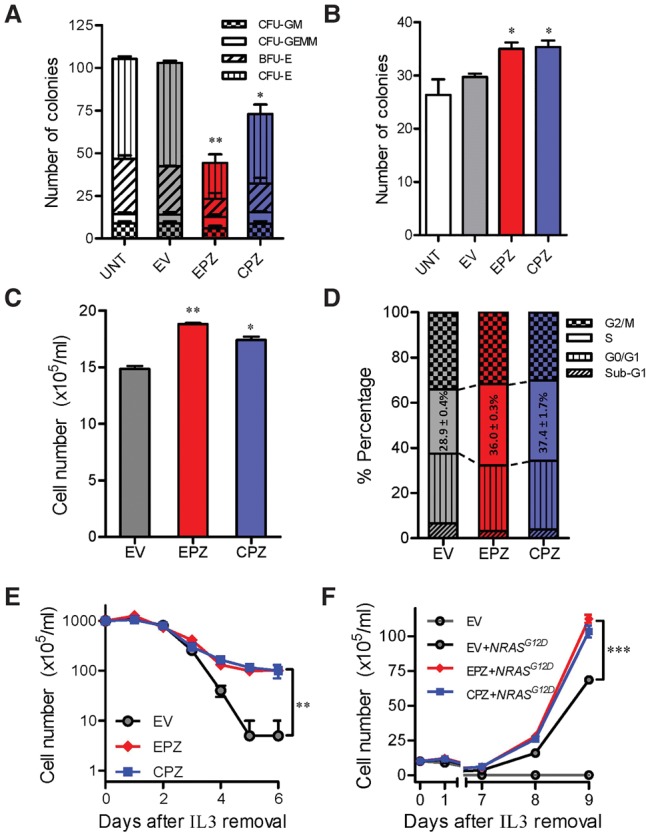
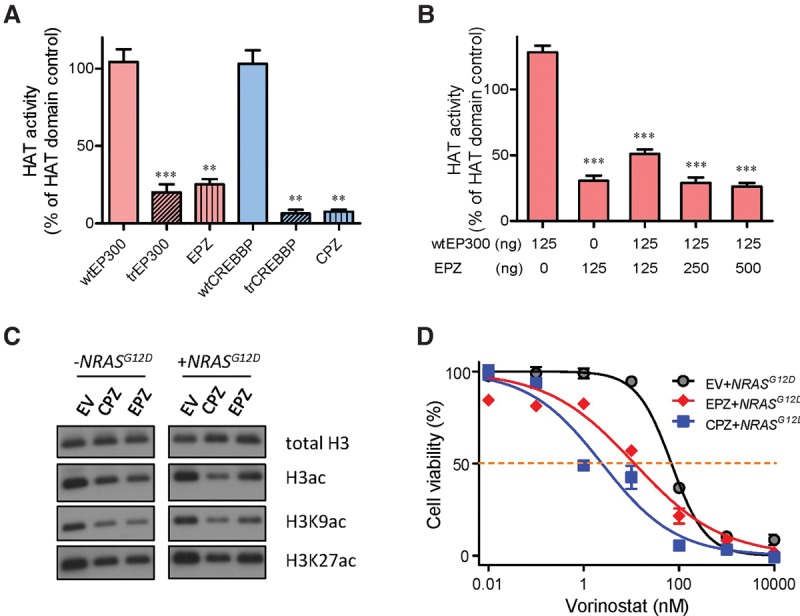
Chromosomal translocations are a genomic hallmark of many hematologic malignancies. Often as initiating events, these structural abnormalities result in fusion proteins involving transcription factors important for hematopoietic differentiation and/or signaling molecules regulating cell proliferation and cell cycle. In contrast, epigenetic regulator genes are more frequently targeted by somatic sequence mutations, possibly as secondary events to further potentiate leukemogenesis. Through comprehensive whole-transcriptome sequencing of 231 children with acute lymphoblastic leukemia (ALL), we identified 58 putative functional and predominant fusion genes in 54.1% of patients (n = 125), 31 of which have not been reported previously. In particular, we described a distinct ALL subtype with a characteristic gene expression signature predominantly driven by chromosomal rearrangements of the ZNF384 gene with histone acetyltransferases EP300 and CREBBP ZNF384-rearranged ALL showed significant up-regulation of CLCF1 and BTLA expression, and ZNF384 fusion proteins consistently showed higher activity to promote transcription of these target genes relative to wild-type ZNF384 in vitro. Ectopic expression of EP300-ZNF384 and CREBBP-ZNF384 fusion altered differentiation of mouse hematopoietic stem and progenitor cells and also potentiated oncogenic transformation in vitro. EP300- and CREBBP-ZNF384 fusions resulted in loss of histone lysine acetyltransferase activity in a dominant-negative fashion, with concomitant global reduction of histone acetylation and increased sensitivity of leukemia cells to histone deacetylase inhibitors. In conclusion, our results indicate that gene fusion is a common class of genomic abnormalities in childhood ALL and that recurrent translocations involving EP300 and CREBBP may cause epigenetic deregulation with potential for therapeutic targeting.


Figures

Figure 1.
Figure 1.
Whole-transcriptome sequencing of childhood ALL. (A) Unsupervised hierarchical clustering of global gene expression profile from 231 children with newly diagnosed ALL. Columns indicate ALL patients, and rows are genes; gene overexpression and underexpression are shown in red and green, respectively. ALL immunophenotype, cytogenetics, and selected chromosomal translocations are indicated for each sample above the heatmap, and the text below denotes seven major ALL subgroups identified on the basis on gene expression profiles. “Predominant fusion” refers to likely functional and driver fusion event, as defined in the Methods and Supplemental Figure S3A. (B) Pie chart of major gene fusions and cytogenetic abnormalities identified in B-ALL and T-ALL. Percentage indicates prevalence in the entire cohort; B-ALL and T-ALL are discriminated by solid fill and dot pattern, respectively. (C) Circos plot of the predominant fusions involving frequently translocated genes (i.e., genes with three or more different translocation partners identified). The line links the two partner genes in a fusion, with line width indicative of the prevalence of the specific fusion.
Figure 2.
Figure 2.
Genomic abnormalities in ZNF384-rearranged ALL. (A) Schematic representation of ZNF384 rearrangement in ALL. (Left) The wild-type proteins and their domain structures. Arrows indicate breakpoints observed in ALL samples, and colored blocks represent protein functional domains. (Right) The predicted ZNF384 fusion proteins. Dashed vertical lines mark the junction between fusion partners and are color-coded according to the breakpoint (arrows) in the left panel. (B) ZNF384-rearranged cases were also subjected to whole-exome sequencing, and putative functional genomic lesions (translocation, frameshift, and missense mutations) in selected genes are indicated for each case (left). (Right) Bar graph denotes the cumulative frequency of genomic lesion in each gene in ZNF384-rearranged ALL. (C) Heatmap shows the top 50 differentially expressed genes. Columns indicate genes, and rows are patients or patient groups. Expression value is indicated for individual patient with ZNF384 rearrangement; for cases without ZNF384 rearrangement (wild-type), expression is shown as the mean expression value for each ALL subgroup. The normalized expression level for each gene (z-score) is indicated by a color (red and green for over- and underexpression, respectively).
Figure 3.
Figure 3.
ZNF384 fusions transactivated CLCF1 and BTLA expression. (A,B) Expression of the CLCF1 (A) and BTLA (B) genes in seven ALL subgroups identified from hierarchical clustering. Each sample is represented by a dot and is color-coded according to the subgroups it belongs to. (C,D) Luciferase reporter gene assay of BTLA and CLCF1 promoter/enhancer activity. HEK293T cells were transiently transfected with pGL3 construct (luciferase gene with BTLA or CLCF1 promoter [PR] and/or enhancer [EN]), pcDNA construct (wild-type ZNF384 [wtZNF384] or EP300-ZNF384 [EPZ]), and pGL-TK (Renilla luciferase) (C). Similar sets of reporter gene assay were performed in the ALL cell lines Nalm6 (wtZNF384) and JIH-5 (EPZ) (D). Firefly luciferase activity was measured 24 h post-transfection and normalized to Renilla luciferase activity. Relative luciferase activity indicates the ratio over the value from pGL3 basic vector alone. All experiments were performed in triplicate and repeated at least three times. (PR) Promoter; (EN) enhancer; (wtZNF384) wild-type ZNF384; (EPZ) EP300-ZNF384 fusion. Statistical significance was evaluated by using two-sided Student's t-test: (*) P < 0.05; (**) P < 0.01; (***) P < 0.001.
Figure 4.
Figure 4.
EP300- and CREBBP-ZNF384 fusions influence hematopoiesis and hematopoietic progenitor cell transformation in vitro. (A,B) Effects of fusion genes on mouse hematopoiesis in vitro. Mouse LinSca1+c-Kit+ cells were lentivirally transduced with empty vector (gray), EP300-ZNF384 (red), or CREBBP-ZNF384 (blue). Cells were then cultured in methylcellulose medium supplemented with cytokines for myelopoisis (A) or pre-B-cell differentiation (B), and colony formation was assessed 12–14 d later. (C,D) ZNF384 fusion genes and proliferation of mouse hematopoietic progenitor cell Ba/f3. Ba/f3 cells were lentivirally transduced with empty vector (grey), EP300-ZNF384 (red), or CREBBP-ZNF384 (blue) and then cultured in the presence of IL3 (10 ng/mL). After 48 h, cell density was examined using Trypan blue (C), and cell cycle distribution was evaluated using a standard PI staining protocol (D). (E,F) Effects of fusion genes on Ba/f3 transformation. Following transduction of empty vector or ZNF384 fusion genes, Ba/f3 cells were cultured in IL3-depleted medium with cytokine-independent cell growth as a measure of oncogenic transformation. The number of viable cells was evaluated daily (E). A similar set of experiments was performed with cotransduction of oncogenic NRASG12D (F). All experiments were performed in triplicate and repeated twice. (EV) Empty vector; (EPZ) EP300-ZNF384 fusion; (CPZ) CREBBP-ZNF384 fusion; (CFU-GM) colony-forming unit–granulocyte, macrophage; (CFU-GEMM) colony-forming unit–granulocyte, erythrocyte, macrophage, megakaryocyte; (BFU-E) burst-forming unit–erythroid; (CFU-E) colony-forming unit–erythroid. Statistical significance of the differences between EPZ versus EV or between CPZ versus EV was estimated by using two-sided Student's t-test (AC) or two-way ANOVA (E,F): (*) P < 0.05; (**) P < 0.01; (***) P < 0.001.
Figure 5.
Figure 5.
EP300- and CREBBP-ZNF384 fusions resulted in loss of HAT activity, global histone acetylation deregulation, and sensitivity to HDAC inhibition. (A,B) HAT enzymatic activity was measured for various EP300 and CREBBP proteins: wild-type, truncated, and ZNF384 fusions. Proteins were expressed in Sf9 insect cells and purified to homogeneity. (A) HAT activity was determined for each protein individually. (B) In parallel, wild-type EP300 was mixed with increasing amount of EP300-ZNF384 fusion protein to examine dominant-negative effects of the latter on HAT activity. (C) Global H3, H3K9, and H3K27 acetylation were evaluated by Western blot in Ba/f3 cells overexpressing EP300-/CREBBP-ZNF384 fusion, with total H3 as a loading control. (D) Cytotoxicity of HDAC inhibitor vorinostat was examined in NRASG12D-transformed Ba/f3 cells expressing EP300-ZNF384 (red) or CREBBP-ZNF384 (blue) or transduced with empty vector (gray). Cells were incubated with vorinostat for 48 h, and viability was then measured using a MTT assay. Experiments were performed in triplicate and repeated at least three times. (wtEP300) Wild-type EP300; (trEP300) truncated EP300; (wtCREBBP) wild-type CREBBP; (trCREBBP) truncated CREBBP; (EPZ) EP300-ZNF384 fusion; (CPZ) CREBBP-ZNF384 fusion; (EV) empty vector. EPZ- or CPZ-transduced cells were significantly more sensitive to vorinostat than EV, as determined by two-way ANOVA (P < 0.001). (A,B) Statistical significance was evaluated by using a two-sided Student's t-test: (**) P < 0.01; (***) P < 0.001.

References

    1. Abraham BJ, Cui K, Tang Q, Zhao K. 2013. Dynamic regulation of epigenomic landscapes during hematopoiesis. BMC Genomics 14: 193. - PMC - PubMed
    1. Ait-Si-Ali S, Ramirez S, Barre FX, Dkhissi F, Magnaghi-Jaulin L, Girault JA, Robin P, Knibiehler M, Pritchard LL, Ducommun B, et al. 1998. Histone acetyltransferase activity of CBP is controlled by cycle-dependent kinases and oncoprotein E1A. Nature 396: 184–186. - PubMed
    1. Anderson K, Lutz C, van Delft FW, Bateman CM, Guo Y, Colman SM, Kempski H, Moorman AV, Titley I, Swansbury J, et al. 2011. Genetic variegation of clonal architecture and propagating cells in leukaemia. Nature 469: 356–361. - PubMed
    1. Atak ZK, Gianfelici V, Hulselmans G, De Keersmaecker K, Devasia AG, Geerdens E, Mentens N, Chiaretti S, Durinck K, Uyttebroeck A, et al. 2013. Comprehensive analysis of transcriptome variation uncovers known and novel driver events in T-cell acute lymphoblastic leukemia. PLoS Genet 9: e1003997. - PMC - PubMed
    1. Balasubramani A, Larjo A, Bassein JA, Chang X, Hastie RB, Togher SM, Lahdesmaki H, Rao A. 2015. Cancer-associated ASXL1 mutations may act as gain-of-function mutations of the ASXL1–BAP1 complex. Nature Commun 6: 7307. - PMC - PubMed

Publication types

LinkOut - more resources